
The RECALCAR project (Resources and Quality in Cardiology), an initiative of the Spanish Society of Cardiology, aims to standardize information to generate evidence on cardiovascular health outcomes. The objective of this study was to analyze trends in the resources and activity of cardiology units and/or services and to identify the results of cardiovascular care during the last decade in Spain.
MethodsThe study was based on the 2 annual data sources of the RECALCAR project: a survey on resources and activity of cardiology units and/or services (2011-2020) and the minimum data set of the National Health System (2011-2019), referring to heart failure (HF), STEMI, and non-STEMI.
ResultsThe survey included 70% of cardiology units and/or services in Spain. The number of hospital beds and length of stay decreased, while there was a notable increase in the number of cardiac imaging studies and percutaneous therapeutic procedures performed. Age- and sex-adjusted admissions for HF tended to decrease, despite an increase in mortality and the percentage of readmissions. In contrast, the trend in mortality and readmissions was highly favorable in STEMI; in non-STEMI, although positive, the trend was less marked.
ConclusionsThe information provided by the RECALCAR project shows a favorable trend in the last decade in resources, activity and results of certain cardiovascular processes and constitutes an essential source for future improvements and decision-making in health policy.
Keywords
Improvements in health care efficiency and sustainability require organizational reforms achieved by preparing and promoting scientific, technical, and clinical management standards to ensure health care quality, safety, and efficiency.1,2 The continuous improvement process of any organization, including health care institutions, is based on systematic records and adequate interpretation of the data.3 Information must first be homogenized and standardized before data can be shared and evidence can be generated on health outcomes, particularly in terms of health care quality and equity.2 For more than a decade, the objectives of the Spanish Society of Cardiology (SEC) have included preparing and promoting clinical standards through a policy of working with public agencies to ensure and encourage continuous improvements in cardiovascular care quality. The RECALCAR (Resources and Quality in Cardiology) project, one of its initiatives, uses a survey to evaluate the resources, organization, and activity of cardiology units and departments in Spain and analyzes how this information relates to cardiovascular outcomes by analyzing the minimum data set (MDS) and other SEC registries. This project is widely recognized as a powerful instrument for cardiovascular health care research.4–9
The purpose of this study was to analyze trends in the structures, resources, activity, and outcomes of cardiology units and departments in the past decade and to identify, according to these parameters, the current status of cardiovascular health care in Spain. To analyze health outcomes, trends of usage rates, mortality, and readmissions were assessed for the 3 most common processes in inpatient cardiovascular health care: heart failure (HF), ST-segment elevation myocardial infarction (STEMI), and non–ST-segment elevation myocardial infarction (NSTEMI).
METHODSThe RECALCAR project is based on 2 sources of data recorded yearly: a survey on the resources, structure, activity, and quality of cardiology units and departments, undertaken since 2011, and an analysis of the Spanish National Health System (NHS) MDS database for cardiovascular health care.
RECALCAR surveyThe survey is carried out in cardiology units and departments at Spanish NHS hospitals for acute patients with 200 or more installed beds and also includes responses from cardiology units at smaller facilities wishing wished to participate in the registry. Since 2013, the data have been collected by an ad hoc questionnaire available on the SEC website (). Any errors or discrepancies are corrected, and the latest version is sent to the department heads to confirm that the information collected is accurate. Additionally, the reliability and consistency of the data and indicators are confirmed by comparing them with other available sources. Information from the National Institute of Statistics and the health care maps of the autonomous communities are consulted to identify any discrepancies when assigning population to the hospital. The Survey of Inpatient Health Establishments and the MDS database of the Spanish NHS are also consulted to compare pooled structure and activity data for the autonomous communities. Likewise, the registries of the scientific associations of the SEC are analyzed to check if the activity data in the registries are consistent with those provided in the survey.
Minimum data set for cardiologyThe Spanish Ministry of Health (MoH) provided the SEC with the MDS database for cardiology (MDS_CAR) for use in the RECALCAR project. MDS_CAR includes the following: a) inpatient episodes coded in Spanish NHS hospitals with a principal diagnosis of “diseases of the cardiac system” (DCS)10 (since 2016, ICD-10: diseases of the circulatory system); b) episodes that, without listing a DCS diagnosis, include cardiologic interventional procedures in the procedure fields, and c) episodes recorded that, without DCS as the principal diagnosis or cardiologic interventional procedures, were discharged by a cardiology or cardiac surgery department. Although MDS_CAR data are available for 2007 to 2019, activity data have only been available since 2011. Therefore, this study, as it relates to the MDS-CAR, covers 2011 to 2019. In 2016, the MoH began to use ICD-10 for diagnostic and procedure coding (ICD-9 was used until 2015).
Types of cardiology units and departmentsBased on experience with the registry, cardiology units and departments were classified into 5 groups (). Type 1 units have no hospital beds assigned to cardiology; type 2 have hospital beds for cardiology but no catheterization lab; type 3 units have beds assigned to cardiology and a catheterization lab, but no cardiovascular surgery department at the hospital; type 4 have beds assigned to cardiology, a catheterization lab, and a cardiovascular surgery department at the hospital, and last, type 5 units have no beds assigned to cardiology but do perform catheterization lab or cardiovascular surgery work.
Statistical analysisQualitative variables are reported with their frequency distribution, and quantitative variables are reported as the mean±standard deviation or median [interquartile range]. For qualitative variables, the difference of proportions was analyzed by the chi-square test. To compare quantitative variables, the normality of distribution and the homogeneity of variances were studied and the Student t test was used, or the Mann-Whitney U test when applicable; to compare 2 groups, and the analysis of variance with the Bonferroni correction, the Kruskal-Wallis test, or the median test were used to compare 3 or more groups. Trends over time were evaluated by using Poisson regression models. Changes in usage trends due to switching the coding system in 2016 were analyzed using the Joinpoint regression program developed by the National Cancer Institute.11
The risk adjustment methods by multivariate logistic regression used in the project are based on the Krumholz methodology for CMS (Centers for Medicare and Medicaid Services)12–16 adapted to the possibilities of the MDS_CAR. Unlike the CMS methodology, the RECALCAR project calculated inpatient mortality instead of overall 30-day mortality. Readmissions have only been estimated for circulatory diseases since 2016, as the Ministry has not provided the entire database. The risk factors and coefficients definitively used in the adjustment models are derived from those derived from the MDS_CAR database.
In all comparisons, the null hypothesis is rejected with an α error <.05. All analyses were performed with SPSS 21.0 v13 (IBM, United States) and STATA v16 (StataCorp ER, United States).
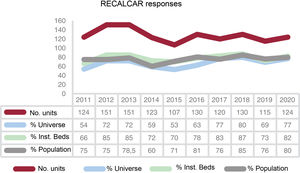
RESULTSSince 2011, responses to the RECALCAR survey have been received each year from 107 to 151 cardiology units and departments (figure 1), accounting for ≈70% of the universe. The units responding to the survey account for ≈75% of the entire population assigned, although their installed beds account for ≈80% of all beds in Spain (figure 1). Type 1 and 2 units are less represented than type 3 and 4 units, with the latter accounting for more than 90%.
: percentage of existing hospital beds in the units answering compared with the total number of beds in the hospitals identifieda; % population: percentage of population in the hospital catchment area for the units answering compared with the total population covered by the Spanish NHS.b aSource: National Catalog of Hospitals. bSource: Annual RECALCAR surveys.")
Trend in the number of responses to the RECALCAR survey and sample representativeness compared with all data from Spain. % universe for the survey: percentage of cardiology units providing information compared with the total for all hospitals in Spain; % inst. beds (installed beds): percentage of existing hospital beds in the units answering compared with the total number of beds in the hospitals identifieda; % population: percentage of population in the hospital catchment area for the units answering compared with the total population covered by the Spanish NHS.b
aSource: National Catalog of Hospitals.
bSource: Annual RECALCAR surveys.
table 1 shows the trend of indicators obtained from the data provided by the RECALCAR survey from 2011 to 2020.
Annual trend of indicators for resources, activity, and productivity for 2011-2020. RECALCAR survey
| Year | 2011 | 2012 | 2013 | 2014 | 2015 | 2016 | 2017 | 2018 | 2019 | 2020 | IRR (2011-2019) | P |
|---|---|---|---|---|---|---|---|---|---|---|---|---|
| Resources and infrastructure | ||||||||||||
| No. cardiologists/100 000 inhab. | 5.1 | 4.7 | 5.3 | 4.9 | 4.9 | 5.2 | 5.3 | 5.5 | 5.4 | 1.013 | .036 | |
| No. cardiology beds/100 000 inhab. | 8.4 | 7.8 | 9.5 | 9.2 | 8.2 | 7.7 | 7.9 | 7.4 | .990 | .285 | ||
| No. type 2 and 3 cardiology beds/100 000 inhab. | 1.0 | 1.0 | 1.4 | 1.1 | 1.1 | 1.1 | 1.2 | 1.1 | 1.010 | .491 | ||
| U/D with cardiology ODPs and more than 1500 discharges/y | 63% | 69% | 72% | 76% | 75% | 81% | 85% | 87% | 86% | 94% | 1.040 | <.001 |
| U/D with heart failure unit | 42% | 44% | 53% | 56% | 60% | 63% | 72% | 79% | 84% | 90% | 1.091 | <.001 |
| U/D with cardiac rehabilitation unit | 31% | 28% | 36% | 45% | 40% | 33% | 53% | 59% | 65% | 65% | 1.102 | <.001 |
| Population (inhab.)/catheterization lab | 308 000 | 300 000 | 293.000 | 318 000 | 300 000 | 366 164 | 333 007 | 317 884 | 344 805 | 330 445 | 1.017 | <.001 |
| Population (inhab.)/electrophysiology lab | 450 000 | 504 000 | 445 000 | 500 000 | 450 000 | 521 273 | 495 159 | 466 357 | 488 162 | 479 499 | 1.006 | .343 |
| Health care activity | ||||||||||||
| No. outpatient visits/1000 inhab. | 16.7 | 15.4 | 15.3 | 16.1 | 14.7 | 18.0 | 16.0 | 15.0 | 21.0 | 14.0 | 1.020 | .249 |
| No. admissions/1000 inhab. | 4.1 | 4.8 | 4.9 | 5.3 | 5.3 | 5.0 | 5.0 | 4.9 | 4.8 | 4.2 | 1.010 | .315 |
| No. stress tests/1000 inhab. | 4.0 | 4.1 | 4.0 | 4.0 | 3.4 | 4.0 | 3.8 | 3.3 | 3.5 | 2.4 | .979 | <.001 |
| No. ultrasounds/1000 inhab. | 20 | 23 | 21 | 24 | 24 | 25 | 27 | 27 | 29 | 21 | 1.043 | <.001 |
| No. diagnostic hemodynamic studies/100 000 inhab. | 311 | 260 | 260 | 280 | 290 | 308 | 303 | 289 | 286 | 260 | 1.005 | .539 |
| PCIs/100 000 inhab. | 134 | 129 | 130 | 132 | 147 | 148 | 147 | 139 | 143 | 131 | 1.014 | .001 |
| PPCIs/100 000 inhab. | 30 | 27 | 32 | 31 | 36 | 38 | 38 | 37 | 36 | 38 | 1.037 | <.001 |
| TAVRs/million inhab. | 26.0 | 33.0 | 33.0 | 39.0 | 61.0 | 68.7 | 84.0 | 81.7 | 1.228 | <.001 | ||
| No. diagnostic EPs/100 000 inhab. | 36.8 | 18.3 | 25.1 | 45.6 | 29.4 | 31.4 | 31.9 | 34.5 | 32.7 | 26.8 | 1.017 | .563 |
| No. therapeutic EPs/100 000 inhab. | 30.3 | 32.3 | 33.2 | 23.0 | 39.9 | 36.8 | 33.0 | 34.7 | 42.5 | 31.6 | 1.035 | .003 |
| Productivity | ||||||||||||
| Median hospital stay, d | 5.6 | 5.3 | 5.5 | 6.2 | 5.2 | 5.2 | 5.0 | 5.0 | 5.0 | 4.8 | .984 | <.001 |
| No. studies/ultrasound machine | 1643 | 2243 | 1873 | 1831 | 1900 | 1937 | 1967 | 1933 | 1907 | 1636 | 1.004 | .785 |
| No. procedures/catheterization lab | 1481 | 1403 | 1213 | 1424 | 1325 | 1562 | 1519 | 1479 | 1614 | 1342 | 1.018 | .054 |
| No. cardiac catheterization procedures/cardiologist | 184 | 180 | 199 | 177 | 192 | 207 | 200 | 197 | 207 | 170 | 1.015 | <.001 |
| No. procedures*/EP lab | 296 | 217 | 308 | 230 | 274 | 276 | 242 | 247 | 282 | 280 | 1.018 | .498 |
EPs, electrophysiological studies; inhab., inhabitants; ODP, on-duty physician; PCI, percutaneous coronary intervention; PPCI, primary PCI; TAVR, transcatheter aortic valve replacement; U/D, cardiology unit/department.
The findings for the study period were as follows: a) a slight increase in the number of cardiologists per 100 000 inhabitants (at present, between 5.4 and 5.5); b) a decrease in the availability of conventional hospital beds assigned to cardiology; c) a similar number of critical care beds (Intensive Care Society levels 2 and 317), although the trend was not statistically significant; d) a large increase in the percentage of cardiology units and departments with more than 1500 discharges per year and with on-duty staff, and e) a very large increase in cardiology units and departments with HF4 and cardiac rehabilitation units, which in 2020 were 90% and 65%, respectively. Population figures assigned per catheterization lab or electrophysiology lab have risen very slightly over the decade.
Health care activityThe number of outpatient visits and admissions per 1000 inhabitants held steady. The various types of remote activity are not included in the indicators, as this information has only been collected since the 2020 RECALCAR survey (COVID-19 pandemic).
In terms of imaging activities, usage increased considerably for echocardiography (3% year-over-year), magnetic resonance imaging, and computed tomography studies performed by cardiology units and departments (records were first kept in 2015, data not included).
Activity indicators for catheterization lab units showed stable levels in the usage of diagnostic studies per 100 000 inhabitants/y, with a significant increase in percutaneous coronary interventions (PCI) and primary PCI (PPCI) procedures, especially in the case of latter (+3.7% year-over-year; P <.001).6 A noticeable increase was observed in percutaneous implantation procedures on the aortic valve (year-over-year rate of growth, +22.8%; P <.001).18 The number of procedures per lab on workdays increased, although not significantly (year-over-year rate of 1.8%), and the annual number of PCIs per cardiologist managing the catheterization lab increased considerably.
Activity indicators for electrophysiology units remained steady in the number of electrophysiology labs per population, but lower than the recommended guidelines for resources.10 The population rate of diagnostic electrophysiological studies remained stable, whereas the rate for therapeutic procedures increased considerably (year-over-year rate, 1.5%; P <.003). Electrophysiology lab usage levels (number of studies per workday) remained stable.
Impact of the COVID-19 pandemic: in 2020, there was a large decrease in the number of consultations, admissions, additional tests, and catheterization and electrophysiology procedures (table 1). In addition, the number of procedures per invasive or noninvasive equipment unit dropped considerably in contrast with the growth trend seen in previous years. Likewise, the number of outpatient visits decreased in 2020, which may be partially offset by the increase in the various types of remote consultations and department referrals.19 There were no data for comparison with previous years, but remote consultations in 2020 showed a 1:2 ratio for initial consultations, and telephone consultations were the most common remote type (62.6%), followed by electronic referrals by primary care physicians (26.7%). Video (3.2%) and email (7.6%) consultations were of minimal importance. There was a significant drop in the mean length of stay in cardiology units and departments (1.6% year-over-year; P <.001).
The current status in terms of structure and staff, hospitalization data, and activity in cardiology units and departments in Spain is shown in table 2, which summarizes the average annual data on resources and infrastructure, health care activity, and productivity for 2018 and 2019. The 2020 data were not included because the situation was distorted by the impact of the COVID-19 pandemic on cardiovascular health care.
Average annual data on resources, activity levels, and productivity obtained from the 2018 and 2019 RECALCAR survey from 124 cardiology units and departments
| Structure/staff | |
| Types of U/D | Type 1: 23% |
| Type 2: 15% | |
| Type 3: 23% | |
| Type 4: 35% | |
| Type 5: 3% | |
| U/D structure | Unit: 21% |
| Department: 58% | |
| Institute, areas, or clinical management units: 17% | |
| No in-house organizational identity: 4% | |
| No. cardiologists per U/D | 17 (17±10) |
| No. cardiologists/million inhab. | 55 |
| Hospitalization data | |
| Conventional hospitalization | Beds per U/D: 30 (31±18) |
| Cardiology beds/100 000 inhab.: 9 | |
| Level 0 and 1 beds: 87% | |
| Level 2 and 3 beds: 13% | |
| Admissions/1000 inhab./y: 4 | |
| Mean length o fstay: 5 (5±1.4) days | |
| Critical care | Level 2 to 3 beds (U/D with>1500 admissions/y): 65% |
| Critical patient beds per U/D: 8 (10±6) | |
| Mean length of stay: 3.1±1.1 days | |
| On-duty care (U/D with ≥ 1500 admissions/y): 94% | |
| Consultations/functional units | |
| Consultations | Initial consultations/1000 inhab./y: 14 |
| Successive/initial consultations: 1.8/1 | |
| Units | Heart failure unit: 90% |
| Cardiac rehabilitation unit: 65% | |
| Noninvasive image/scans | Imaging as an organizational unit in cardiology units and departments: 65% |
| No. echocardiographies/1000 inhab./y: 22 | |
| No. studies per ultrasound machine/y: 1700 (7 per workday) | |
| Cardiologists affiliated with imaging: 20% | |
| No. echocardiographies/y per cardiologist: 2100 (2200±900) | |
| No. echocardiographies/d/cardiologist assigned to the unit: 10 | |
| No. studies per nurse or technician/y assigned to the unit: 2100 | |
| No. Holter studies/1000 inhab./y: 4 | |
| No. stress tests/1000 inhab./y: 2.4 | |
| Catheterization and percutaneous interventions | With catheterization unit: 61% |
| 1 lab per 330 000 inhab. | |
| Cardiologists affiliated with catheterization lab: 20% | |
| No. diagnostic studies/100 000 inhab./y: 270 | |
| No. diagnostic studies/lab/y: 1400±450 (6 per workday) | |
| No. studies/y per cardiologist: 700±200 (3 per workday) | |
| No. PCIs/y per unit: 800±350 | |
| No. PCIs/million inhab./y: 1350 | |
| No. PPCIs/million inhab./y: 400 | |
| No. TAVRs/million inhab./y: 85 | |
| No. atrial appendage closures/million inhab./y: 15 | |
| No. mitral valve percutaneous interventions/million/y: 10 | |
| Electrophysiology | With electrophysiology unit: 62% |
| 1 lab per 480 000 inhab. | |
| Cardiologists affiliated with electrophysiology: 14% | |
| No. diagnostic studies/million inhab./y: 270 | |
| No. studies/lab/y: 550 (2 studies per lab and workday) | |
| No. studies/y/cardiologist: 570 (3 per workday) | |
| No. simple therapeutic procedures/million inhab./y: 200 | |
| No. ablations/million inhab./y: 120 | |
| Cardiac surgery | With cardiac surgery department: 35% |
| 1 cardiac surgery department every 975 000 inhab. | |
| No. major surgical procedures/million inhab./y: 350 | |
| No. major surgical procedures/department: 375±200 | |
| Facilities with a multidisciplinary team: 87% | |
| Training/research | Accredited for residency training: 60% |
| No. residents per cardiol. U/D: 10 | |
| Involved in CIBER/RETIC research: 35% | |
| Competitive research projects: 48% | |
| Perform clinical trials: 68% | |
| Publish at least 1 article in an indexed journal: 72% | |
Cardiol. U/D, cardiology unit/department; inhab., inhabitants; PCI, percutaneous coronary intervention; PPCI, primary PCI; RP, resident physician; TAVR, transcatheter aortic valve replacement.
A total of 60% of cardiology units and departments completing the RECALCAR survey in the past year had been accredited to provide specialist training to resident physicians (MIR) (97% of type 3 and 4 cardiology units and departments), with a median of 10 cardiology residents in training per unit, a level that has remained stable. Virtually all type 3 and 4 units are accredited for residency instruction.
A total of 35% of cardiology units and departments were members of a research network (CIBER/RETIC) under the auspices of the Carlos III Institute, 48% were carrying out research projects under competitive procedures, and 68% were conducting clinical trials. A total of 72% of cardiology units and departments had published at least 1 article in indexed journals.
An upward trend was observed in the number of units belonging to research networks and in the number of publications. Additionally, a clear difference was seen in research activity levels between complex (types 3 and 4) and less complex (types 1 and 2) units.
RECALCAR data obtained from the analysis of the minimum data sets for cardiology
The last year with data available in the MDS-CAR registry is 2019. Considering that the survey was started in 2011 and is completed yearly, trends for the various indicators are only shown for 2011 to 2019. Age- and sex-adjusted usage rates and the risk-adjusted and nonrisk-adjusted indicators of hospital stays, inpatient mortality, and 30-day readmissions were analyzed for HF, STEMI, and NSTEMI (table 3, figure 2, and figure 3). The indicators refer as a whole to all processes admitted to the hospitals, not only to those admitted to cardiology units and departments.
Annual trend of indicators for heart failure and myocardial infarction with and without ST-segment elevation (MDS). 2011-2019
| Heart failure | 2011 | 2012 | 2013 | 2014 | 2015 | 2016b | 2017 | 2018 | 2019 | IRR | P |
| Admissions/10 000 inhab./ya | 30.11 | 30.68 | 30.11 | 30.50 | 31.34 | 28.43 | 28.69 | 29.39 | 28.81 | .991 | <.001 |
| Crude annual mortality rate | 10.30 | 10.40 | 10.02 | 9.94 | 10.69 | 10.46 | 10.79 | 11.16 | 11.27 | 1.013 | <.001 |
| Adjusted mortality | 10.02 | 10.04 | 9.70 | 9.60 | 10.35 | 10.02 | 10.38 | 10.75 | 10.84 | 1.012 | <.001 |
| Annual 30-day readmission rate | 9.58 | 10.03 | 11.64 | 11.75 | 10.95 | 12.38 | 12.50 | 12.34 | 11.78 | 1.027 | .001 |
| Adjusted readmission rate | 9.72 | 10.27 | 11.90 | 12.05 | 11.23 | 12.75 | 12.87 | 12.64 | 12.08 | 1.028 | .001 |
| Median hospital stay, d | 7 | 7 | 7 | 7 | 7 | 7 | 7 | 7 | 7 | 1.000 | >.999 |
| STEMI, ST-elevation myocardial infarction | 2011 | 2012 | 2013 | 2014 | 2015 | 2016c | 2017 | 2018 | 2019 | IRR | P |
| Admissions/10 000 inhab./ya | 7.7 | 7.57 | 7.53 | 7.13 | 7.01 | 6.38 | 6.49 | 6.48 | 6.46 | .974 | <.001 |
| Crude annual mortality rate | 10.84 | 10.18 | 9.84 | 9.95 | 9.75 | 9.73 | 9.20 | 8.78 | 8.79 | .976 | <.001 |
| Adjusted mortality | 10.24 | 9.54 | 9.22 | 9.29 | 9.12 | 9.00 | 8.39 | 8.07 | 8.06 | .972 | <.001 |
| Annual 30-day readmission rate | 5.59 | 5.64 | 6.20 | 5.93 | 5.41 | 6.00 | 5.49 | 5.75 | 5.35 | .994 | .295 |
| Adjusted readmission rate | 5.21 | 5.25 | 5.78 | 5.53 | 4.98 | 5.51 | 5.08 | 5.27 | 4.91 | .992 | .146 |
| Median hospital stay, d | 6 | 6 | 6 | 6 | 6 | 5 | 5 | 5 | 5 | .970 | <.001 |
| NSTEMI, non–ST-segment elevation myocardial infarction | 2011 | 2012 | 2013 | 2014 | 2015 | 2016d | 2017 | 2018 | 2019 | IRR | P |
| Admissions/10 000 inhab./ya | 4.87 | 4.94 | 4.91 | 4.81 | 4.91 | 4.95 | 5.21 | 5.38 | 5.64 | 1.017 | <.001 |
| Crude annual mortality rate | 5.83 | 5.78 | 5.70 | 5.33 | 5.83 | 5.17 | 5.45 | 5.76 | 5.13 | .989 | .026 |
| Adjusted mortality | 5.86 | 5.70 | 5.59 | 5.35 | 5.91 | 5.20 | 5.55 | 5.87 | 5.21 | .993 | .187 |
| Annual 30-day readmission rate | 6.24 | 7.18 | 7.31 | 7.49 | 6.80 | 6.88 | 6.51 | 6.91 | 6.44 | .995 | .552 |
| Adjusted readmission rate | 6.11 | 7.08 | 7.23 | 7.30 | 6.65 | 6.74 | 6.39 | 6.80 | 6.32 | .994 | .552 |
| Median hospital stay, d | 7.00 | 7.00 | 7.00 | 6.00 | 6.00 | 6.00 | 6.00 | 6.00 | 6.00 | .977 | <.001 |
Adjusted for age and sex. Concatenated episodes. Hospital admissions did not include stays of 1 day or less with discharge to home or to a care facility.
The coding method was switched in 2016 (Joinpoint P = .013), with the trend differing for the 2 periods: decreasing and significant for 2011-2015 (IRR = 0.976; P <.001) and insignificant in 2016-2019 (IRR = 1.004; P <.193
The coding method was switched in 2016 (Joinpoint P = .153), but the trend was insignificant for 2011-2016 (IRR = 0.999; P = .713) and upward in the second period (IRR = 1.043; P <.001).
IRR, incidence rate ratio (Poisson regression).
Data are expressed as No. (%) or median.
P values <.05 indicate statistically significant differences.
. STEMI, ST-segment elevation myocardial infarction; NSTEMI, non–ST-segment elevation myocardial infarction; HF, heart failure. aP = .001. bP = .076. cP <.001.")
. HF, heart failure; NSTEMI, non–ST-segment elevation myocardial infarction; STEMI, ST-segment elevation myocardial infarction. aP <.001. bP = .03. cP = .02.")
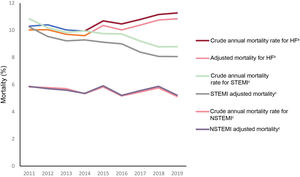
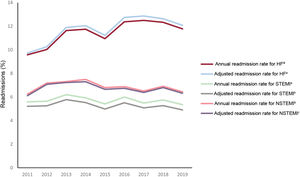
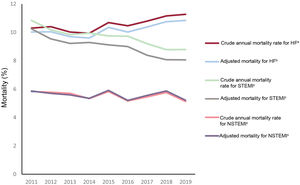
The trend in hospital care for HF (figure 2 and figure 3) was fairly stable (≈30 hospital admissions per 10 000 inhabitants and year, adjusted for age and sex). The adjusted mortality rate (10%-10.8%) increased significantly in recent years. The 30-day readmission rate increased considerably (2.7% year-over-year; P <.001), whereas the median stay for admissions for this reason was unchanged.
Hospital care indicators for STEMI (figure 2 and figure 3) showed a statistically significant favorable trend, with a large decline in absolute mortality and adjusted mortality. Both the readmission rate and the mean length of stay have gradually dropped.
The trend for NSTEMI care (figure 2 and figure 3) was rather stable in terms of usage rates. However, mortality, readmission rate, and mean stay showed a favorable trend, with some decrease, although this drop was less important than that observed in STEMI and the trend of the changes was not statistically significant, except for the crude mortality rate and hospital stay.
Because risk adjustment was not possible for the respective populations, the indicators could not be compared with results obtained for the 3 processes with results published in other countries. Table 4 includes a comparison of the 3 process indicators obtained in RECALCAR with those proposed by INCARDIO.20
Comparison of RECALCAR indicator results for 2019 with those proposed by INCARDIO20
| Recalcar | Incardio | Remarks | ||
|---|---|---|---|---|
| Indicator | Definition | |||
| Heart failure | ||||
| Crude mortality rate | 11.27 | <7 | The INCARDIO indicator applies to cardiology departments, while the RECALCAR indicator is overall for the hospital | |
| Adjusted mortality | 10.84 | |||
| Annual 30-day readmission rate | 11.78 | |||
| Adjusted readmission rate | 12.08 | |||
| Hospital stay | 7 | <7 | ||
| STEMI | ||||
| Crude mortality rate | 8.79 | <5 | Excludes patients in Killip IV and patients who received cardiopulmonary resuscitation | |
| Adjusted mortality | 8.06 | The RECALCAR indicator applies to all STEMIs, adjusting for risk | ||
| Annual 30-day readmission rate | 5.35 | |||
| Adjusted readmission rate | 4.91 | |||
| Hospital stay | 5 | <10 | ||
| NSTEMI | ||||
| Crude mortality rate | 5.13 | <3 | Excludes patients in Killip IV and patients who received cardiopulmonary resuscitation | |
| Adjusted mortality | 5.21 | The RECALCAR indicator applies to all NSTEMIs, adjusting for risk | ||
| Annual 30-day readmission rate | 6.44 | |||
| Adjusted readmission rate | 6.32 | |||
| Hospital stay | 6.00 | <10 | ||
NSTEMI, non–ST-segment elevation myocardial infarction; STEMI, ST-segment elevation myocardial infarction.
Data are expressed as No. (%) or median (days).
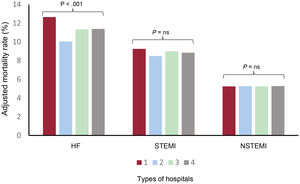
Table 5 describes the results between the various types of units and cardiology departments for cardiovascular diseases as a whole and in relation to the 3 health care processes mentioned; type 5 hospitals are not included (figure 4). The differences between hospitals were significant when analyzing total admissions, adjusted mortality, and readmission rate for all cardiovascular conditions. However, the individual analysis showed that HF mortality was significantly higher in less complex hospitals, with no significant differences in adjusted mortality between the various types of hospital in relation to STEMI and NSTEMI.
Comparisons of health care outcomes for the main cardiovascular conditions (heart failure and ST- and non–ST-segment elevation myocardial infarction) between the various types of cardiology departments and units
| Types of departments/units | |||||
|---|---|---|---|---|---|
| Type 1 | Type 2 | Type 3 | Type 4 | P | |
| All cardiovascular conditions | |||||
| Hospitals | 125 | 30 | 40 | 44 | |
| Discharges | 497±321 | 1297±343 | 1985±548 | 3133±790 | <.001 |
| Median hospital stay, d | 6.1±1.3 | 5.6±0.9 | 5.5±1.2 | 5.6±1.1 | .003 |
| Crude mortality rate | 9.7±3.9 | 6.4±2 | 6.9±1.9 | 6±1 | <.001 |
| Adjusted mortality rate | 7.5±2.3 | 5.8±1.6 | 6.7±1.5 | 6.9±1.3 | <.001 |
| Readmission rate | 8.7±2.8 | 8.5±1.8 | 6.8±1.7 | 6.2±1.6 | <.001 |
| Heart failurea | |||||
| Hospitals | 108 | 30 | 40 | 44 | |
| Discharges | 249±134 | 536±191 | 663±223 | 889±343 | <.001 |
| Median hospital stay, d | 7±1.2 | 6.9±1.3 | 7.1±1.3 | 7.3±1.3 | .592 |
| Crude mortality rate | 13.7±5.1 | 10.1±3.4 | 11.5±3.6 | 10.9±2.6 | <.001 |
| Adjusted mortality rate | 12.7±3.7 | 10.0±3.1 | 11.3±2.9 | 11.4±3.1 | .001 |
| Readmission rate | 11.4±3.5 | 11.8±2.9 | 10.8±2.4 | 10.8±2.3 | .369 |
| STEMIb | |||||
| Hospitals | 23 | 22 | 39 | 44 | |
| Discharges | 53±25 | 64±27 | 193±86 | 294±83 | <.001 |
| Median hospital stay, d | 5.6±0.9 | 5.3±1.1 | 5.5±1.3 | 5.4±1 | .841 |
| Crude mortality rate | 13.2±9.3 | 8.9±4.2 | 9±3.1 | 8.5±2.8 | .002 |
| Adjusted mortality rate | 9.3±1.7 | 8.5±1.0 | 9.0±1.3 | 8.8±1.8 | .367 |
| Readmission rate | 7.5±4.6 | 7.8±4.8 | 5.1±2.6 | 4.6±1.8 | <.001 |
| NSTEMIb | |||||
| Hospitals | 54 | 30 | 40 | 44 | |
| Discharges | 61±27 | 87±38 | 152±52 | 185±74 | <.001 |
| Median hospital stay, d | 6.6±1.4 | 5.9±1.2 | 6±1.4 | 5.7±1.5 | .025 |
| Crude mortality rate | 5.6±4.2 | 5.6±2.9 | 5.4±3.1 | 4.8±2.2 | .655 |
| Adjusted mortality rate | 5.2±0.6 | 5.3±0.7 | 5.2±0.7 | 5.3±0.8 | .994 |
| Readmission rate | 6.4±3.7 | 7.6±4 | 6.4±2.6 | 5.5±2.4 | .058 |
HD, heart disease; HF, heart failure; NSTEMI, non–ST-segment elevation myocardial infarction; STEMI, ST-segment elevation myocardial infarction.
To calculate HF indicators, facilities with fewer than 100 discharges per year were excluded; for transfers between hospitals, the outcome of the episode was assigned to the facility first contacted by the patient.
To calculate myocardial infarction indicators, facilities with fewer than 25 discharges per year were excluded; in the case of transfers between hospitals, the outcome was assigned to the most complex hospital.
Type 1: no beds assigned to cardiology department/unit; Type 2: beds assigned to the cardiology department/unit, but no catheterization lab; Type 3: beds assigned to the cardiology department/unit, catheterization lab, but no cardiac surgery department; Type 4: beds assigned to the cardiology department/unit, catheterization lab, and cardiac surgery.
Except for the number of hospitals and the hospital stay (median), all data are expressed as mean±standard deviation.
P values <.05 indicate statistically significant differences.
 between the various types of cardiology units and department for HF, STEMI, and NSTEMI. Type 1: no hospital beds assigned to cardiology. Type 2: hospital beds for cardiology, but no catheterization lab. Type 3: hospital beds for cardiology and catheterization lab, but no cardiovascular surgery department. Type 4: hospital beds assigned to cardiology, catheterization lab, and cardiovascular surgery department. HF, heart failure; NS, nonsignificant; NSTEMI, non–ST-segment elevation myocardial infarction; STEMI, ST-segment elevation myocardial infarction.")
Adjusted mortality rates (%) between the various types of cardiology units and department for HF, STEMI, and NSTEMI. Type 1: no hospital beds assigned to cardiology. Type 2: hospital beds for cardiology, but no catheterization lab. Type 3: hospital beds for cardiology and catheterization lab, but no cardiovascular surgery department. Type 4: hospital beds assigned to cardiology, catheterization lab, and cardiovascular surgery department. HF, heart failure; NS, nonsignificant; NSTEMI, non–ST-segment elevation myocardial infarction; STEMI, ST-segment elevation myocardial infarction.
One of the main objectives of the RECALCAR project is to obtain further information on the epidemiology of cardiologic diseases, as well as to identify any associations between cardiovascular care organization/activity and health outcomes. A strong point of this project is that it reports on a yearly survey with updated data on the health care structures of cardiology units and departments, then analyzes them together with a large database of inpatient cardiovascular events in the Spanish NHS. Furthermore, RECALCAR allows assessment of trends and progress in the most common cardiovascular care processes, which may facilitate improvements in health care and decision-making related to health policy.
RECALCAR survey resultsAround 77% to 80% of cardiology units and departments in Spain provided information on their current situation with regard to human resources, technological equipment, and productivity. The universe of survey responses indicated adequate representativeness.
Although activity increased, there was no increase in the number of cardiologists per population attended. The number of hospital beds and the length of hospital stay cecreased, in keeping with the downward trend of recent years and possibly indicating a trend toward greater use of outpatient services for cardiological processes and procedures. Most notably, more units were specifically created for HF and cardiac rehabilitation in a large number of hospitals.
Regarding activity levels, usage rates were noticeably higher in the case of echocardiography, magnetic resonance imaging, and computed tomography scans, while the number of stress tests was significantly reduced. Likewise, cardiac catheterization and electrophysiology labs showed a large increase in the number of procedures, with a marked increase in the rate of percutaneous aortic valve implantation.
Productivity, expressed as the number of procedures per echograph, per catheterization lab, or per electrophysiology lab, remained stable. A highly relevant aspect is that 82% of current cardiology units and departments are members of a health care network, probably because they belong to STEMI treatment networks, which already cover all autonomous communities. These figures showed a large upward trend, as only 14% to 17% of cardiology units and departments responded to this question affirmatively for the period of 2011 to 2014.6
In terms of training, research, and teaching, 60% of cardiology units and departments responding to the survey were accredited for residency training. A significant percentage (35%) belonged to a research network, and practically half the units were involved in competitive research projects.
Table 2 lists the average annual data on resources, activity, and productivity levels for 2018 and 2019, reflecting the current status in terms of structure and staff, hospitalization data, and cardiovascular health care activity in Spanish hospitals. Additionally, cardiology units and departments with no formal cardiology department provide important information on cardiologic activity in hospitals with smaller populations, which are often excluded from registries and research projects.
Although the data from the past 2 years (2019 and 2020) were affected by the COVID-19 pandemic (2019 data were collected in the first few months of 2020, the period most impacted by the pandemic), health care coverage at the hospitals completing the survey still accounted for more than 75% of the total population covered by the Spanish NHS.
Data obtained from the analysis of the cardiology minimum data setsAlthough the total number of admissions due to HF was stable during the long study period, inpatient mortality due to this cause was not lower and 30-day readmissions were higher. The limited progress seen in these 2 markers and the expected aging of the Spanish population mean that addressing HF is probably one of the main health care issues at present. The HF process depends less on cardiology departments and is much more influenced by a multidisciplinary joint clinical approach (primary care, specialized care—usually by internal medicine—, and emergency departments). The higher level of HF mortality at less complex facilities (table 5) was reported by another Spanish study21 and has been attributed to a higher volume of activity and to the existence of more structured HF units in more complex cardiology departments.
Conversely, the trend seen in hospital care indicators for STEMI from 2011 to 2019 showed a large, progressive improvement in both mortality (figure 5) and readmissions. These data reflect organizational improvements made in recent years in the clinical approach taken with these patients by implementing health care networks for infarction (Infarction Codes) and the increased number of primary angioplasties.6
. Data from the RECALCAR project minimum data set. HF, heart failure; NSTEMI, non–ST-segment elevation myocardial infarction; STEMI, ST-segment elevation myocardial infarction. aP = .001. bP = .076. cP <.001.")
Central illustration. Trend of adjusted and nonadjusted mortality rates for HF, STEMI, and NSTEMI (2011-2019). Data from the RECALCAR project minimum data set. HF, heart failure; NSTEMI, non–ST-segment elevation myocardial infarction; STEMI, ST-segment elevation myocardial infarction.
aP = .001.
bP = .076.
cP <.001.
The favorable trend seen with NSTEMI mortality, although not as important in terms of absolute values as in STEMI, possibly also resulted from more organized coordination between hospitals. Unlike what was observed for HF, mortality in STEMI and NSTEMI processes did not differ between hospitals. These findings may be explained by the fact that health care networks among hospitals have been strengthened in terms of the treatment of patients with acute coronary syndromes.
The various indicators of the 3 processes refer to the total number of episodes attended in hospitals and not strictly in cardiology units and departments. These units unquestionably influence the overall care provided in these health care processes, regardless of whether they are inpatients or discharged from cardiology units and departments or from other hospital departments. This comprehensive approach is the most suitable method for comparing health outcomes, given the variety seen in the organization and approach of hospitals toward cardiovascular diseases (HF patients admitted to internal medicine departments, critical cardiologic care managed by general intensive care units, availability or lack of availability of cardiac intensive care units,22 etc.).
Study limitationsThe main limitation of the data obtained in the RECALCAR survey is that completion was voluntary, thus not covering the entire universe of cardiology units and departments. However, a response rate of ≈70% of the universe, ≈75% of the catchment population for the hospitals, and ≈80% of the installed beds at facilities with cardiology units and departments responding to the survey ensures good representativeness.
Data extraction from the MDS_CAR has several limitations. The complete database (with all discharge events) is not available, the overall 30-day mortality cannot be calculated, and readmissions can only be calculated when due to cardiovascular causes. Furthermore, the MDS has its own limitations, even though the use of administrative registries to evaluate the results of health services was validated by comparing with clinical registry data. Changes to the MDS structure in 2016 and to the coding system (switched to ICD-10) has led to problems, but also allowed more accurate differentiation between comorbidities and complications of secondary diagnoses.
Despite these limitations, the MDS is a highly useful tool for analyzing health outcomes and inequalities between facilities or territories that can be detected with real-life data. As a data source for analysis, it has disadvantages compared with clinical records, but some of its biases are offset as it covers a very large population, with a less narrow selection of facilities and settings.
CONCLUSIONSThe information provided by RECALCAR is an important source for improving cardiovascular health care and should be useful for facilitating decision-making in health policy. Differences detected between cardiology units and departments in structure, activity, and health outcomes will encourage further research and identify areas for improvement in cardiovascular health care quality and in the productivity of cardiology units and departments. Measuring health outcomes remains to be addressed in the Spanish health care system. In undertaking the RECALCAR project, the SEC has drawn attention to this shortcoming, which continues to weaken our health system, and underscores the valuable contribution provided by this information.
FUNDINGThe RECALCAR project is logistically supported by the SEC and is partially funded by an unrestricted grant from Menarini.
AUTHORS’ CONTRIBUTIONSAll authors made key contributions to the idea and final text of this article and approved the final manuscript. Idea and design: Á. Cequier, C. Macaya, V. Bertomeu, J.R. González-Juanatey, A. Iñiguez, M. Anguita, N. del Prado, L. Rodríguez-Padial, J. Pérez-Villacastín, J.L. Bernal, C. Fernández-Pérez, J. Elola. Data collection, analysis, and interpretation: Á. Cequier, H. Bueno, C. Macaya, A. Iñiguez, M. Anguita, I. Cruz, D. Calvo, J.J. Gómez-Doblas, J.M. de la Torre Hernández, N. del Prado, J. Pérez-Villacastín, J.L. Bernal, C. Fernández-Pérez, J. Elola. Original text: Á. Cequier, C. Macaya, V. Bertomeu, J.R. González-Juanatey, A. Iñiguez, M. Anguita, I. Cruz, D. Calvo, J.J. Gómez-Doblas, J.M. de la Torre Hernández, L. Rodríguez-Padial, J. Pérez-Villacastín, J.L. Bernal, C. Fernández-Pérez, J. Elola. Critical review of intellectual content: Á. Cequier, H. Bueno, C. Macaya, V. Bertomeu, J.R. González-Juanatey, A. Íñiguez, M. Anguita, J. Pérez-Villacastín, J. Elola. Corresponding author: Á. Cequier.
CONFLICTS OF INTERESTThere are no conflicts of interests in relation to this study.
- –
Evidence on health outcomes can only be obtained by homogenizing and standardizing the information.
- –
For more than a decade, the SEC has been preparing clinical standards and developing a policy of collaboration with public agencies to promote continuous improvement in cardiovascular care quality.
- –
The RECALCAR project uses a yearly survey to evaluate the resources and activity of cardiology departments in Spain and their relationship with the analysis of the Ministry of Health's MDS.
- –
The past decade has seen a decrease in Spain in the number of hospital beds and a considerable increase in cardiac imaging studies and percutaneous therapeutic procedures.
- –
Admissions for HF tended to drop, although mortality and readmissions for this condition increased.
- –
The trend of mortality and readmissions was highly favorable in STEMI, and less important in NSTEMI.
- –
The RECALCAR project is a key resource for future improvements and decision-making in health policy.
This project was possible thanks to the heads of the cardiology units and departments participating in the RECALCAR project and to the Ministry of Health for providing us with the MDS-CAR database. Laura Pérez and Raquel Castro from the SEC have also provided invaluable assistance to the study.
Supplementary data associated with this article can be found in the online version, at https://doi.org/10.1016/j.rec.2022.09.017