The prevalences of child obesity and overweight are increasing worldwide and are a significant public health issue, particularly in terms of long-term cardiovascular risk profiles, which continue into adulthood unless obesity is reversed. Accurately identifying trends and at-risk subgroups is crucial to correctly target public health initiatives. The objective of this study was to examine changes in the prevalences of child obesity and underweight in Spain from 1983 to 2011 taking into consideration both age and birth year.
MethodsA series of cross-sectional studies representative of the pediatric population in Spain between 1987 and 2011 was used to calculate the prevalence and trends of excess weight and underweight in girls and boys aged 2 to 14 years per survey year and per birth year.
ResultsThe overall prevalence of overweight and obesity remained relatively stable. The prevalence of overweight in boys aged 10 to 14 years increased from 13.9% to 22.2%. The prevalence of obesity in girls aged 2 to 5 years decreased from 30% to 19.8%, whereas the prevalence of underweight in this group increased from 13.7% to 22.6%.
ConclusionsChild obesity trends in Spain over the last 2 decades appear to be stable with some fluctuations, but the trends differ depending on age and sex, and have stabilized at too high a level. The prevalence of underweight also appears to have increased and should be considered alongside excess weight when designing and implementing child health and weight measures.
Keywords
The increasing prevalence of child overweight and obesity in European countries has been reported to have reached epidemic proportions and has emerged as a significant public health issue.1,2 In many countries, childhood obesity is leveling off, but the prevalence in Spain continues to be on the rise and is among the highest in Europe.3,4
The consequences of child obesity are both immediate and long-term, because risk profiles carry into later life and are a known predictor of adult obesity.5 Adult obesity is a known cardiovascular risk factor with cardiovascular diseases being one of the primary causes of hospitalization and mortality in Spain.6,7 Obesity in childhood and adolescence has also been shown to be associated with prediabetes and cardiovascular risk profiles8 and a recent article found that both overweight and obesity during adolescence were strongly associated with cardiovascular outcomes and mortality in middle age.9 Therefore, the early years of life are an important time for prevention of excess weight and its consequences and for research into this topic. More importance needs to be placed on primary prevention with focus on modifiable risk factors, extending primary intervention into childhood and adolescence.
The prevalence of obesity in Spain is considerably lower during adolescence than during childhood.7 Differences in the prevalence of obesity among children and adolescents have also been observed in other countries.10–13 Consequently, overweight in childhood may not necessarily translate into overweight in adolescence.12 There are a number of factors to be considered: an age effect, period effect and/or cohort effect with possible differences in the incidence and persistence of overweight or obesity during childhood and adolescence.14 Cohort effects and period effects have already been shown to be associated with the prevalence of obesity in adulthood, suggesting that early life exposures affect later susceptibility.15,16 However, little research has been done on cohort or birth year effects in childhood.
Population interventions have focused on reducing the prevalence of excess weight but we need to ensure that these strategies are not increasing the burden of underweight. Population strategies promoting weight loss without taking into consideration an individual's body mass index (BMI) may negatively affect those with borderline normal weight. Studies have also suggested that children with a low BMI who develop obesity in adulthood are at particular risk of metabolic syndrome.17 There is little literature on prevalence and trends in underweight children in Europe and even less that analyze them alongside those of obesity.18 There is a need to monitor and investigate the prevalence of underweight and its associated trends alongside those of excess weight.
In this study, we investigate underweight, overweight, and obesity trends in 2- to 14-year-olds in Spain during the last 3 decades, considering both age and birth cohort year.
METHODSStudy Design and PopulationThis study used data collected by the Spanish Ministry of Health and National Institute of Statistics in a series of cross-sectional National Health Surveys in 1987, 1993, 1995, 1997, 2001, 2003/2004, 2006/2007, and 2011.19 Data were collected in a multistage stratified random sample, with strata based on municipality size to ensure representativeness. Our population sample was restricted to children and adolescents aged 2 to 14 years inclusive. We excluded persons with missing data on age, sex, or anthropological characteristics, as well as individuals with extreme BMIs (> 40 or < 10). Ceuta and Melilla were also excluded. After the exclusion criteria were applied, the sample size was 4417 in 1987, 2730 in 1993, 1040 in 1995, 1111 in 1997, 2956 in 2001, 4808 in 2003/2004, 5356 in 2006/2007, and 3642 in 2011.
VariablesParental education level was used as a proxy for socioeconomic status (SES). This was obtained from the highest education level achieved by the head of the household, who was defined as the member of the household with the highest income. In 2011 this information was not available and was approximated using the highest education level achieved by either a parent or legal guardian. During 1997 and 2001, if the head of the household was the person completing the child's questionnaire, no information on level of education was available, resulting in systematic loss of data. The education level categories used were: a) illiterate/primary education, and b) secondary/university education.
Data on BMI were derived from parent/caregiver-reported height and weight of the child in cm and kg. BMI by sex and age was categorized as per the latest International Obesity Task Force definitions for BMI centile cutoffs for persons aged less than 18 years20: The centiles for underweight, overweight, and obesity were 15.5, 90.5, and 98.9, respectively, for boys and were 16.5, 89.3, and 98.6, respectively, for girls. Age in months is usually used to calculate age-specific BMI, but as the National Health Survey reports ages in years, all children were assumed to be at the midpoint of their age-year for this calculation.
Statistical AnalysisPrevalences and their 95% confidence intervals were calculated for each weight status category by both survey year and birth year categories. Analyses were stratified by age, sex, and SES. Due to the combined nature of our analyses and the need for standardization of weighting for each survey year, data were weighted using the principles of proportionality for the subgroups of age, sex, and autonomous community and by using population data from the Spanish Statistical Office corresponding to each survey year.21,22 Analyses were performed using the statistical package SPSS, version 20.
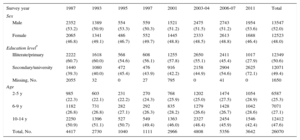
RESULTSThe unweighted general characteristics of the sample population for each survey year from 1987 to 2011 are shown in Table 1. The total survey population consisted of approximately 52% boys, 25% aged between 2 and 5 years, 27% aged between 6 and 9 years, and 48% aged 10 to 14 years. Of the total sample, approximately 51% had a maximum SES of primary education, but there appeared to be a change during the last 2 decades in the educational levels of the head of the household with a higher percentage with at least secondary education in more recent years. Missing SES data predominantly came from the early survey years.
Unweighted Survey Population Characteristics
| Survey year | 1987 | 1993 | 1995 | 1997 | 2001 | 2003-04 | 2006-07 | 2011 | Total |
|---|---|---|---|---|---|---|---|---|---|
| Sex | |||||||||
| Male | 2352 (53.2) | 1389 (50.9) | 554 (53.3) | 559 (50.3) | 1521 (51.2) | 2475 (51.5) | 2743 (51.2) | 1954 (53.6) | 13547 (52.0) |
| Female | 2065 (46.8) | 1341 (49.1) | 486 (46.7) | 552 (49.7) | 1445 (48.8) | 2333 (48.5) | 2613 (48.8) | 1688 (46.4) | 12523 (48.0) |
| Education level* | |||||||||
| Illiterate/primary | 2222 (60.7) | 1618 (60.0) | 568 (54.6) | 608 (56.1) | 1255 (57.8) | 2650 (55.1) | 2411 (45.4) | 1017 (27.9) | 12349 (50.6) |
| Secondary/university | 1440 (39.3) | 1080 (40.0) | 472 (45.4) | 476 (43.9) | 916 (42.2) | 2158 (44.9) | 2904 (54.6) | 2625 (72.1) | 12071 (49.4) |
| Missing, No. | 2055 | 32 | 0 | 27 | 795 | 0 | 41 | 0 | 1650 |
| Age | |||||||||
| 2-5 y | 985 (22.3) | 603 (22.1) | 231 (22.2) | 270 (24.3) | 768 (25.9) | 1202 (25.0) | 1474 (27.5) | 1054 (28.9) | 6587 (25.3) |
| 6-9 y | 1182 (26.8) | 731 (26.8) | 282 (27.1) | 292 (26.3) | 835 (28.2) | 1279 (26.6) | 1428 (26.7) | 1042 (28.6) | 7071 (27.1) |
| 10-14 y | 2250 (50.9) | 1396 (51.1) | 527 (50.7) | 549 (49.4) | 1363 (46.0) | 2327 (48.4) | 2454 (45.9) | 1546 (42.4) | 12412 (47.6) |
| Total, No. | 4417 | 2730 | 1040 | 1111 | 2966 | 4808 | 5356 | 3642 | 26070 |
Values are expressed as No. (%).
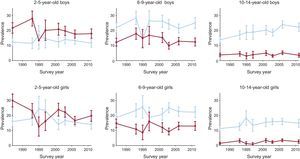
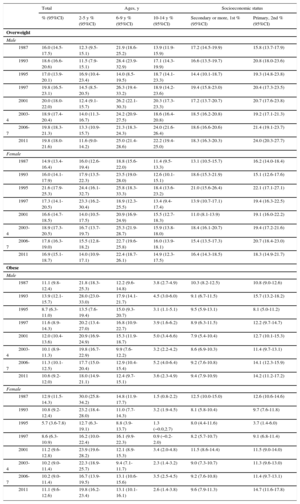
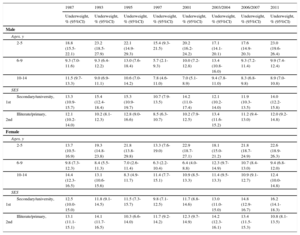
The trends in the prevalence of overweight and obesity per survey year, from 1987 to 2011, stratified by age, sex, and SES are shown in Table 2. During this period, the prevalence of overweight in boys aged 10 to 14 years increased from 13.9% to 22.2%, whereas the prevalence of obesity stayed relatively steady at around 3.6% to 3.8%. For boys aged 6 to 9 years, the prevalence of overweight rose from 21.9% to 25%, with the prevalence of obesity remaining steady at around 12.2% to 12.4% with some fluctuations in between. The prevalence of overweight and obesity remained similar for boys aged 2 to 5 years with some fluctuations during this period (12.3-11.6 and 21.8-18.0, respectively). Similar patterns were seen among girls. During this period, the prevalence of overweight in girls aged 10 to 14 years rose from 11.4% to 14.9% and for obesity, from 1.5% to 2.6% with numerous fluctuations in between. In the group aged 6 to 9 years, the prevalence of overweight rose from 18.8% to 22.4% and that of obesity decreased from 14.8% to 13.1%. In the youngest group of girls, aged 2 to 5 years, the prevalence of overweight remained relatively steady from16.0% in 1987 to 14.0% in 2011, whereas the prevalence of obesity decreased during this period from 30% to 19.8%. Trends by survey year are depicted graphically in Figure 1.
Prevalence of Overweight and Obesity in Children Aged 2 to 14 Years by Age, Sex, and Socioeconomic Status From 1987 to 2011 (IOTF Criteria)
| Total | Ages, y | Socioeconomic status | ||||
|---|---|---|---|---|---|---|
| % (95%CI) | 2-5 y % (95%CI) | 6-9 y % (95%CI) | 10-14 y % (95%CI) | Secondary or more, 1st % (95%CI) | Primary, 2nd % (95%CI) | |
| Overweight | ||||||
| Male | ||||||
| 1987 | 16.0 (14.5-17.5) | 12.3 (9.5-15.1) | 21.9 (18.6-25.2) | 13.9 (11.9-15.9) | 17.2 (14.5-19.9) | 15.8 (13.7-17.9) |
| 1993 | 18.6 (16.6-20.6) | 11.5 (7.9-15.1) | 28.4 (23.9-32.9) | 17.1 (14.3-19.9) | 16.6 (13.5-19.7) | 20.8 (18.0-23.6) |
| 1995 | 17.0 (13.9-20.1) | 16.9 (10.4-23.4) | 14.0 (8.5-19.5) | 18.7 (14.1-23.3) | 14.4 (10.1-18.7) | 19.3 (14.8-23.8) |
| 1997 | 19.8 (16.5-23.1) | 14.5 (8.5-20.5) | 26.3 (19.4-33.2) | 18.9 (14.2-23.6) | 19.4 (15.8-23.0) | 20.4 (17.3-23.5) |
| 2001 | 20.0 (18.0-22.0) | 12.4 (9.1-15.7) | 26.2 (22.1-30.3) | 20.3 (17.3-23.3) | 17.2 (13.7-20.7) | 20.7 (17.6-23.8) |
| 2003-4 | 18.9 (17.4-20.4) | 14.0 (11.3-16.7) | 24.2 (20.9-27.5) | 18.6 (16.4-20.8) | 18.5 (16.2-20.8) | 19.2 (17.1-21.3) |
| 2006-7 | 19.8 (18.3-21.3) | 13.3 (10.9-15.7) | 21.3 (18.3-24.3) | 24.0 (21.6-26.4) | 18.6 (16.6-20.6) | 21.4 (19.1-23.7) |
| 2011 | 19.8 (18.0-21.6) | 11.6 (9.0-14.2) | 25.0 (21.4-28.6) | 22.2 (19.4-25.0) | 18.3 (16.3-20.3) | 24.0 (20.3-27.7) |
| Female | ||||||
| 1987 | 14.9 (13.4-16.4) | 16.0 (12.6-19.4) | 18.8 (15.6-22.0) | 11.4 (9.5-13.3) | 13.1 (10.5-15.7) | 16.2 (14.0-18.4) |
| 1993 | 16.0 (14.1-17.9) | 17.9 (13.5-22.3) | 23.5 (19.0-28.0) | 12.6 (10.1-15.1) | 18.6 (15.3-21.9) | 15.1 (12.6-17.6) |
| 1995 | 21.6 (17.9-25.3) | 24.4 (16.1-32.7) | 25.8 (18.3-33.3) | 18.4 (13.6-23.2) | 21.0 (15.6-26.4) | 22.1 (17.1-27.1) |
| 1997 | 17.3 (14.1-20.5) | 23.3 (16.2-30.4) | 18.9 (12.3-25.5) | 13.4 (9.4-17.4) | 13.9 (10.7-17.1) | 19.4 (16.3-22.5) |
| 2001 | 16.6 (14.7-18.5) | 14.0 (10.5-17.5) | 20.9 (16.9-24.9) | 15.5 (12.7-18.3) | 11.0 (8.1-13.9) | 19.1 (16.0-22.2) |
| 2003-4 | 18.9 (17.3-20.5) | 16.7 (13.7-19.7) | 25.3 (21.9-28.7) | 15.9 (13.8-18.0) | 18.4 (16.1-20.7) | 19.4 (17.2-21.6) |
| 2006-7 | 17.8 (16.3-19.0) | 15.5 (12.8-18.2) | 22.7 (19.6-25.8) | 16.0 (13.9-18.1) | 15.4 (13.5-17.3) | 20.7 (18.4-23.0) |
| 2011 | 16.9 (15.1-18.7) | 14.0 (10.9-17.1) | 22.4 (18.7-26.1) | 14.9 (12.3-17.5) | 16.4 (14.3-18.5) | 18.3 (14.9-21.7) |
| Obese | ||||||
| Male | ||||||
| 1987 | 11.1 (9.8-12.4) | 21.8 (18.3-25.3) | 12.2 (9.6-14.8) | 3.8 (2.7-4.9) | 10.3 (8.2-12.5) | 10.8 (9.0-12.6) |
| 1993 | 13.9 (12.1-15.7) | 28.0 (23.0-33.0) | 17.9 (14.1-21.7) | 4.5 (3.0-6.0) | 9.1 (6.7-11.5) | 15.7 (13.2-18.2) |
| 1995 | 8.7 (6.3-11.0) | 13.5 (7.6-19.4) | 15.0 (9.3-20.7) | 3.1 (1.1-5.1) | 9.5 (5.9-13.1) | 8.1 (5.0-11.2) |
| 1997 | 11.6 (8.9-14.3) | 20.2 (13.4-27.0) | 16.8 (10.9-22.7) | 3.9 (1.6-6.2) | 8.9 (6.3-11.5) | 12.2 (9.7-14.7) |
| 2001 | 12.0 (10.4-13.6) | 20.9 (16.9-24.9) | 15.3 (11.9-18.7) | 5.0 (3.4-6.6) | 7.9 (5.4-10.4) | 12.7 (10.1-15.3) |
| 2003-4 | 10.1 (8.9-11.3) | 19.8 (16.7-22.9) | 9.9 (7.6-12.2) | 3.2 (2.2-4.2) | 8.6 (6.9-10.3) | 11.4 (9.7-13.1) |
| 2006-7 | 11.3 (10.1-12.5) | 17.7 (15.0-20.4) | 12.9 (10.4-15.4) | 5.2 (4.0-6.4) | 9.2 (7.6-10.8) | 14.1 (12.3-15.9) |
| 2011 | 10.6 (9.2-12.0) | 18.0 (14.9-21.1) | 12.4 (9.7-15.1) | 3.6 (2.3-4.9) | 9.4 (7.9-10.9) | 14.2 (11.2-17.2) |
| Female | ||||||
| 1987 | 12.9 (11.5-14.3) | 30.0 (25.8-34.2) | 14.8 (11.9-17.7) | 1.5 (0.8-2.2) | 12.5 (10.0-15.0) | 12.6 (10.6-14.6) |
| 1993 | 10.8 (9.2-12.4) | 23.2 (18.4-28.0) | 11.0 (7.7-14.3) | 3.2 (1.9-4.5) | 8.1 (5.8-10.4) | 9.7 (7.6-11.8) |
| 1995 | 5.7 (3.6-7.8) | 12.7 (6.3-19.1) | 8.8 (3.9-13.7) | 1.3 (−0.0,2.7) | 8.0 (4.4-11.6) | 3.7 (1.4-6.0) |
| 1997 | 8.6 (6.3-10.9) | 16.2 (10.0-22.4) | 16.1 (9.9-22.3) | 0.9 (−0.2-2.0) | 8.2 (5.7-10.7) | 9.1 (6.8-11.4) |
| 2001 | 11.2 (9.6-12.8) | 23.9 (19.6-28.2) | 12.1 (8.9-15.3) | 3.4 (2.0-4.8) | 11.5 (8.6-14.4) | 11.5 (9.0-14.0) |
| 2003-4 | 10.2 (9.0-11.4) | 22.3 (18.9-25.7) | 9.4 (7.1-11.7) | 2.3 (1.4-3.2) | 9.0 (7.3-10.7) | 11.3 (9.6-13.0) |
| 2006-7 | 10.2 (9.0-11.4) | 16.7 (13.9-19.5) | 13.1 (10.6-15.6) | 3.5 (2.5-4.5) | 9.2 (7.6-10.8) | 11.4 (9.7-13.1) |
| 2011 | 11.1 (9.6-12.6) | 19.8 (16.2-23.4) | 13.1 (10.1-16.1) | 2.6 (1.4-3.8) | 9.6 (7.9-11.3) | 14.7 (11.6-17.8) |
95%CI, 95% confidence interval; IOTF, International Obesity Task Force.

The prevalence trends for underweight during the same time period are shown in Table 3. While SES did not seem to influence trends among boys, the prevalence of underweight in girls with a higher SES increased from 12.5% to 16.2% but was relatively stable in those with a lower SES with numerous fluctuations from 12.1% in 1987 to 10.8% in 2011. Despite these fluctuations, the prevalence of underweight appears to have increased in both girls and boys aged 2 to 5 years (18.8%-23.0% and 13.7% and 22.6%, respectively).
Prevalence of Underweight per Survey Year Stratified by Sex, Age and SES (IOTF Criteria)
| 1987 | 1993 | 1995 | 1997 | 2001 | 2003/2004 | 2006/2007 | 2011 | |
|---|---|---|---|---|---|---|---|---|
| Underweight, % (95%CI) | Underweight, % (95%CI) | Underweight, % (95%CI) | Underweight, % (95%CI) | Underweight, % (95%CI) | Underweight, % (95%CI) | Underweight, % (95%CI) | Underweight, % (95%CI) | |
| Male | ||||||||
| Ages, y | ||||||||
| 2-5 | 18.8 (15.5-22.1) | 23.2 (18.5-27.9) | 22.1 (14.9-29.3) | 15.4 (9.3-21.5) | 20.2 (16.2-24.2) | 17.1 (14.1-20.1) | 17.6 (14.9-20.3) | 23.0 (19.6-26.4) |
| 6-9 | 9.3 (7.0-11.6) | 9.3 (6.4-12.2) | 13.0 (7.6-18.4) | 5.7 (2.1-9.3) | 10.0 (7.2-12.8) | 13.4 (10.8-16.0) | 9.3 (7.2-11.4) | 9.9 (7.4-12.4) |
| 10-14 | 11.5 (9.7-13.3) | 9.0 (6.9-11.1) | 10.6 (7.0-14.2) | 7.8 (4.6-11.0) | 7.0 (5.1-8.9) | 9.4 (7.8-11.0) | 8.3 (6.8-9.8) | 8.9 (7.0-10.8) |
| SES | ||||||||
| Secondary/university, 1st | 13.3 (10.9-15.7) | 15.4 (12.4-18.4) | 15.3 (10.9-19.7) | 10.7 (7.9-13.5) | 14.2 (11.0-17.4) | 12.1 (10.2-14.0) | 11.9 (10.3-13.5) | 14.0 (12.2-15.8) |
| Illiterate/primary, 2nd | 12.1 (10.2-14.0) | 10.2 (8.1-12.3) | 12.8 (9.0-16.6) | 8.5 (6.3-10.7) | 10.2 (7.9-12.5) | 13.4 (11.6-15.2) | 11.2 (9.4-13.0) | 12.0 (9.2-14.8) |
| Female | ||||||||
| Ages, y | ||||||||
| 2-5 | 13.7 (10.5-16.9) | 19.3 (14.8-23.8) | 21.8 (13.8-29.8) | 13.3 (7.6-19.0) | 22.9 (18.7-27.1) | 18.1 (15.0-21.2) | 21.8 (18.7-24.9) | 22.6 (18.9-26.3) |
| 6-9 | 9.8 (7.3-12.3) | 8.4 (5.5-11.3) | 7.0 (2.6-11.4) | 6.3 (2.2-10.4) | 6.4 (4.0-8.8) | 12.3 (9.7-14.9) | 10.7 (8.4-13.0) | 9.4 (6.8-12.0) |
| 10-14 | 14.4 (12.3-16.5) | 13.1 (10.6-15.6) | 8.3 (4.9-11.7) | 11.4 (7.7-15.1) | 10.9 (8.5-13.3) | 11.4 (9.5-13.3) | 10.9 (9.1-12.7) | 12.4 (10.0-14.8) |
| SES | ||||||||
| Secondary/university, 1st | 12.5 (10.0-15.0) | 11.8 (9.1-14.5) | 11.5 (7.3-15.7) | 9.8 (7.1-12.5) | 11.7 (8.8-14.6) | 13.0 (11.0-15.0) | 14.8 (12.9-16.7) | 16.2 (14.1-18.3) |
| Illiterate/primary, 2nd | 13.1 (11.1-15.1) | 14.1 (11.7-16.5) | 10.3 (6.6-14.0) | 11.7 (9.2-14.2) | 12.3 (9.7-14.9) | 14.2 (12.3-16.1) | 13.4 (11.5-15.3) | 10.8 (8.1-13.5) |
95%CI, 95% confidence interval; IOTF, International Obesity Task Force; SES, socioeconomic status.
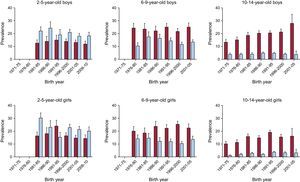
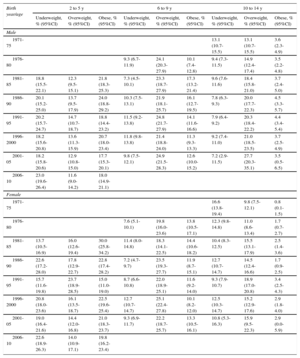
When trends by birth cohort were compared, both boys and girls aged 10 to 14 years showed an increase in the prevalence of overweight and obesity, with a corresponding decline in the prevalence of underweight. A large increase in the prevalence of overweight was observed in 10- to 14-year-olds born after 1980 compared with earlier cohorts. However, in the group aged 6 to 9 years, the trends were relatively more stable. Excess weight appears to have decreased in both boys and girls aged 2 to 5 years with corresponding increases in underweight (Table 4 and Figure 2).
Prevalence of Obesity by Year of Birth and Age (IOTF Criteria)
| Birth year/age | 2 to 5 y | 6 to 9 y | 10 to 14 y | ||||||
|---|---|---|---|---|---|---|---|---|---|
| Underweight, % (95%CI) | Overweight, % (95%CI) | Obese, % (95%CI) | Underweight, % (95%CI) | Overweight, % (95%CI) | Obese, % (95%CI) | Underweight, % (95%CI) | Overweight, % (95%CI) | Obese, % (95%CI) | |
| Male | |||||||||
| 1971-75 | 13.1 (10.7-15.5) | 13.1 (10.7-15.5) | 3.6 (2.3-4.9) | ||||||
| 1976-80 | 9.3 (6.7-11.9) | 24.1 (20.3-27.9) | 10.1 (7.4-12.8) | 9.4 (7.3-11.5) | 14.9 (12.4-17.4) | 3.5 (2.2-4.8) | |||
| 1981-85 | 18.8 (15.5-22.1) | 12.3 (9.5-15.1) | 21.8 (18.3-25.3) | 7.3 (4.5-10.1) | 23.3 (18.7-27.9) | 17.3 (13.2-21.4) | 9.6 (7.6-11.6) | 18.4 (15.8-21.0) | 3.7 (2.4-5.0) |
| 1986-90 | 20.1 (15.2-25.0) | 13.7 (9.5-17.9) | 24.0 (18.8-29.2) | 10.3 (7.5-13.1) | 21.9 (18.1-25.7) | 16.1 (12.7-19.5) | 7.8 (6.3-9.3) | 20.0 (17.7-22.3) | 4.5 (3.3-5.7) |
| 1991-95 | 20.2 (15.7-24.7) | 14.7 (10.7-18.7) | 18.8 (14.4-23.2) | 11.5 (9.2-13.8) | 24.8 (21.7-27.9) | 14.1 (11.6-16.6) | 7.9 (6.4-9.2) | 20.3 (18.4-22.2) | 4.4 (3.4-5.4) |
| 1996-2000 | 18.2 (15.6-20.8) | 13.6 (11.3-15.9) | 20.7 (18.0-23.4) | 11.8 (9.8-13.8) | 21.4 (18.8-24.0) | 11.3 (9.3-13.3) | 9.2 (7.4-11.0) | 21.0 (18.5-23.5) | 3.7 (2.5-4.9) |
| 2001-05 | 18.2 (15.8-20.6) | 12.9 (10.8-15.0) | 17.7 (15.3-20.1) | 9.8 (7.5-12.1) | 24.9 (21.5-28.3) | 12.6 (10.0-15.2) | 7.2 (2.9-11.5) | 27.7 (20.3-35.1) | 3.5 (0.5-6.5) |
| 2006-10 | 23.0 (19.6-26.4) | 11.6 (9.0-14.2) | 18.0 (14.9-21.1) | ||||||
| Female | |||||||||
| 1971-75 | 16.6 (13.8-19.4) | 9.8 (7.5-12.1) | 0.8 (0.1-1.5) | ||||||
| 1976-80 | 7.6 (5.1-10.1) | 19.8 (16.0-23.6) | 13.8 (10.5-17.1) | 12.3 (9.8-14.8) | 11.0 (8.6-13.4) | 1.7 (0.7-2.7) | |||
| 1981-85 | 13.7 (10.5-16.9) | 16.0 (12.6-19.4) | 30.0 (25.8-34.2) | 11.4 (8.0-14.8) | 18.3 (14.1-22.5) | 14.4 (10.6-18.2) | 10.4 (8.3-12.5) | 15.5 (13.1-17.9) | 2.5 (1.4-3.6) |
| 1986-90 | 22.6 (17.2-28.0) | 17.8 (12.9-22.7) | 22.8 (17.4-28.2) | 7.2 (4.7-9.7) | 23.5 (19.3-27.7) | 11.9 (8.7-15.1) | 12.7 (10.7-14.7) | 14.5 (12.4-16.6) | 1.7 (0.9-2.5) |
| 1991-95 | 15.7 (11.6-19.8) | 23.7 (18.9-28.5) | 15.0 (11.0-19.0) | 8.7 (6.6-10.8) | 22.0 (18.9-25.1) | 11.6 (9.2-14.0) | 9.3 (7.9-10.7) | 18.9 (17.0-20.8) | 3.4 (2.5-4.3) |
| 1996-2000 | 20.8 (18.0-23.6) | 16.1 (13.5-18.7) | 22.5 (19.6-25.4) | 12.7 (10.7-14.7) | 25.1 (22.4-27.8) | 10.1 (8.2-12.0) | 12.5 (10.3-14.7) | 15.2 (12.9-17.6) | 2.9 (1.8-4.0) |
| 2001-05 | 19.0 (16.4-21.6) | 14.4 (12.0-16.8) | 21.0 (18.3-23.7) | 9.3 (6.9-11.7) | 22.2 (18.7-25.7) | 13.3 (10.5-16.1) | 10.8 (5.3-16.3) | 15.9 (9.5-22.3) | 2.9 (0.0-5.9) |
| 2006-10 | 22.6 (18.9-26.3) | 14.0 (10.9-17.1) | 19.8 (16.2-23.4) | ||||||
95%CI, 95% confidence interval; IOTF, International Obesity Task Force.

From 1987 to 2011, the overall prevalence of pediatric excess weight in Spain did not increase markedly; however, the trends observed varied between age groups with a particularly noticeable upward trend in the prevalence of overweight among 10 to 14 year olds. A slight increase in the prevalence of overweight was seen in both boys and girls, while no increases were seen in the overall prevalence of obesity. Other Spanish studies have reported increases in the prevalence of excess weight in both sexes or, as in our study, indications of a stabilization trend.4,7,18,23,24 The differences with our study most likely reflect differing age groups, time periods, obesity definition, exclusion or inclusion criteria, or subpopulation groups reflecting regional differences. For example, the Enkids study, 1998-2000, measured prevalences higher than the corresponding years in our study, but used a wider age range (2-24 years) and a different obesity definition, thus hampering direct comparisons.25 Nevertheless, the pattern of higher excess weight in boys than girls is similar to ours. Sánchez-Cruz et al.7 also found a slightly higher prevalence but used an older age group (8-17 years), but similarly concluded that the prevalence of excess weight had not increased in the last decade. Of note, the trends observed in this study are consistent with other recently published research undertaken in Spain.24,26
A recent study has proposed perinatal inflammation as an early factor in the origin of cardiovascular disease with associations of early exposures with adverse cardiovascular risk profiles, including excess weight, in both childhood and adulthood.27 With evidence of early origins of cardiovascular disease, these measured prevalences are too high and are a potentially early modifiable risk factor for cardiovascular disease.
Stabilization of trends is consistent with international data in other developed countries, with reversal of trends seen in a select few. Countries with documented trend stabilization include Denmark, Greece, England, France, Netherlands, Sweden, the United States, and Australia, while Switzerland appears to have reversed trends. The timing of the turning point in the trend differs between countries, but generally occurred after 1995. Despite stabilization of trends, the level of stabilization differs between countries and remains too high.28–30
The reasons for this plateau remain unclear. Various theories have been postulated, including a saturation of excess weight levels.28 This theory suggests that with the environmental, nutritional, behavioral and societal changes that have occurred during the last few decades, all persons who would have become obese or overweight have already become so and a new set level has been established. Alternatively, the stimulus for the increasing epidemic may no longer be prevalent. Last, health promotion and obesity prevention programs may have had some impact.
When considering the observed trends, it is important to consider SES and the socioeconomic context of Spain during this time period. In our study, we considered the highest parental education level of the household as an indicator of SES, which may explain the lack of association found, possibly because childhood nutrition is often dependent on maternal level of education.7 The relationship between SES and obesity is complex, is influenced by its definition, and is not entirely consistent between developed countries.31 The financial crisis commencing in 2008 has been shown to affect the health of Europeans.24 In Spain, this has increased child poverty, unemployment, and social inequalities, which can be expected to have an effect on nutrition and other lifestyle risk factors.24 However, Spanish social policies have provided protection to children belonging to lower socioeconomic classes, potentially attenuating any association measured.32 Some of these protections, such as food subsidies, have been removed in recent years, thus increasing social inequalities and potentially causing a flow-on effect to diet quality and other lifestyle risk factors in economically vulnerable families.26 Any impact on the prevalence of childhood excess weight may still occur and there is a need for ongoing monitoring.
The trends observed in our study differed by age, sex, and SES and also differed between overweight and obesity categories. Downward trends for obesity were observed in both boys and girls aged 2 to 5 years, while trends remained steady for the overweight and underweight categories. Among children aged 6 to 9 years, despite some fluctuations, there was no notable change for either boys or girls during the study period. The largest changes were seen in girls and boys aged 10 to 14 years, with an increase in the prevalence of overweight in both sexes and a doubling of obesity among girls. Obesity prevalence appears to remain level among boys in this age group. The differing trends by sex and age seen in our study are consistent with other Spanish studies.18,33
Sex differences in trends have also been observed in other European countries and the USA.34–37 Various explanations have been given for these differences. Prior to sexual maturation, it is unlikely that physiological differences, such as muscle mass, have a strong influence. However, studies have demonstrated marked differences in obesity-associated behaviors between sexes.38,39 Data from the Spanish National Health Survey indicate sex differences in the increasing trends of sedentary behavior among youth in Spain.33 Sex differences in weight-related behaviors and perceptions of weight need to be taken into consideration when planning prevention strategies.
Consistent with our findings, age group differences in trends have been reported in other European countries as well as the USA, with a plateau in younger age groups, and increases in overweight in adolescence.37,40 The differing trends and prevalence at distinct ages raises 3 possible effects to consider: a) incidence vs persistence; b) cohort, period/early life exposure effect, and c) age effect with differing influences at distinct ages including physiological and behavioral effects.
The percentage of overweight and obesity in adolescence is determined by the incidence and persistence of excess weight. Many overweight and obese children spontaneously recover normal weight before or after puberty, but the percentage regaining normal weight, or changing weight status group, differs in distinct populations.41 In Spain, the prevalence of obesity in 10 to 14 year old boys is 5 times lower than that in boys aged 2 to 5 years. While we found a decreasing trend in obesity for children aged 2 to 5 years, this did not correspond to a decrease in obesity in older age groups, suggesting that either persistence and/or incidence are increasing in the older age groups in the newer birth cohorts.14
The age differences in the trends observed suggest an age effect. With varying BMI trajectories and differing influences throughout childhood and adolescence, the age groups analyzed can affect results. Due to the associations of adiposity rebound and age at puberty with obesity, as well as increasing social independence, adolescents and preteens should not be grouped together.
While child obesity after the age of 6 years is considered a good predictor of adult obesity,29 in Spain only a small percentage of children in this age group who are overweight or obese remain so during adolescence. There are many potential factors that could influence the difference between overweight prevalence in preteens and early adolescence, including physiological, environmental, and behavioral factors. Increasing social pressures on weight and self-perceptions of weight may come into play in early adolescence, which are not found in younger age groups. A recent study showed age variation in diet and activity-related behaviors between the ages of 2 and 16 years.38
Worryingly, the prevalence of overweight among early adolescents is increasing in contrast with the relative stability of other age groups. Potentially, health promotion and child obesity prevention initiatives focusing on early intervention, such as the well-child program, have functioned well in younger age groups but are not appropriate for adolescents. As children become increasingly independent with age, there may be an increasing media-parent and social-parent incongruity. In adolescence the social network and leisure activities have an effect on obesity, and food advertising influences intake in school-aged children.42–44 Food marketing, social networks, and media-based programs may be more appropriate for obesity intervention in this age group.43 PERSEO, a school-based program, run by the Ministries of Health and Education in Spain, has shown indicators of success and is another potential approach in this age group.45
Few studies consider trends in underweight children in Europe and even fewer consider them alongside those of obesity.18 In our study, underweight increased in children aged 2 to 5 years. When introducing population-based obesity interventions, it is important not to increase the burden of thinness; this concept was introduced by Rose when discussing population-based preventive strategies and the need for security for those at the lower limit.46 This potential consequence of obesity prevention strategies needs further investigation.47
Strenghts and LimitationsThere are some weaknesses of this study, with potential effects on the interpretation of our results. Anthropometric data were collected in a subjective manner. Parental reporting of children's height and weight may lead to overestimation of obesity in younger children and underestimation in adolescence.48 However, this method is widely used and is considered to have an acceptable level of validity in population-based studies.49 A study of Spanish children reported a sensitivity and specificity of obesity diagnosis based on parent-reported weight and height to be 78% and 96%, respectively.49 The subjective nature of these measurements will not change the trends observed, unless the over/under estimation bias changes over time.
Additionally, the proportion of missing data were higher in the early survey years. Although study samples were large, we cannot rule out a nonresponder effect, which may explain the larger fluctuations seen during this time period. Sample sizes varied for different survey years and the autonomous communities subsample. Given the association between autonomous community and the prevalence of excess weight, this was adjusted for in calculations of overall prevalence.
This study also has numerous strengths. The use of national survey data allowed analysis of nationally representative data collected with standardized methodology over 2 decades. The same questions were used in each survey year for height and weight measurements, increasing comparability between surveys. This study was also able to demonstrate trends over a 24-year period, ranging from individuals born in 1973 to those born in 2009. The use of trends by birth year allowed analysis of the potential effects of period or birth year, including early life exposures. Our study also considers underweight trends alongside excess weight trends and does not group underweight with normal weight as is often done.
CONCLUSIONSIn conclusion, the child obesity epidemic in Spain has remained relatively stable over the last 2 decades with a plateau similar to those recorded in other countries. However, it has stabilized at too high a level and remains a public health issue. Furthermore, despite this overall stable picture, the subgroup of 10- to 14-year-olds shows a worrying upward trend, particularly for the prevalence of overweight, and requires appropriate investigation and measures to halt and reverse this trend.
- –
Child obesity in Europe has reached epidemic proportions and is a significant public health problem.
- –
Spain ranks among the European countries with the highest rates of childhood obesity.
- –
In some countries child obesity rates have stabilized.
- –
Childhood BMI predicts adult BMI and is a potentially modifiable adverse cardiovascular phenotype.
- –
Overall excess weight trends appear to be stable in Spain, with some fluctuations. Despite child obesity trends not increasing exponentially, the prevalence has stabilized at a too high a level and remains a major public health issue.
- –
Trends differ depending on age, sex, and SES, with a significant upward trend in the prevalence of overweight in 10- to 14-year-olds.
- –
Analysis of trends by birth year.
- –
Inclusion of pediatric underweight trends in Spain alongside child obesity trends showing an increasing trend among children aged 2 to 5 years.
None declared.