
Diabetes mellitus (DM) is a leading causes of death, mainly due to cardiovascular complications. The aim of this study was to describe DM mortality in Spain from 1998 to 2013 and to compare it between distinct provinces.
MethodsEcological time-trend study. Data sources consisted of the population register and the death rate figures, by cause of death, from Spain's National Statistics Institute. Rates were age-standardized by the direct method. Standardized mortality rates were calculated for each province every 5 years (1998-2013). Time trends in mortality were established by joint point regression models.
ResultsThe standardized mortality rate for DM fell markedly, by 25.3% in men and by 41.4% in women from 1998 to 2013. At the beginning of the study period, mortality rates were higher in southern than in northern regions, but this difference gradually disappeared in later years. The highest mortality rates were consistently found in the Canary Islands.
ConclusionsMortality from DM fell substantially from 1998 to 2013. The marked geographical clustering showing higher mortality in the south and southeastern areas of the country was significantly reduced during the study period, except in the Canary Islands, where mortality remains strikingly high.
Keywords
Diabetes mellitus (DM) is one of the chronic diseases with the greatest impact on individuals, health systems, and society. It is considered one of the main problems for global health,1 due to its high prevalence and economic cost and associated impairments and deaths.2–4
According to data from the World Health Organization, the global prevalence of DM in 2014 was 9% in persons older than 18 years.1 Specifically in Europe, 1 in every 13 adults is diabetic according to the International Diabetes Federation.2 Meanwhile, the di@betes study reported a prevalence of type 2 DM in Spain of 13%.5
The risk factors for DM are well known and include obesity and physical inactivity.6 Thus, other factors, such as social characteristics, might explain the variations in prevalence. As reported by the Diabetes Strategy National Health System,7 the prevalence of DM in 2006 showed an inverse relationship with education level, reaching 16.4% in individuals without primary education but just 2.2% in individuals with university education.8
In 2012, an estimated 1.5 million persons died as a direct consequence of DM.9 According to the World Health Organization, DM will be the seventh most common cause of death in 2030.10 In Spain, DM is already the third most common cause of death in women and the seventh in men.11 Another study of the geographical distribution of DM mortality in Spain, performed by our group for the 1981 to 1986 period, recorded a characteristic north-south distribution, with a marked concentration of DM mortality in the south-southeast regions of the country.12
The main cause of death in diabetic patients is cardiovascular disease. Indeed, DM increases the risk of ischemic heart disease and stroke to such an extent that 50% of diabetic patients die from cardiovascular disease13 and the risk of death is at least twice as high in diabetic patients than in patients without DM.14
The aim of our study was to determine and compare DM mortality (from both types 1 and 2) in Spain and among Spanish provinces in the 1998 to 2013 period.
METHODSThis cross-sectional descriptive observational study analyzed deaths due to DM, as indicated by International Classification of Disease-10a codes (ICD-10) E10 to E14 and the CIE-9 250 code, in Spanish resident citizens at 5-year intervals (1998, 2003, 2008, and 2013). Data sources consisted of the population register and death rate figures by cause of death published on the website of the Spanish National Statistics Institute (INE). Specific rates were calculated by age, both in the overall population and according to sex, using Microsoft Excel 2010 software.
For comparisons among provinces, rates were standardized according to age group using the direct method. The population was subdivided into 6 age ranges based on the data provided by the INE and the uneven presentation according to the year of death as follows: ≤ 44, 45-54, 55-64, 65-74, 75-84, and ≥ 85 years. For standardization, we used the standardized European population in 2013 published by EUROSTAT.15 Finally, the standardized mortality rate (SMR) was calculated, corresponding to the mortality rate per 100 000 inhabitants registered in each territory according to the individual's sex and age, but with the standardized population age structure and the corresponding 95% confidence interval (95%CI). EPIDAT 3.1 software was used for this purpose. Seven mortality gradients were calculated to create mortality distribution maps for both sexes. The main gradient included the standardized national rate for each sex at the beginning of the period studied.
National SMRs were calculated for each year of the study period and for both sexes and to determine the time trends and establish joinpoint regression models. All joinpoints detected (if any) indicated a change in the mortality time trend. For each adjusted segment, we calculated the annual percent change (APC) and 95%CI. The fit was begun with 0 joinpoints. The number of joinpoints was then increased and their significance was determined using the weighted least squares method. The APC was calculated using a logarithmic transformation, and the significance of the joinpoints was determined using the Monte Carlo permutation test.16 For this analysis, we used the freeware software Joinpoint Regression Program v.4.3.1.0 from the US National Cancer Institute.17
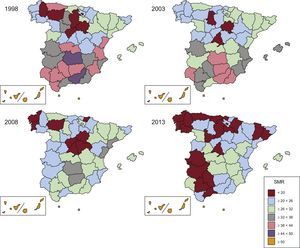
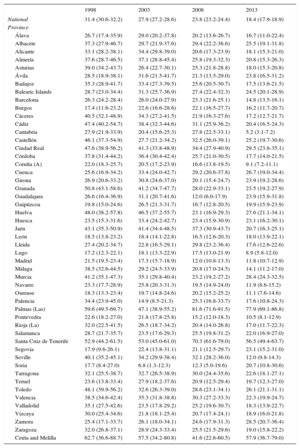
RESULTSIn 1998, the total number of deaths from DM recorded in Spain was 9509, 3610 in men (38%) and 5899 in women (62%). The SMR was 30.4/100 000 men and 31.4/100 000 women (hereafter, all reported rates are per 100 000 population), with an unequal distribution per province. The provinces with the lowest SMR (< 20) were concentrated in the north-eastern region of the Spanish peninsula, chiefly Segovia (SMR, 14.9), Lugo (SMR, 17.8), and Burgos (SMR, 17.8). In contrast, the provinces with the highest SMR (≥ 50) were the autonomous cities of Ceuta and Melilla (SMR, 63.5), Las Palmas de Gran Canaria (SMR, 61.3), and Santa Cruz de Tenerife (SMR, 53.9). There was a gradual increase in the SMR, the further south the region. The provinces with rates lower than the national average were situated to the north of Madrid, except for Palencia, Valladolid, and Asturias, whose SMRs ranged between 33.5 and 40.1. The autonomous communities (ACs) with SMRs exceeding the national average were concentrated to the south of the capital, with the exception of Alicante and the Balearic Islands (Table 1 and Figure 1).
Standardized Mortality Rate* for Diabetes Mellitus in Spain and Its Distribution by Province. Period 1998-2013
| 1998 | 2003 | 2008 | 2013 | |
|---|---|---|---|---|
| National | 31.4 (30.8-32.1) | 29.2 (28.7-29.8) | 25.8 (25.3-26.3) | 20.7 (20.2-21.1) |
| Province | ||||
| Álava | 24.8 (17.65-31.88) | 29.5 (22.48-36.55) | 26.1 (20.02-32.19) | 21.7 (16.57-26.73) |
| Albacete | 37.3 (30.03-44.55) | 30.3 (24.18-36.35) | 28.3 (22.77-33.81) | 30.6 (25.16-35.95) |
| Alicante | 34.3 (30.29-38.25) | 32.4 (28.89-35.89) | 25.5 (22.65-28.39) | 21.4 (19.01-23.86) |
| Almería | 37.1 (30.23-43.94) | 39.2 (32.48-45.90) | 26.3 (21.17-31.51) | 21.8 (17.48-26.16) |
| Asturias | 40.1 (36.22-44.02) | 27.5 (24.50-30.56) | 26.3 (23.45-29.10) | 20.0 (17.69-22.30) |
| Ávila | 24.0 (17.25-30.77) | 24.9 (18.27-31.56) | 22.6 (16.59-28.60) | 30.0 (23.20-36.70) |
| Badajoz | 32.6 (27.75-37.48) | 29.9 (25.32-34.46) | 24.4 (20.48-28.30) | 17.8 (14.64-20.88) |
| Balearic Islands | 30.4 (25.82-35.01) | 34.1 (29.51-38.73) | 29.0 (24.99-33.04) | 28.9 (25.16-32.71) |
| Barcelona | 28.4 (26.64-30.13) | 29.4 (27.71-31.06) | 26.8 (25.31-28.31) | 17.1 (16.00-18.22) |
| Burgos | 17.8 (13.29-22.23) | 23.0 (18.18-27.75) | 22.7 (18.20-27.20) | 18.5 (14.66-22.37) |
| Cáceres | 33.8 (27.88-39.79) | 35.4 (29.66-41.09) | 25.8 (20.94-30.56) | 17.0 (13.43-20.60) |
| Cádiz | 43.5 (37.97-48.96) | 36.5 (31.69-41.33) | 30.3 (26.27-34.27) | 22.0 (18.85-25.24) |
| Cantabria | 30.1 (25.04-35.12) | 22.4 (18.36-26.48) | 25.0 (20.98-29.04) | 6.1 (4.29-7.98) |
| Castellón | 41.1 (34.69-47.53) | 28.8 (23.70-33.96) | 34.1 (28.90-39.38) | 24.6 (20.41-28.74) |
| Ciudad Real | 46.7 (39.99-53.48) | 41.3 (35.37-47.23) | 36.6 (31.27-41.92) | 30.7 (26.13-35.25) |
| Córdoba | 38.5 (33.36-43.59) | 38.0 (33.08-42.91) | 28.7 (24.70-32.64) | 18.7 (15.71-21.71) |
| Coruña (A) | 21.5 (18.51-24.43) | 21.7 (18.96-24.52) | 17.2 (14.86-19.48) | 9.6 (8.01-11.26) |
| Cuenca | 24.8 (18.33-31.24) | 30.5 (23.59-37.46) | 30.7 (23.86-37.51) | 29.3 (22.93-35.57) |
| Girona | 24.7 (20.01-29.40) | 30.9 (26.04-35.79) | 23.7 (19.71-27.59) | 25.0 (21.24-28.83) |
| Granada | 46.1 (40.33-51.91) | 39.1 (34.18-44.09) | 28.3 (24.34-32.32) | 24.6 (21.14-28.05) |
| Guadalajara | 22.0 (14.88-29.09) | 25.1 (17.92-32.21) | 19.8 (13.73-25.88) | 21.3 (15.50-27.06) |
| Guipúzcoa | 25.7 (21.28-30.06) | 28.1 (23.78-32.42) | 18.5 (15.28-21.77) | 22.8 (19.46-26.16) |
| Huelva | 41.9 (34.64-49.20) | 41.1 (34.23-48.05) | 25.0 (19.88-30.05) | 28.2 (23.06-33.43) |
| Huesca | 26.7 (20.10-33.39) | 30.8 (23.95-37.70) | 26.6 (20.51-32.67) | 25.9 (20.10-31.69) |
| Jaén | 41.5 (35.53-47.44) | 40.6 (35.14-46.10) | 35.0 (30.21-39.86) | 24.7 (20.92-28.54) |
| León | 19.7 (15.93-23.50) | 21.1 (17.36-24.74) | 16.5 (13.43-19.59) | 21.9 (18.45-25.31) |
| LLeida | 26.1 (20.64-31.48) | 28.3 (22.98-33.63) | 30.3 (25.14-35.45) | 17.7 (13.87-21.46) |
| Lugo | 17.8 (13.98-21.60) | 21.5 (17.39-25.63) | 20.1 (16.29-23.91) | 10.1 (7.55-12.72) |
| Madrid | 22.0 (20.39-23.58) | 18.2 (16.83-19.49) | 12.8 (11.78-13.85) | 12.8 (11.85-13.73) |
| Málaga | 36.4 (31.83-41.03) | 29.7 (25.93-33.44) | 23.1 (19.99-26.18) | 15.7 (13.33-18.10) |
| Murcia | 38.0 (33.44-42.66) | 34.6 (30.39-38.74) | 24.7 (21.52-27.93) | 28.9 (25.68-32.11) |
| Navarre | 24.6 (20.00-29.12) | 26.5 (22.07-30.85) | 21.5 (17.73-25.29) | 13.8 (11.01-16.60) |
| Ourense | 20.5 (16.20-24.70) | 22.4 (18.18-26.59) | 22.5 (18.34-26.65) | 10.1 (7.56-12.71) |
| Palencia | 33.5 (25.07-41.95) | 17.5 (11.82-23.18) | 27.0 (20.03-33.96) | 21.7 (15.75-27.73) |
| Palmas (Las) | 61.3 (53.36-69.23) | 54.7 (47.86-61.48) | 83.7 (75.76-91.54) | 82.7 (75.63-89.83) |
| Pontevedra | 22.0 (18.48-25.58) | 22.7 (19.41-26.05) | 17.1 (14.37-19.75) | 10.8 (8.85-12.82) |
| Rioja (La) | 27.7 (20.91-34.56) | 26.1 (19.99-32.20) | 21.6 (16.44-26.79) | 19.4 (14.82-23.95) |
| Salamanca | 30.0 (24.48-35.58) | 25.7 (20.88-30.48) | 24.6 (20.13-29.00) | 23.4 (19.31-27.49) |
| Santa Cruz de Tenerife | 53.9 (47.09-60.65) | 56.6 (50.14-62.99) | 78.2 (71.00-85.40) | 68.3 (62.18-74.42) |
| Segovia | 14.9 (9.03-20.68) | 21.8 (15.11-28.45) | 18.7 (12.42-24.93) | 23.3 (16.99-29.58) |
| Seville | 39.5 (35.59-43.47) | 34.3 (30.88-37.72) | 31.8 (28.66-34.92) | 13.8 (11.85-15.70) |
| Soria | 18.3 (10.95-25.62) | 11.9 (5.95-17.77) | 16.4 (9.63-23.10) | 23.9 (15.66-32.24) |
| Tarragona | 27.6 (22.92-32.37) | 31.2 (26.53-35.90) | 33.3 (28.76-37.79) | 23.2 (19.66-26.65) |
| Teruel | 23.6 (16.29-30.82) | 24.3 (17.19-31.50) | 22.4 (15.60-29.25) | 27.7 (20.40-34.99) |
| Toledo | 41.2 (35.36-47.02) | 31.1 (26.29-35.89) | 29.7 (25.34-34.13) | 27.2 (23.30-31.10) |
| Valencia | 39.6 (36.44-42.71) | 36.6 (33.78-39.43) | 31.2 (28.78-33.69) | 23.8 (21.80-25.78) |
| Valladolid | 37.1 (31.01-43.21) | 25.3 (20.59-29.92) | 25.2 (20.80-29.53) | 20.0 (16.36-23.61) |
| Vizcaya | 29.6 (25.91-33.26) | 24.4 (21.25-27.49) | 20.8 (18.14-23.48) | 18.8 (16.51-21.15) |
| Zamora | 23.7 (17.67-29.69) | 28.6 (22.37-34.89) | 26.5 (20.88-32.09) | 29.7 (23.60-35.89) |
| Zaragoza | 28.8 (24.97-32.65) | 25.2 (21.79-28.52) | 27.9 (24.54-31.23) | 21.5 (18.71-24.20) |
| Ceuta and Melilla | 63.5 (42.35-84.63) | 60.4 (41.40-79.36) | 38.0 (24.26-51.67) | 58.1 (41.46-74.81) |

This geographic inequality was maintained in 2003. A total of 10 001 deaths were recorded, 3943 in men (39.4%) and 6058 in women (60.6%). Again, the provinces with the lowest SMRs were concentrated in the center and northeast of the peninsula: Soria (SMR, 11.9), Palencia (SMR, 17.5), and Madrid (SMR, 18.2). The further south, the higher the rate, with the highest rates in the ACs of Extremadura, Murcia, and Andalusia and, again, highest values (≥ 50) in Las Palmas de Gran Canaria (SMR, 54.7), Santa Cruz de Tenerife (SMR, 56.6), and Ceuta and Melilla (SMR, 60.4) (Table 1 and Figure 1).
In 2008, the total number of deaths from DM was 10 039, 4126 in men (41.1%) and 5913 in women (58.9%). Although the provinces with the lowest SMR (< 30) continued to be grouped in the center and north-east of the national territory (Galicia, Castilla-La Mancha, and Madrid), there was a general decrease in the SMR. The previous north-south gradient also softened, with most provinces in the south showing a low SMR: Malaga (SMR, 23.1), Murcia (SMR, 24.7), Alicante (SMR, 25.5), and Cáceres (SMR, 25.8). This general reduction in the SMR was not seen in Ceuta and Melilla (SMR, 38.0), Santa Cruz de Tenerife (SMR, 78.2), and Las Palmas de Gran Canaria (SMR, 83.7), whose rates remained elevated (Table 1 and Figure 1).
Finally, the disappearance of the north-south distribution was consolidated in 2013. There were 9280 deaths, 3920 in men (42.2%) and 5360 in women (57.8%). The number of provinces with an SMR<20 increased to 17, distributed throughout the national territory without geographical preferences. Again, exceptions to this trend were Ceuta and Melilla (SMR, 58.1), Santa Cruz de Tenerife (TME, 68.3), and Las Palmas de Gran Canaria (TME, 82.7) (Table 1 and Figure 1).
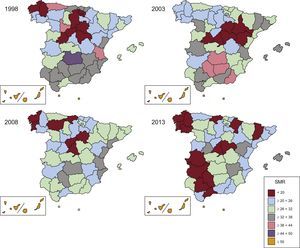
The geographic pattern for men was similar to that of both sexes, although the variation was slightly higher. Men shared the reduction in north-south inequality over time. In 1998, although the provinces with the lowest SMR were still grouped in the north of the country, the rates for men in other provinces exceeded the national average that year (SMR, 30.5), such as Asturias (SMR, 39.8), Valladolid (SMR, 39.1), and Guipúzcoa (SMR, 37.5). The highest rates were again found in the Canary Islands and Ceuta and Melilla. In 2003, there were few significant changes, and both the geographic distribution and the time trend were still similar. In 2008, there was a notable reduction in inequality among the provinces, with little remaining inequality in 2013. However, as seen for both sexes together, Las Palmas, Santa Cruz de Tenerife, and Ceuta and Melilla continued to have high mortality rates (SMRs in 2013 of 86.4, 83.3, and 58.4, respectively) (Table 2 and Figure 2).
Standardized Mortality Rate* for Diabetes Mellitus in Spain and Its Distribution by Province. Period 1998-2013. Men
| 1998 | 2003 | 2008 | 2013 | |
|---|---|---|---|---|
| National | 30.4 (29.4-31.5) | 29.6 (28.6-30.5) | 27.2 (26.3-28.0) | 22.7 (22.0-23.4) |
| Province | ||||
| Álava | 19.4 (9.2-29.6) | 27.8 (16.6-39.0) | 31.9 (21.0-42.7) | 28.7 (19.2-38.3) |
| Albacete | 36.1 (24.9-47.4) | 29.0 (19.9-38.1) | 25.2 (17.1-33.3) | 37.1 (27.8-46.4) |
| Alicante | 33.8 (27.5-40.1) | 28.2 (22.9-33.5) | 32.8 (27.5-38.1) | 25.8 (21.5-30.0) |
| Almería | 35.3 (24.6-45.9) | 41.3 (30.0-52.6) | 26.9 (18.3-35.5) | 22.6 (15.7-29.5) |
| Asturias | 39.8 (33.2-46.4) | 28.1 (22.9-33.3) | 27.0 (22.2-31.8) | 22.3 (18.3-26.4) |
| Ávila | 17.1 (8.4-25.8) | 16.0 (7.8-24.2) | 24.9 (15.0-34.7) | 36.3 (24.6-48.0) |
| Badajoz | 26.8 (19.7-34.0) | 21.9 (15.7-28.1) | 21.2 (15.4-27.0) | 18.0 (12.9-23.1) |
| Balearic Islands | 31.9 (24.4-39.4) | 37.1 (29.3-44.9) | 29.5 (23.0-35.9) | 34.2 (27.6-40.8) |
| Barcelona | 31.7 (28.6-34.9) | 33.9 (30.9-37.0) | 31.8 (29.0-34.5) | 20.4 (18.4-22.4) |
| Burgos | 17.6 (10.7-24.4) | 24.0 (15.8-32.3) | 22.3 (15.1-29.4) | 20.7 (14.2-27.2) |
| Cáceres | 23.4 (15.5-31.4) | 34.4 (25.4-43.3) | 28.6 (20.7-36.5) | 15.5 (10.0-20.9) |
| Cádiz | 35.3 (27.2-43.3) | 33.8 (25.7-42.0) | 27.0 (21.1-33.0) | 24.7 (18.9-30.4) |
| Cantabria | 32.7 (23.8-41.6) | 24.1 (17.2-31.1) | 18.4 (12.7-24.1) | 7.1 (3.8-10.4) |
| Castellón | 33.2 (24.0-42.3) | 28.7 (20.6-36.7) | 35.5 (26.8-44.2) | 22.6 (16.3-28.9) |
| Ciudad Real | 45.8 (34.7-56.8) | 40.4 (30.9-49.9) | 37.9 (29.2-46.6) | 31.4 (24.0-38.8) |
| Córdoba | 37.3 (29.1-45.4) | 40.6 (31.9-49.3) | 33.5 (26.3-40.6) | 19.6 (14.6-24.6) |
| Coruña (A) | 19.9 (15.0-24.7) | 22.1 (17.5-26.8) | 17.3 (13.4-21.1) | 10.1 (7.3-12.8) |
| Cuenca | 23.1 (13.6-32.6) | 25.5 (15.5-35.4) | 31.8 (21.0-42.7) | 31.7 (21.5-42.0) |
| Girona | 20.4 (13.7-27.2) | 30.3 (22.5-38.2) | 29.4 (22.2-36.5) | 25.6 (19.5-31.8) |
| Granada | 36.7 (28.5-44.9) | 35.1 (27.6-42.7) | 28.0 (21.7-34.3) | 25.7 (20.0-31.3) |
| Guadalajara | 15.0 (6.1-23.9) | 17.4 (7.9-26.9) | 29.0 (17.8-40.3) | 16.5 (8.6-24.4) |
| Guipúzcoa | 37.5 (28.0-47.0) | 31.1 (22.9-39.2) | 20.3 (14.6-26.0) | 25.9 (20.1-31.6) |
| Huelva | 32.3 (21.5-43.2) | 29.7 (20.2-39.1) | 26.4 (17.9-35.0) | 29.7 (20.8-38.6) |
| Huesca | 30.1 (19.4-40.9) | 26.4 (16.4-36.3) | 28.9 (19.3-38.4) | 28.4 (19.0-37.9) |
| Jaén | 36.3 (27.6-44.9) | 39.8 (30.8-48.8) | 29.7 (22.7-36.6) | 29.2 (22.7-35.7) |
| León | 20.9 (14.7-27.1) | 25.1 (18.5-31.8) | 15.8 (10.9-20.7) | 27.4 (21.4-33.3) |
| Lleida | 23.1 (15.4-30.9) | 35.1 (25.9-44.3) | 30.4 (22.2-38.6) | 17.6 (11.8-23.5) |
| Lugo | 18.0 (12.1-23.9) | 25.6 (18.5-32.7) | 22.6 (16.2-29.0) | 11.3 (7.0-15.7) |
| Madrid | 21.6 (18.9-24.3) | 19.2 (16.8-21.5) | 13.7 (11.9-15.5) | 13.7 (12.1-15.3) |
| Málaga | 30.0 (23.4-36.6) | 29.7 (23.5-35.9) | 25.9 (20.5-31.3) | 18.2 (14.0-22.5) |
| Murcia | 32.5 (25.6-39.4) | 31.4 (25.0-37.9) | 25.5 (20.4-30.6) | 28.5 (23.4-33.6) |
| Navarre | 25.3 (17.7-32.9) | 28.1 (20.4-35.7) | 22.8 (16.6-29.0) | 16.2 (11.3-21.2) |
| Ourense | 23.4 (16.0-30.8) | 24.7 (17.5-31.8) | 24.6 (17.7-31.5) | 8.3 (4.5-12.0) |
| Palencia | 28.7 (15.9-41.5) | 21.2 (10.6-31.9) | 27.4 (16.0-38.7) | 26.7 (16.2-37.3) |
| Palmas (Las) | 62.6 (49.8-75.5) | 65.6 (53.6-77.6) | 85.3 (72.4-98.2) | 86.5 (75.0-98.0) |
| Pontevedra | 20.0 (14.1-26.0) | 23.7 (17.8-29.6) | 19.1 (14.4-23.9) | 10.8 (7.4-14.1) |
| Rioja (La) | 23.9 (13.1-34.6) | 22.9 (13.9-32.0) | 22.1 (13.8-30.3) | 21.2 (13.6-28.7) |
| Salamanca | 30.7 (22.0-39.5) | 27.3 (19.5-35.2) | 22.1 (15.3-28.9) | 25.2 (18.4-31.9) |
| Santa Cruz de Tenerife | 55.2 (44.1-66.3) | 59.7 (49.2-70.2) | 88.0 (75.6-100.5) | 83.4 (72.6-94.2) |
| Segovia | 10.5 (2.7-18.3) | 22.0 (10.8-33.2) | 14.2 (5.7-22.6) | 22.0 (12.3-31.8) |
| Seville | 38.0 (31.3-44.6) | 33.5 (27.8-39.1) | 30.3 (25.1-35.4) | 15.9 (12.5-19.3) |
| Soria | 18.8 (7.1-30.5) | 18.4 (6.9-29.8) | 19.5 (8.3-30.8) | 26.9 (13.3-40.5) |
| Tarragona | 21.1 (14.6-27.7) | 28.2 (21.1-35.3) | 37.5 (29.9-45.0) | 23.7 (18.1-29.3) |
| Teruel | 25.0 (13.3-36.7) | 18.6 (8.6-28.7) | 22.2 (11.9-32.5) | 36.1 (23.3-48.9) |
| Toledo | 30.4 (22.6-38.3) | 29.0 (21.5-36.5) | 30.3 (23.2-37.3) | 27.9 (21.7-34.1) |
| Valencia | 41.1 (35.8-46.4) | 36.1 (31.6-40.7) | 32.3 (28.1-36.4) | 25.5 (22.1-29.0) |
| Valladolid | 39.1 (29.0-49.2) | 26.8 (19.0-34.6) | 25.2 (17.8-32.6) | 20.9 (15.0-26.8) |
| Vizcaya | 28.0 (21.9-34.2) | 27.9 (22.1-33.7) | 20.6 (16.1-25.2) | 18.1 (14.2-21.9) |
| Zamora | 21.3 (12.6-30.1) | 33.2 (22.7-43.8) | 28.1 (18.8-37.3) | 31.2 (21.5-40.9) |
| Zaragoza | 23.3 (17.6-29.0) | 17.7 (13.2-22.2) | 29.9 (24.3-35.5) | 24.1 (19.4-28.9) |
| Ceuta and Melilla | 63.2 (27.3-99.2) | 67.9 (33.0-102.9) | 31.0 (13.0-48.9) | 58.8 (31.1-86.6) |

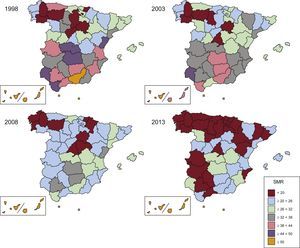
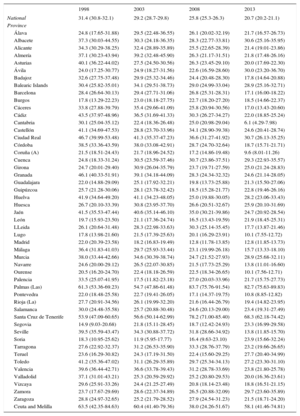
Women showed an even more striking north-south dichotomy in 1998 and 2003 and its progressive disappearance in 2008 and 2013. Again, and in a virtually unchanged manner, the highest SMRs were seen in Las Palmas, Ceuta and Melilla, and Santa Cruz de Tenerife (SMRs in 2013 of 77.9, 57.9, and 56.5, respectively) (Table 3 and Figure 3).
Standardized Mortality Rate* for Diabetes Mellitus in Spain and Its Distribution by Province. Period 1998-2013. Women
| 1998 | 2003 | 2008 | 2013 | |
|---|---|---|---|---|
| National | 31.4 (30.6-32.2) | 27.9 (27.2-28.6) | 23.8 (23.2-24.4) | 18.4 (17.9-18.9) |
| Province | ||||
| Álava | 26.7 (17.4-35.9) | 29.0 (20.2-37.8) | 20.2 (13.6-26.7) | 16.7 (11.0-22.4) |
| Albacete | 37.3 (27.9-46.7) | 29.7 (21.9-37.6) | 29.4 (22.2-36.6) | 25.5 (19.1-31.8) |
| Alicante | 33.1 (28.2-38.1) | 34.4 (29.8-39.0) | 20.6 (17.3-23.9) | 18.1 (15.3-21.0) |
| Almería | 37.6 (28.7-46.5) | 37.1 (28.8-45.4) | 25.8 (19.3-32.3) | 20.8 (15.3-26.3) |
| Asturias | 39.0 (34.2-43.7) | 26.4 (22.7-30.1) | 25.3 (21.8-28.8) | 18.0 (15.3-20.8) |
| Ávila | 28.5 (18.9-38.1) | 31.6 (21.5-41.7) | 21.3 (13.5-29.0) | 23.8 (16.5-31.2) |
| Badajoz | 35.3 (28.9-41.7) | 33.4 (27.3-39.5) | 25.6 (20.5-30.7) | 17.5 (13.6-21.5) |
| Balearic Islands | 28.7 (23.0-34.4) | 31.3 (25.7-36.9) | 27.4 (22.4-32.3) | 24.5 (20.1-28.9) |
| Barcelona | 26.3 (24.2-28.4) | 26.0 (24.0-27.9) | 23.3 (21.6-25.1) | 14.8 (13.5-16.1) |
| Burgos | 17.4 (11.6-23.2) | 22.6 (16.6-28.6) | 22.1 (16.5-27.7) | 16.2 (11.7-20.7) |
| Cáceres | 40.5 (32.1-48.9) | 34.3 (27.2-41.5) | 21.9 (16.3-27.6) | 17.2 (12.7-21.7) |
| Cádiz | 47.4 (40.2-54.7) | 38.4 (32.3-44.6) | 31.1 (25.9-36.2) | 20.4 (16.5-24.3) |
| Cantabria | 27.9 (21.9-33.9) | 20.4 (15.6-25.3) | 27.8 (22.5-33.1) | 5.2 (3.1-7.2) |
| Castellón | 46.1 (37.3-54.9) | 27.7 (21.2-34.2) | 32.5 (26.0-39.1) | 25.2 (19.7-30.6) |
| Ciudad Real | 47.6 (38.9-56.2) | 41.3 (33.8-48.9) | 34.4 (27.9-40.9) | 29.5 (23.8-35.1) |
| Córdoba | 37.8 (31.4-44.2) | 36.4 (30.4-42.4) | 25.7 (21.0-30.5) | 17.7 (14.0-21.5) |
| Coruña (A) | 22.0 (18.3-25.7) | 20.5 (17.2-23.9) | 16.6 (13.8-19.5) | 9.1 (7.2-11.1) |
| Cuenca | 25.6 (16.9-34.2) | 33.4 (24.0-42.7) | 29.2 (20.6-37.8) | 26.7 (19.0-34.4) |
| Girona | 26.9 (20.6-33.2) | 30.8 (24.6-37.0) | 20.1 (15.4-24.7) | 23.9 (19.2-28.6) |
| Granada | 50.8 (43.1-58.6) | 41.2 (34.7-47.7) | 28.0 (22.9-33.1) | 23.5 (19.2-27.9) |
| Guadalajara | 26.6 (16.4-36.9) | 31.1 (20.7-41.6) | 12.0 (6.0-17.9) | 23.9 (15.9-31.8) |
| Guipúzcoa | 19.8 (15.0-24.6) | 26.5 (21.3-31.7) | 16.7 (12.8-20.5) | 19.9 (15.9-23.9) |
| Huelva | 48.0 (38.2-57.8) | 46.5 (37.2-55.7) | 23.1 (16.9-29.3) | 27.6 (21.1-34.1) |
| Huesca | 23.5 (15.3-31.6) | 33.4 (24.2-42.7) | 23.4 (15.9-30.9) | 23.1 (16.2-30.1) |
| Jaén | 43.1 (35.3-50.9) | 41.4 (34.4-48.5) | 37.3 (30.9-43.7) | 20.7 (16.3-25.1) |
| León | 18.5 (13.8-23.2) | 18.4 (14.1-22.8) | 16.5 (12.6-20.3) | 18.0 (13.9-22.1) |
| Lleida | 27.4 (20.2-34.7) | 22.8 (16.5-29.1) | 29.8 (23.2-36.4) | 17.6 (12.6-22.6) |
| Lugo | 17.2 (12.3-22.1) | 18.1 (13.3-22.9) | 17.5 (13.0-21.9) | 8.9 (5.8-12.0) |
| Madrid | 21.5 (19.5-23.4) | 17.3 (15.7-18.9) | 12.0 (10.8-13.3) | 11.8 (10.7-12.9) |
| Málaga | 38.5 (32.6-44.5) | 29.2 (24.5-33.9) | 20.8 (17.0-24.5) | 14.1 (11.2-17.0) |
| Murcia | 41.2 (35.1-47.3) | 35.1 (29.8-40.4) | 23.2 (19.2-27.2) | 28.4 (24.3-32.5) |
| Navarre | 23.3 (17.7-28.9) | 25.8 (20.3-31.3) | 19.5 (14.9-24.0) | 11.9 (8.6-15.2) |
| Ourense | 18.3 (13.3-23.4) | 19.7 (14.8-24.6) | 20.2 (15.2-25.2) | 11.1 (7.6-14.6) |
| Palencia | 34.4 (23.9-45.0) | 14.9 (8.5-21.3) | 25.3 (16.8-33.7) | 17.6 (10.8-24.3) |
| Palmas (Las) | 59.6 (49.5-69.7) | 47.1 (38.9-55.2) | 81.6 (71.6-91.5) | 77.9 (69.1-86.8) |
| Pontevedra | 22.6 (18.2-27.0) | 21.8 (17.8-25.8) | 15.2 (12.0-18.3) | 10.5 (8.1-12.9) |
| Rioja (La) | 32.0 (22.5-41.5) | 26.5 (18.7-34.2) | 20.4 (14.0-26.8) | 17.0 (11.7-22.3) |
| Salamanca | 28.7 (21.7-35.7) | 23.5 (17.6-29.3) | 25.5 (19.8-31.2) | 22.0 (16.9-27.0) |
| Santa Cruz de Tenerife | 52.9 (44.2-61.5) | 53.0 (45.0-61.0) | 70.3 (61.6-79.0) | 56.5 (49.4-63.7) |
| Segovia | 17.9 (9.6-26.1) | 22.4 (13.8-31.1) | 21.1 (12.5-29.7) | 23.1 (15.2-31.0) |
| Seville | 40.1 (35.2-45.1) | 34.2 (29.9-38.4) | 32.1 (28.2-36.0) | 12.0 (9.8-14.3) |
| Soria | 17.7 (8.4-27.0) | 6.8 (1.3-12.3) | 12.3 (5.0-19.6) | 20.7 (10.8-30.6) |
| Tarragona | 32.1 (25.5-38.7) | 32.7 (26.5-38.9) | 30.0 (24.4-35.6) | 22.6 (18.1-27.1) |
| Teruel | 23.6 (13.8-33.4) | 27.9 (18.2-37.6) | 20.9 (12.5-29.4) | 19.7 (12.3-27.0) |
| Toledo | 48.1 (39.9-56.2) | 32.6 (26.3-39.0) | 28.6 (23.1-34.1) | 26.1 (21.1-31.1) |
| Valencia | 38.5 (34.6-42.4) | 35.3 (31.8-38.8) | 30.3 (27.2-33.3) | 22.3 (19.9-24.7) |
| Valladolid | 35.1 (27.5-42.6) | 23.5 (17.8-29.2) | 25.2 (19.6-30.7) | 18.3 (13.9-22.7) |
| Vizcaya | 30.0 (25.4-34.6) | 21.8 (18.1-25.4) | 20.7 (17.4-24.1) | 18.9 (16.0-21.8) |
| Zamora | 25.4 (17.1-33.7) | 26.1 (18.0-34.1) | 24.6 (17.9-31.3) | 28.5 (20.7-36.4) |
| Zaragoza | 32.0 (26.8-37.1) | 28.9 (24.3-33.4) | 25.5 (21.5-29.6) | 19.0 (15.8-22.2) |
| Ceuta and Melilla | 62.7 (36.6-88.7) | 57.5 (34.2-80.8) | 41.6 (22.6-60.5) | 57.9 (36.7-79.0) |

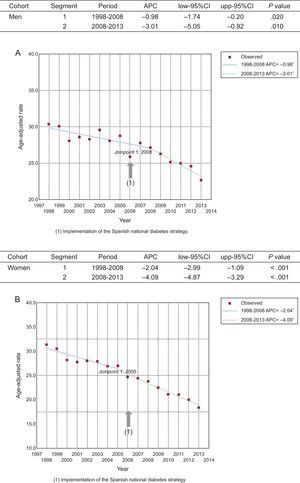
Analysis of the mortality trends during the entire study period revealed that the national average age-adjusted SMR in men decreased from 30.4 (29.4-31.5) in 1998 to 22.7 (22.0-23.4) in 2013, an overall reduction of 25.3%. The rate in women decreased from 31.4 (30.6-32.2) in 1998 to 18.4 (17.9-18.9) in 2013, an overall reduction of 41.4%.
More in-depth analysis of the time trends in men (Figure 4A) revealed a turning point in the trend (joinpoint) of mortality from DM, occurring in 2008. Although there was some variation in mortality rates between 1998 and 2008, there was a significant decrease in mortality, as reflected in the APC of –0.98% (95%CI, –1.74 to –0.20). From 2008, the decrease in mortality gathered pace until 2013, showing a significant APC of –3.01%.

In women (Figure 4B), a change in the trend was seen in 2005. There was a significant decrease in mortality between 1998 and 2005, reflected in the APC of –2.04% (95%CI, –2.99 to –1.09). From 2005, the decrease in mortality increased until 2013, with a significant APC of –4.09%.
DISCUSSIONThe data obtained from 1998 to 2003 agree with those of our previous analysis12 of the 1981 to 1986 period. The excess mortality was concentrated in the peninsular provinces of the south and southeast, the insular provinces, and the autonomous cities of Ceuta and Melilla. However, in the 2008 to 2013 period, this unequal north-south distribution disappeared, due to a marked reduction in mortality from DM in most of the Spanish national territory, but particularly in the regions with the highest previous mortality, and there was less territorial inequality. An exception was the provinces of the Canary Islands and Ceuta and Melilla, whose SMRs have barely changed since 1998.
Orozco et al.12 also indicated that the geographical clustering observed between 1981 and 1986 could be explained by a higher prevalence of the disease. This hypothesis was supported in 1998 and 2003 by the prevalence data per AC reported in the Spanish National Health Survey of 2001 and 2003.8 However, because the mortality from DM decreased even though DM prevalence per AC was maintained or increased, the theory lost strength in 2008.7
These findings strengthen the hypothesis that the advances in primary, secondary, and tertiary prevention and the new drugs approved in these years have smoothened the mortality rates between patients with and without DM and thata higher prevalence would not necessarily equal higher mortality. A Swedish study18 of people with DM found an excess risk of death from any cause of 15% (hazard ratio [HR], 1.15; 95%CI, 1.14-1.16) and cardiovascular mortality of 14% (HR, 1.14; 95%CI, 1.13-1.15), far from the values reported in previous publications, which showed double the risk.14 Even in patients older than 75 years, the HR for death from any cause was 0.95 (95%CI, 0.94-0.96), even less than that of nondiabetic controls. The mortality was influenced by age, glycemic control, and presence of albuminuria. Another study performed in the United States that analyzed the 1969 to 2013 period found a decrease of 42.9% (95%CI, 42.8-43.0) in death from any cause and a reduction in the rates of the main causes of death: stroke, heart failure, accidents, unintentional injuries, cancer, and DM.19 There was a reduction in the mortality rate from DM of 16% (95%CI, 15.4%-17.5%), less than that seen in our study (25.3% in men and 41.4% in women) and that observed in other main causes of death studied by other authors, which ranged from 77% (95%CI, 76.9%-77.2%) for stroke to 17.9% (95%CI, 17.5%-18.2%) for cancer.
Performed in 24 European countries, the EUROASPIRE IV study20 found that more patients with DM who have had a coronary event received beta-blockers and angiotensin-converting enzyme inhibitors (60% vs 53%) and the 4 prophylactic drugs together (aspirin, statins, beta-blockers, and angiotensin-converting enzyme inhibitors/angiotensin receptor blockers) than nondiabetic patients and showed better low-density lipoprotein-cholesterol control (28% vs 16%), but slightly worse blood pressure control (54% vs 68%).
In Spain, the 1998 to 2005 period saw a 40% reduction in death from ischemic heart disease in patients with DM,21 largely due to better risk factor control, particularly cholesterol (30%) and hypertension (15%), as well as treatment of the acute event (11%), secondary prevention (10%), and heart failure treatment (9%).
In another study that analyzed the 1993 to 2003 period and involved the participation of 433 general practitioners in Catalunya,22 there were reduced prevalences of retinopathy and albuminuria of 40.7% and 46%. The same research group, in a study of 23 501 diabetic patients from 1993 to 2007,23 found improved blood pressure control (from 45.4% to 61.1%), dyslipidemia (from 25.5% to 65.6%), and glycemia (from 41.5% to 62.4%).
Accordingly, cardiovascular risk factors need to be strictly controlled to reduce the morbidity and mortality of diabetic people.24 In Spain, there have been advances in diagnosis, control, and treatment, but there is still room for improvement.25,26 For example, the prevalence of smoking in the 1987 to 2009 period in Spain decreased from 34.6% to 20.7% in men with DM but increased among women.27
The management of coronary events also improved in Spain, and the number of diabetic patients receiving percutaneous coronary interventions quadrupled in the 2001 to 2010 period.21 There was also increased use of new techniques such as bariatric surgery in diabetic patients, from 17.3% to 25.5% in 2001 to 2010,28 probably due to greater use of laparoscopic techniques.
Greater use of health care resources also provided more opportunities for the detection and control of risk factors and acute coronary events. Between 1993 and 2006, there was an increase of 34% in the use of health care resources in Spain by individuals with DM,29 with larger increases in admissions (from 13.2% to 18.0%) and emergency department visits than in individuals without DM (19.6% to 36.6% vs 13.8% to 29.0%).
Although determination of causal associations is impossible with this type of study, the improvements in the mortality rates (Figure 4A and Figure 4B) and inequality between provinces (Figure 1, Figure 2, and Figure 3) temporally coincided with the appearance of the Diabetes Strategy of the Spanish National Health System in 2006, which was revised and updated in 2012.7 This might have been a conditioning factor.
Some improvement strategies have been undertaken in Spain, with good results.30 These strategies availed of the new health care models proposed for chronic diseases such as the Chronic Care Model. This model is recommended by the latest guidelines of the American Diabetes Association.31
Other aspects may also be involved, such as social conditions. Thus, for example, new factors need to be identified to explain the lack of improvements in certain ACs, such as the Canary Islands and Ceuta and Melilla. A number of such determinants have been proposed, such as socioeconomic status and the education levels of patients and their parents, and even genetic and environmental factors,32 although there may also be differences in the population-wide strategies implemented by each AC.11 In a pooled analysis of 11 studies,33 the Canary Islands, Andalusia, and Extremadura showed higher prevalences of cardiovascular risk factors, although only the findings from the Canary Islands were associated with the results of our study.
Another factor to bear in mind is that some ACs might have better diagnostic ability, leading to the presence of more patients in mild disease stages with consequently lower mortality. Some ACs might also have bigger and better registries of chronic disease, perhaps due to the introduction of electronic medical records, particularly in primary care.
In Spain, calculation of mortality tables is traditionally the task of the INE, founded in 1945. The mortality and population data analyzed are official figures derived from the national records of the INE.
LimitationsOne possible limitation is the variability in the coding of the basic cause of death among regions, although all regions used standardized coding methods. This limitation is also common to mortality studies. The Spanish Ministry of Health, Social Services, and Equality34 periodically reports the methodology used for the selection and classification of the main causes of death and its validity, adhering to the criteria used by the Centers for Disease Control and Prevention of Atlanta. A Spanish study performed in Navarre,35 which compared the official number of deaths of the INE with that obtained using searches of multiple sources, ruled out the presence of significant underreporting of the official mortality rate.
Another limitation of the study related to data collection and analysis is the joint publication of the deaths from DM in the autonomous cities of Ceuta and Melilla in 1998. This pooling hinders the determination of the SMR for each city, although the cities have similar sociodemographic characteristics.
The higher mortality seen in the Canary Islands and its persistence agree with the data from the DARIOS study performed in the Canary Islands.36 This study reported that the prevalences of DM, obesity, blood pressure, metabolic syndrome, and insulin resistance were higher in that community than in the rest of Spain. However, another study37 reported an obesity prevalence in the Canary Islands that, although still high, was lower than that of other ACs such as Andalusia, Galicia, and Asturias.
Further studies are required to shed light on the reasons for the exceptionality of the Canary Islands and the autonomous cities of Ceuta and Melilla or determine whether, as suggested by Segura del Pozo et al.38 in another study of mortality due to cirrhosis and social deprivation, “postal code is more important than genetic code”. More in-depth analysis is needed of risk factors and social determinants and implementation is required of health care programs and medical and social interventions that could erase these inequalities. Primary prevention continues to play a fundamental role39 because it has reduced cardiovascular events and coronary disease prevalence in the asymptomatic diabetic population.
CONCLUSIONSThe last 15 years have shown a general decrease in mortality from DM in Spain: 25.3% in men and 41.4% in women. The decrease has been greater in regions with previously higher mortality rates and has thus reduced inequalities among provinces. The exceptions are the Canary Islands and the autonomous cities of Ceuta and Melilla, which have failed to show this improvement.
CONFLICTS OF INTERESTNone.
- –
In Spain, diabetes mellitus is the third most common cause of death in women and the seventh in men.
- –
Cardiovascular disease is the leading cause of death in individuals with diabetes mellitus.
- –
From 1981 to 1986, diabetes mellitus mortality was higher in the regions in the south and south-east of Spain, giving a prominent north-south clustering.
- –
From 1998 to 2013, mortality from diabetes mellitus in Spain decreased by 25.3% in men and by 41.4% in women.
- –
Initially, the southern regions showed higher mortality, which disappeared over time, and there was less territorial inequality in 2008 and 2013.
- –
The highest mortality rates were seen in the Canary Islands, which failed to show the decrease seen in other Spanish regions.