Keywords
INTRODUCTION
Reperfusion therapy with primary angioplasty has contributed to reduced morbidity and mortality in patients with acute myocardial infarction (AMI).1 The speed and extent of microvascular flow restoration are related to eventual functional recovery of affected segments. Viable areas are identified by detecting microcirculation integrity.2-4 However, restoration of contractile function depends on the proportion of myocardium saved and, therefore, on the percentage of microvascular flow.
Myocardial contrast echocardiography (MCE) is a technique currently under development that has shown its usefulness in identifying viable tissue.5,6 Prediction of functional recovery using MCE has been evaluated in several studies7-9 but to our knowledge, measurement of perfusion has been qualitative or semi-quantitative.
The development of techniques that use bubble behavior to measure parameters such as volume, myocardial blood flow and myocardial filling time has led to advances in detecting microvascular dysfunction.10
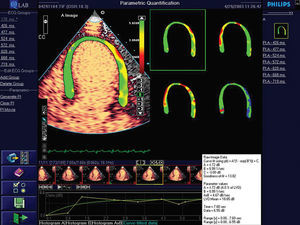
New, recently-developed software (Q-lab, Philips, Andover, USA) provides color-coded parametric imaging of the myocardium. This produces a 4-color map: 1 color represents myocardial blood volume (a); a second, myocardial blood flow velocity; a third, myocardial blood flow (axbeta); and the fourth maps data quality at each point in the region of interest (Figure 1).

Figure 1. Parametric image of myocardium. The parametric image provides 4 color maps: one represents myocardial blood volume (top left); another blood flow velocity (top right); another myocardial blood flow (bottom left); and the fourth is a map of data quality at each point (bottom right).
The objectives of our study were:
1. To quantify myocardial perfusion of akinetic segments in patients with AMI undergoing primary angioplasty.
2. To determine the usefulness of parametric imaging-based measurement to predict functional recovery of akinetic segments.
PATIENTS AND METHODS
Study Design
We recruited 49 consecutive patients diagnosed with AMI and undergoing primary angioplasty who presented none of the exclusion criteria and were scheduled for coronary angiography at 6-month follow-up. Following our standard protocol for this group, patients underwent a perfusion study using 2-dimensional contrast echocardiography at 2-5 days post-infarction. At 6 months, they underwent another coronary angiography and standard echocardiography.
Population
We performed a prospective analysis of 49 patients admitted with a diagnosis of AMI and undergoing primary angioplasty.
Diagnosis of AMI was based on 2 of the following criteria:
- Characteristic precordial pain >30 min.
- ST-segment elevation of 2 mm in at least 2 adjacent leads.
- MB isoenzyme of creatinkinase (CK-MB) elevation to twice reference levels.
Exclusion criteria included: presence of previous infarction, poor acoustic window, hemodynamic instability, and patient refusal to be included in the protocol.
Coronary Angiography
After diagnosis of AMI, all patients underwent urgent coronary angiography following our hospital protocol. Decisions on revascularization procedures, stenting, and administration of antiplatelet agents were the responsibility of the medical team attending.
After primary angioplasty, flow in the infarction-related vessel was determined with the Thrombolysis in Myocardial Infarction Trial (TIMI) classification. Procedures were considered successful when TIMI grade 3 flow and residual stenosis <50% were present.
Coronary angiography was performed to monitor the procedure at 6 months post-infarction. Restenosis was considered to have occurred when a luminal reduction of ≥70% was found.
Echocardiographic Study
Echocardiography was performed with a Philips 5500 version C.1 unit with S3 sound. Images obtained were stored on disc.
Standard Echocardiography
All patients underwent baseline echocardiography with harmonic imaging, which determined regional wall motion in the apical 2- and 4-chamber views according to the American Society of Echocardiography recommendations.11 Interpretations were defined as: 1 = normokinesia, 2 = hypokinesia, 3 = akinesia, and 4 = dyskinesia.
Evaluation of regional wall motion was done by 2 independent researchers. The opinion of a third researcher was called upon to resolve disagreements.
Intramyocardial Contrast Echocardiography
All patients underwent real time myocardial contrast echocardiography 48 hours after the onset of symptoms. The 48 hour delay was employed because prior to this hyperemia can cause hemodynamic changes.12,13
We used Sonovue® contrast agent, a suspension of micro-bubbles whose active product is sulphur hexafluoride, an innocuous gas eliminated through the respiratory system. The product is presented in the form of particles that activate when added to a saline solution and shaken vigorously for 30 seconds. Administration of the contrast agent was by continuous infusion using a specially designed perfusion pump that continually shakes the product to ensure its efficacy. The dose administered varied from 0.8 to 1.2 mL/m (depending on body surface) until the myocardial segments were suitably opaque. No adverse effects occurred in connection with use of the contrast agent.
All patients were informed of the protocol and gave their consent prior to inclusion in the study.
Perfusion Echocardiography
Perfusion was measured in real time using the Power modulation method that has previously been demonstrated to be a valid means of detecting myocardial perfusion.14,15
The imaging protocol includes 20 consecutive cycles after the activation of an impulse of 5-10 high mechanical index cycles. Imaging starts after the flash, when the myocardial bubbles have been destroyed, in order to measure the myocardium filling with micro-bubbles.
Quantitative Evaluation of Perfusion
Off-line quantitative analysis of perfusion was performed by 2 independent researchers, experienced in contrast echocardiography using Q-Lab software.
Measurement (Figure 1) involved a series of steps: first, the area of the myocardium was selected in the apical 2- and 4-chamber views (using a manual trace). Second, an automatic selection was made of all of frames corresponding to the same cycle (end-systole) for 20 beats. From this selection, the Q-Lab software provided 3 parametric images corresponding to color maps that represent the various parameters studied, and a fourth image for quality control. In the first 3 maps, the A parameters (plateau), β (velocity of myocardial filling by the micro-bubbles) and Axβ, are represented by a scale of colors at each point on the myocardium. The colors show the degree of perfusion: green = normal, yellow = reduced, and red = absence of perfusion. The fourth image gives information about data quality at each point. The great advantage of this measurement procedure is that it avoids measuring zones where quality is inadequate.
Qualitative Evaluation of Perfusion
Qualitative analysis of perfusion in akinetic segments was performed by 2 independent observers with a third called to settle any disagreement. Measurements were classified as normal or abnormal. Abnormal was defined as when the segment presented absence of perfusion or patchy (heterogeneous) perfusion; normal was defined as when perfusion was complete (homogeneous).
Follow-up
All patients underwent coronary angiography and standard echocardiography at 6 months post-revascularization.
Interobserver and Intraobserver Analysis
We randomly selected 20 studies for analysis on different days by the same observer to determine intraobserver variability. These studies were also analyzed by an independent observer to determine interobserver agreement. Both investigators were blinded to the results of analysis prior to the studies.
Statistical Analysis
Statistical analysis was performed with SPSS 11.0. Quantitative variables were analyzed as mean ± standard deviation and qualitative variables as percentages.
To study the association between 2 quantitative variables we used the intraclass correlation coefficient. Reproducibility was considered almost perfect if the coefficient was between 0.81 and 1.0. We constructed ROC curves to determine the optimal cutoff point using the prevalence of the sample of patients in the study with equal weight given to false positives and false negatives. The cutoff point chosen was that which in each case maximized the percentage of correct classifications. Statistical significance was defined as P<.05.
RESULTS
Baseline Characteristics
We excluded 9 of the 58 patients enrolled due to poor acoustic window (3), acute coronary syndrome during follow-up (2) and significant restenosis of the culprit artery (4), leaving 49 in the study group.
Mean age was 62.3±14.5 years and 39 (79.6%) patients were men. Mean time to catheterization was 5.6±2 hours following onset of symptoms. Post-infarction ejection fraction was 46±2. Post-AMI regional wall-motion score index was 2.6±1.2. Patients' baseline characteristics are shown in Table 1.

Quantitative Analysis of Akinetic Segments
Baseline analysis of regional wall motion detected 170 akinetic segments of which 105 (62.1%) had recovered function at 6-month follow-up. At 6 months, ejection fraction was 48±9 and regional wall-motion index was 2.1±0.9. Results of parametric imaging-based quantitative evaluation of akinetic segments appear in Table 2. Comparison of 2 groups (with and without functional recovery of akinetic segments) shows a statistically significant difference.

Qualitative Analysis of Akinetic Segments
Results of qualitative analysis were: sensitivity 81%, specificity 79.7%, positive predictive value 86.7% and negative predictive value 71.8% (Table 3).

Intraobserver and Interobserver Variability
Analysis of A, β, and Axβ indicated good interobserver reproducibility. Intraclass coefficient correlations were 0.82, 0.9, and 0.85 for A, β and Axβ, respectively. Intraobserver reproducibility was also good: 0.9, 0.9, and 0.8 for A, β, and Axβ, respectively.
Relationship Between Quantitative Analysis of Myocardial Perfusion and Functional Recovery of Akinetic Segments
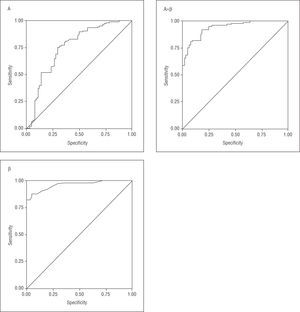
We constructed ROC curves to determine the validity of the different parameters in predicting functional recovery of akinetic segments (Figure 2). Table 3 shows that measuring β was the best parameter to predict recovery of regional wall motion. The area under the ROC curve for β was 0.96 (confidence interval [CI] 95%, 0.92-0.99) for a cutoff point of 31 s1, sensibility was 87.6%, specificity 95.3%, positive predictive value 96.8%, and negative predictive value 82.4%.

Figure 2. ROC curves of the different quantitative parameters obtained with parametric imaging (A, β, and Axβ) in the prediction of functional recovery of akinetic segments at 6 months.
DISCUSSION
The objective of primary angioplasty is to restore flow in the infarction-related artery, limit the area of necrosis and preserve contractile function.
How much myocardium is saved heavily depends on blood flow in the area at risk. In fact, permeability of the myocardial artery is not synonymous with normal microcirculation flow and different degrees of microvascular dysfunction may exist, such as no-reflow or limited reflow. In fact, microvascular dysfunction in the area at risk is an independent predictor of remodeling and worse long-term clinical evolution.16
Standard echocardiography comes first in the functional study of affected segments as it enables us to evaluate wall motion and thickness. Improved detection of boundaries thanks to harmonic imaging and, sometimes, the addition of a contrast agent, usually leads to correct evaluation of global and regional left ventricular function. However, standard echocardiography cannot be used to identify the pathophysiological mechanism of segments that remain akinetic. Moreover, in the presence of myocardial stunning, functional recovery can require days or weeks.17 Distinguishing between stunning and necrosis is relevant to management of patients with severe systolic dysfunction or cardiogenic shock following revascularization.
Myocardial contrast echocardiography has proved a useful technique in the study of coronary microcirculation in patients with AMI and is a valuable tool to predict functional recovery of akinetic segments.18,19
Given that the contrast agent is a pure, intravascular tracer, techniques for measuring blood volume, blood flow and recirculation velocity have been developed. The application of these permits a more objective and more easily reproducible evaluation of degree of perfusion. Finally, parametric imaging has become a new method of obtaining quantitative images of microcirculation flow.20
Our results on the value of MCE to predict functional recovery of akinetic segments in patients with AMI coincide with those reported elsewhere.7,8-20 However, to our knowledge this is the first study of perfusion with quantification of myocardial flow in this group of patients.
The value of our study design is that:
1. Real-time imaging has demonstrated itself a valid means of detecting perfusion and is technically simple, meaning it can be employed by less well-trained personnel.
2. The use of an infusion pump specially designed for the contrast agent used a) assures optimal performance of the agent which, as it is permanently shaken, maintains its echogenic properties over the period of the study, and b) maintains a constant perfusion index, which is especially relevant in quantifying degree of perfusion.21
3. A quantitative method provides a more reproducible evaluation.
4. Parametric imaging-based quantification (Q-Lab software) detects possible zones of error or artifact where quantitative measurement is inappropriate.
Our results (Table 3) show a high predictive value for functional recovery based on the parameters derived from measurement. However, measurement of β was the best predictor, with a positive predictive value of 96.8% and a negative predictive value of 74.4%. Our study shows quantitative measurement leads to more precise diagnosis than qualitative analysis.
In our research, the perfusion study was performed 48 hours after angioplasty as dynamic changes may occur in the first hours post-reperfusion due to:
1. Hyperemia following permeabilization of the artery responsible which could lead to an overestimation of the degree of perfusion in the segment analyzed.
2. Presence of thrombus and embolization of platelets in the microcirculation that provoke limited reflow.
3. Extension of the area of no-reflow due to accumulation of neutrophils and capillary thrombosis in the course of reperfusion.
4. Intramyocardial bleeding due to microvascular damage.22
Sakuma et al23 showed the optimal time for a perfusion study following AMI is 1 day post-recanalization.23 Balcells et al8 found that perfusion measured 3-5 days post-angioplasty gave results almost identical to those found in the chronic phase.
After follow-up coronary angiography performed 6 months following discharge, we excluded 4 patients who presented restenosis reducing the final sample to 49 patients without significant lesion in the vessel responsible. Consequently, we can affirm that the lack of functional recovery of segments that remained akinetic was not related to a new, significant epicardial lesion.
Clinical Implications
Myocardial contrast echocardiography is a simple, feasible, low cost technique that can be used in the first days post-AMI. This is especially important in patients with severely depressed systolic function as confirmation of necrosis in akinetic segments could lead to the use of certain therapies, such as automatic defibrillator implantation, prior to discharge. This would not even be considered in patients with a high probability of functional recovery.
CONCLUSIONS
Measurement of myocardial perfusion by contrast echocardiography and parametric imaging permits us to predict functional recovery of akinetic segments after myocardial infarction. The technique is more sensitive and specific than the traditional, quantitative evaluation of myocardial perfusion.
Limitations
After completion of our study and at the time of writing, the use of Sonoveu® has been contraindicated in patients with recent acute coronary syndrome or unstable ischemic heart disease, including evolving myocardial infarction, typical at-rest angina in the previous 7 days, significant worsening of cardiac symptoms in the previous 7 days, recent coronary intervention, or other factors suggesting clinical instability (e.g. recent deterioration of electrocardiographic, laboratory or clinical findings), functional class III/IV acute heart failure or severe arrhythmias. However, we believe our results can be extrapolated to the use of other second generation contrast agents.
Correspondence: Dr. J. Zamorano.
Laboratorio de Ecocardiografía. Instituto Cardiovascular.
Hospital Clínico San Carlos.
Profesor Martín Lagos, s/n. 28040 Madrid. España.
E-mail: jlzamorano@vodafone.es