Keywords
INTRODUCTION
Hypertrophic cardiomyopathy is a genetic disease of autosomal dominant transmission.1 Offspring of affected individuals have a 50% chance of developing the disease, which affects the cardiac sarcomere and is characterized by the presence of primary ventricular hypertrophy, although clinical expression and disease course may vary.2,3 Genetic studies would be able to identify individuals in danger of developing the disease and so might be useful for stratifying risk of adverse cardiac events,4 thus identifying the population in need of different treatments.5-7
In the general population, the disease has a prevalence of 0.2% and is the most common cause of syncope and/or cardiac sudden death in patients under 30 years old, including those who practice sports. Annual mortality of those with the condition is 1%, but it can be as high as 6% during infancy and adolescence, when sudden death may be the first symptom of the disease.8
Diagnosis is usually made when ventricular hypertrophy that cannot be accounted for by systemic disease or heart disease is found in the echocardiogram. Myocardial hypertrophy usually develops during puberty and appears less often in older subjects.9 In addition, phenotypic expression of the disease may vary according to site and extent of hypertrophy and, in some carriers, severe myofibrillar abnormalities are observed with minimal hypertrophy.
When the disease is associated with substantial ventricular hypertrophy, diagnosis is easy, but when the echocardiogram and Doppler studies of the mitral and tricuspid valves show no abnormalities, the presence of diastolic dysfunction in Doppler tissue imaging (DTI) could precede clinical manifestation of the disease.10
The objective of this study was to assess regional myocardial function by DTI in first-degree relatives of patients with familial hypertrophic cardiomyopathy (FHC) in order to detect early abnormalities.
PATIENTS AND METHODS
Population
First-degree relatives (parents, siblings, and offspring) of patients with hypertrophic cardiomyopathy were screened in the clinic dealing with hypertrophic cardiomyopathy. Eighteen families with FHC with at least 2 first-degree relatives affected were documented between March 2002 and August 20043 (Figure 1).

Figure 1. Flow diagram of the study population. HC indicates hypertrophic cardiomyopathy.
All members of the families included in the study underwent clinical examination, laboratory analysis, electrocardiogram (ECG), chest x-ray, cardiac echo-Doppler evaluation, and DTI. Forty-seven first-degree relatives of these patients were studied, comprising Group 1, with a mean±SD age of 18±8 years (6 to 36 years) and 24 women. This group was compared with 47 health volunteers (20 of whom were women), who comprised Group 2, with a mean age of 19±6 years (6 to 35 years). All subjects studied were asymptomatic, were not taking any cardiovascular medication, and had normal findings in the physical examination and the battery of diagnostic tests.
The first-degree relatives (Group 1) were divided into 2 subgroups according to whether regional diastolic function was abnormal or not.
Patients were excluded from either group if they were obese, practiced competitive sports, had an anatomy that hindered echocardiography, were aged over 36 years, or had concurrent diseases that could cause ventricular hypertrophy or diastolic abnormalities (arterial hypertension, pulmonary hypertension, coronary artery disease, valve disease, cardiomyopathy, peripheral vascular disease, congenital heart disease, or systemic disease).
Control Group
The control group (Group 2) comprised 47 untrained healthy volunteers who were not blood relations (for example, spouses) of the families studied. All had normal findings in the clinical examination, laboratory tests, ECG, and echocardiogram.
Echocardiogram
Two-dimensional echocardiography with a Hewlett-Packard Sonos 1000 imaging system equipped with a 2.5 MHz transducer was used to rule out right and left ventricular (LV) hypertrophy. Long-axis and left short-axis parasternal views of the right ventricular (RV) inflow tract, and apical 4- and 2-chamber and subcostal 4-chamber views were used in the examination. Level 1 of the echocardiogram in mode M was set with the left short-axis parasternal view and used to determine the chamber sizes (during diastole and systole), the diastolic thickness of the septum and the LV posterior wall, and the shortening fraction, according to published guidelines.11
Pulsed Doppler Imaging of Blood Flow
Immediately after recording the 2-dimensional echocardiogram, pulsed Doppler images of blood flow were taken with the ATL Ultramark 8 device, equipped with a 2.5 MHz transducer.
To assess overall LV and RV diastolic function, conventional pulsed Doppler scans sampled the mitral and tricuspid valve leaflet tips to obtain typical spectral curves of LV and RV filling.
The peak velocities during rapid filling (E) and atrial contraction (A) were measured in cm/s. The deceleration time of rapid filling was measured in milliseconds.
Overall diastolic dysfunction of the left and right ventricles was defined as the presence of any abnormality in mitral or tricuspid flow, respectively. Three grades of diastolic dysfunction were defined, according to the presence of a prolonged relaxation pattern, a pseudonormal pattern, or a restrictive pattern.12
Pulsed Doppler Tissue Imaging
Doppler tissue imaging was done with an ATL Ultramark 8 device, equipped with a 2.5 MHz transducer.
The cursor was aligned as parallel as possible to the myocardial segment analyzed and the controls were optimized.13 The Doppler sampling volume was extended to 10 mm, the Nyquist limit was decreased to between 20 cm/s and 30 cm/s, and the smallest possible filter, the lowest possible amplification, the highest discrimination, and the highest sweep velocity (50 mm/s) possible were used.
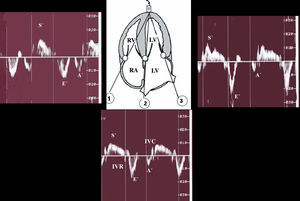
Regional systolic function was quantified for both ventricles with a 4-chamber apical view, and the Doppler sampling volume was set at the basal segment of the ventricular septum and at the free walls of both ventricles (Figure 2).

Figure 2. Doppler tissue imaging: methodology. A' indicates atrial systole; E', rapid ventricular filling; S', systolic contraction; IVC, isovolumetric contraction; IVR, isovolumetric relaxation; RA, right atrium; LA, left atrium. 1) Tricuspid annulus; 2) basal ventricular septum; 3) mitral annulus.
Peak velocities during systole (S'), early diastole (E'), and late diastole (A') were measured in cm/s and the isovolumetric contraction (IVC) and relaxation (IVR) were measured in seconds and corrected for heart rate according to the formula IVC/(check)RR and IVR/(check)RR, respectively.
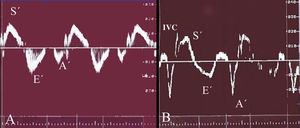
Tissue relaxation was considered normal when E'/A' was greater than 1 and prolonged when E'/A' was less than 1 (Figure 3).14-16

Figure 3. Doppler tissue imaging: definition of normal and prolonged ventricular relaxation pattern. A) Normal Doppler tissue image of the right ventricle; B) 19-year-old man without ventricular hypertrophy from family 9, with 2 first-degree relatives affected by hypertrophic cardiomyopathy, and a prolonged relaxation pattern in the right ventricle. A' indicates atrial systole; E', rapid ventricular filling; S', systolic contraction; IVC, isovolumetric contraction.
Averages over 3 consecutive beats were taken to minimize variations in measurements with breathing cycles.
The studies of the first 20 subjects in Group 1 were recorded on video and analyzed by the same observer on 2 occasions, and by a third investigator independently to assess intra- and interobserver agreement.
Statistical Analysis
Quantitative data were expressed as means±SD. Intraclass correlation coefficients were determined by ANOVA for repeated measurements having previously done the necessary parametric tests for independence, normality, and homoscedasticity.
Intraobserver agreement was determined for 20 subjects for 2 measurements and the interobserver agreement was evaluated using the average of the intraobserver measurements and an interobserver measurement.
Three-way comparisons were done by ANOVA after applying the necessary parametric tests. The Tukey multiple comparison test was done a posteriori.
P values below .05 were considered statistically significant.
These statistical analyses were done with the Software Package for Social Sciences (SPSS Inc, version 11.01) for Windows.
RESULTS
All the morphological variants of distribution of hypertrophy were found among members of the 18 families with FHC (Table 1).

The echocardiographic characteristics of the subjects studied are shown in Table 2

No statistically significant differences between the 2 groups were seen for left atrial size or for LV thickness.
All subjects in the control group (Group 2) had a normal regional ventricular relaxation pattern in DTI (Figure 3A). However, 10 of the 47 (21.3%) first-degree relatives of patients with FHC (Group 1) had regional diastolic dysfunction in the Doppler examination, characterized by a prolonged relaxation pattern (Figure 3B). Two of these subjects (4.3%) also showed similar findings in the ventricular septum.
In accordance with these findings, the study group was divided into 2 subgroups: Group 1a, which included subjects with a normal relaxation pattern in DTI of the RV free wall and, therefore, with normal diastolic function, and Group 1b, which included those with prolonged relaxation pattern in the RV free wall, that is, with regional diastolic dysfunction. Thus, 3 groups were defined for subsequent analysis (Tables 3 and 4): Group 1a (first-degree relatives with normal relaxation), Group 1b (first-degree relatives with prolonged relaxation), and Group 2 (control).


The echocardiographic findings of the 3 subgroups of the study are shown in Table 3. Of note is that the diastolic and systolic LV sizes in Group 1b were normal, although smaller than in Group 2 (P<.001). A larger shortening fraction was also seen in Group 1b (P<.007). Overall diastolic function of both ventricles in all groups was also normal, but a larger peak mitral flow velocity A (59±13 cm/s; P<.001) and peak tricuspid flow velocity (44±7 cm/s; P<.001) were observed in Group 1b, with a smaller E/A ratio in both ventricles (1.43±0.4; P<.001, for the left ventricle; and 1.20±0.2; P<.07, for the right ventricle).
The findings from DTI for the 3 study groups are shown in Table 4. There were no statistically differences between Group 1a and Group 2. However, subjects in Group 1b had abnormal regional myocardial function. In this group, more parameters were significantly affected in the right ventricle compared to the ventricular septum and in the LV free wall:
1. In Group 1b, the corrected IVR of the RV free wall was prolonged (37.5±25) compared to Group 2 (19.9±23; P<.01) and Group 1a (23.7±28; P<.03), peak velocity A' was higher (17.8±3 cm/s) compared to Group 2 (9.3±2.6 cm/s; P<.001) and Group 1a (9.4±1,9 cm/s; P<.001), and peak velocity E' was lower (12.4±2.5 cm/s) compared to Group 2 (16.7±3.6 cm/s; P<.001) and Group 1a (16.4±3.1 cm/s; P<.003). The velocity S' and corrected IVC did not show significant variations.
2. In the ventricular septum, Group 1b showed increased peak velocity A' (8.5±2.4 cm/s) compared to Group 2 (7.2±1.4 cm/s; P<.02) and Group 1a (6.8±1.3; P<.006) and decreased E'/A' (1.57±0.49) compared to Group 2 (2.03±0.53; P<.01) and Group 1a (2.07±0.41; P<.01). Peak velocity S' was lower (9.9±1.5 cm/s) than in Group 2 (12.4±1.03 cm/s; P<.05). The peak velocity E' and the corrected IVC and relaxation times showed no significant variations.
3. In the LV free wall, Group 1b only showed increased peak velocity A' (10.8±2.7 cm/s) compared to Group 2 (7.6±1.9 cm/s; P<.0001) or to Group 1a (8.4±1.9; P<.004).
Intra- and Interobserver Agreement in Doppler Tissue Imaging Measurements
The intraobserver agreement measured by the intraclass correlation coefficient ranged from 0.995 for the velocity variables in both ventricles to 0.882 for the time variables. The interobserver agreement ranged from 0.993 for the velocity variables to 0.832 for the time variables.
DISCUSSION
For the first time, our study among first-degree relatives of patients with FHC has demonstrated that DTI can reveal the presence of a subgroup of patients (21.3%) with no phenotypic expression of the disease who show abnormal regional RV diastolic function. These abnormalities could be an early sign of FHC.
Recent findings17-19 have suggested that LV DTI of young relatives of FHC patients could be useful for preclinical diagnosis of the disease. The regional myocardial (systolic and diastolic) velocities are abnormally low in patients with genetic mutations (positive genotype) before LV hypertrophy occurs (positive phenotype). However, up until present, regional RV myocardial function had not been assessed in these patients.
In this study, 10 of the 47 first-degree relatives of patients with FHC (21.3%) had abnormal regional RV relaxation not attributable to age. Such abnormalities could be an early marker of a compromised myocardium. This regional RV diastolic dysfunction is characterized by decreased peak velocity E' and lower E'/A', with an increase in peak velocity A and longer corrected IVR. Moreover, 2 subjects had a prolonged relaxation pattern in the DTI of the ventricular septum. The echocardiographic findings and those of DTI of mitral flow were normal, but with smaller chamber sizes and a greater ventricular wall motion.
These early changes in subjects without ventricular hypertrophy who were related to patients with hypertrophic cardiomyopathy could be attributed to the orientation of the longitudinal fibers and the low preload of the right ventricle, which would make it more sensitive than the left ventricle. Longitudinal fibers are found in the subendocardium and subepicardium of the right ventricle, whereas the myocardium has circumferential fibers. Longitudinal fibers can be assessed in apical views with DTI and the circumferential ones in parasternal views with the shortening fraction.
Tabata et al20 observed that patients with hypertrophic cardiomyopathy initially showed deteriorated motion of longitudinal fibers, which are more vulnerable to pathological changes, with a compensatory increase in the function of circumferential fibers. This may explain why we found regional diastolic dysfunction along the longitudinal axis whereas RV wall motion was conserved.
Several authors showed that hypertrophic cardiomyopathy affects the right ventricle much more often than is reported in daily practice,21,22 with between 44% and 62% of those with LV hypertrophy also suffering from RV hypertrophy.
Doppler tissue imaging is a particularly useful tool for assessing these alterations because it allows regional RV function to be assessed13 and can detect abnormalities before ventricular hypertrophy develops. Parameters most often determined are IVR (which reflects active relaxation with energy consumption) and E'/A'. E'/A' is not influenced by preload, and so a value less than 1 in the DTI indicates greater diastolic dysfunction than E/A (tricuspid valve) less than 1.23
Active RV relaxation is short or absent in healthy subjects. It has been reported that the right ventricle and left ventricle differ in that diastolic filling starts in the right ventricle without an isovolumetric period because it is working against a low postload.24 Isovolumetric relaxation is prolonged in all diseases with RV involvement due to the increase in postload or due to the presence of intrinsic myocardial dysfunction.25,26 In our study, significant prolongation of the IVR in the right ventricle was found in Group 1b, which could be an early marker of regional myocardial damage.
Doppler tissue imaging in healthy young people shows higher regional myocardial velocities in the right ventricle than in the left ventricle. The physiological deterioration of diastolic function with age and increased atrial function seem a mechanism common to both ventricles. Analysis of several studies22-30 that used DTI to investigate different age groups of healthy subjects showed that there is a progressive decrease in early diastolic velocity (E') in the right ventricle with a compensatory increase in atrial function from 36 years onwards. Such a decrease occurs approximately a decade later in the left ventricle, suggesting that ventricular relaxation abnormalities appear earlier in the right ventricle than in the left ventricle. When defining the groups of this study, it was decided to set a maximum age limit of 36 years because evidence from a number of studies14,31 suggests that RV relaxation disorders are a common physiological phenomenon in healthy subjects from this age onwards.
Although a genetic study is a valuable approach for identifying patients at risk of developing hypertrophic cardiomyopathy, its clinical use is limited by variable penetrance and expression, the low frequency of each mutation, nongenetic factors,4 and by technical and economic difficulties of genetic typing of hypertrophic cardiomyopathy. Thus, DTI could be used to improve identification of silent carriers, particularly in those with a family history of the disease.
On the other hand, several authors32-37 have demonstrated the usefulness of DTI in assessing systolic and diastolic function in many clinical situations. We therefore believe that the technique could be of great help as a complement for genetic studies and in echocardiographic screening of relatives of patients with hypertrophic cardiomyopathy,9,38 given that it would allow early identification of patients who will later develop the disease. Measures could then be taken to prevent the appearance of symptoms that could be life-threatening.39
The clinical significance of these findings remains uncertain, as we do not know whether this subgroup of patients is at greater risk of sudden death. However, evidence suggests that relatives of patients with FHC in whom DTI abnormalities have been detected are at greater risk of developing clinical hypertrophic cardiomyopathy.39
Limitations of the Study
The present study was done in young subjects under 36 years of age with no concomitant diseases. Given that velocities recorded in DTI decrease with age, the technique might be of limited use in elder subjects, and so a follow-up study should include an older population with associated heart disease (hypertension, coronary artery disease, valve diseases, and pericardial diseases) in order to determine whether age really is a limitation.
Another limitation is the lack of clinical follow-up. This is a preliminary study, but it will be complemented with long-term follow-up to determine whether subjects with early diastolic abnormalities go on to develop RV hypertrophy.
Despite the small number of patients included, the interest in the study lies in the possibility of finding new tools that allow early diagnosis of hypertrophic cardiomyopathy.
CONCLUSIONS
Doppler tissue imaging of the RV free wall is a simple noninvasive method for identifying a subgroup of subjects with early regional diastolic dysfunction in first-degree relatives of patients with FHC. Abnormal function could be a preclinical marker of the disease and, in the future, could allow the implementation of measures aimed at preventing the disease or its symptoms from appearing.
Correspondence: Dra. M.C. Saccheri.
Consultorio de Miocardiopatías Hipertróficas. División Cardiología.
Hospital del GCBA Dr. Cosme Argerich.
Raúl Scalabrini Ortiz, 3305, 14.° A. C1425DCB Ciudad Autónoma
de Buenos Aires. Argentina.
E-mail: mcsaccheri@fibertel.com.ar
Received December 21, 2004.
Accepted for publication October 18, 2005.