To assess the validity of the original low-risk SCORE function without and with high-density lipoprotein cholesterol and SCORE calibrated to the Spanish population.
MethodsPooled analysis with individual data from 12 Spanish population-based cohort studies. We included 30 919 individuals aged 40 to 64 years with no history of cardiovascular disease at baseline, who were followed up for 10 years for the causes of death included in the SCORE project. The validity of the risk functions was analyzed with the area under the ROC curve (discrimination) and the Hosmer-Lemeshow test (calibration), respectively.
ResultsFollow-up comprised 286 105 persons/y. Ten-year cardiovascular mortality was 0.6%. The ratio between estimated/observed cases ranged from 9.1, 6.5, and 9.1 in men and 3.3, 1.3, and 1.9 in women with original low-risk SCORE risk function without and with high-density lipoprotein cholesterol and calibrated SCORE, respectively; differences were statistically significant with the Hosmer-Lemeshow test between predicted and observed mortality with SCORE (P < .001 in both sexes and with all functions). The area under the ROC curve with the original SCORE was 0.68 in men and 0.69 in women.
ConclusionsAll versions of the SCORE functions available in Spain significantly overestimate the cardiovascular mortality observed in the Spanish population. Despite the acceptable discrimination capacity, prediction of the number of fatal cardiovascular events (calibration) was significantly inaccurate.
Keywords
Any tool that helps to prevent cardiovascular diseases is welcome because these conditions are still the main cause of death in Spain, with little change in their incidence in the last 30 years.1,2 Primary prevention identifies populations at high risk of cardiovascular disease to enable at-risk individuals to be treated with intensive measures–both pharmacological and lifestyle–that reduce and delay the incidence of cardiovascular disease.3 Risk functions have been designed to estimate global coronary risk and have improved upon the simple individual approach of cardiovascular risk factors. These instruments were developed from cohort studies with follow-up durations of 10 or more years and enable estimation of the risk of coronary disease development during this period.4
The SCORE (Systematic COronary Risk Evaluation) function, recommended in the European and Spanish guidelines,3,5–7 calculates the 10-year risk of cardiovascular death. Developed using European cohorts, there is an original version differentiated for high-risk and low-risk countries (SCORE-LOW),5 another original version that includes the total cholesterol/high-density lipoprotein cholesterol ratio (SCORE-LOW-HDL), and a version calibrated for use in the Spanish population (SCORE-C).8 The latter 2 versions are available online at HeartScore.9 The performance of these 3 versions of the SCORE function have not been evaluated in a Spanish population cohort.
The aim of the present study was to analyze the validity of the 3 SCORE functions recommended in Spain by comparing their predictions with the 10-year rate of fatal cardiovascular disease observed in a general Spanish population cohort.
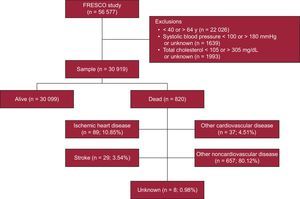
METHODSDesign and ParticipantsThe present study involved pooled analysis of individual data from 12 population-based Spanish cohort studies performed from 1991onward 10 and with follow-up until 2005 aggregated in the FRESCO study11 (). All cohort participants were randomly selected, were aged between 35 and 79 years, had no cardiovascular disease at the start of follow-up, and had signed an informed consent form. The FRESCO study was authorized by the Ethics Committee of the Parc de Salut Mar, Barcelona (2009/3391/I).
MeasuresAge, sex, and the other risk factors considered in the SCORE functions (smoking, systolic blood pressure, total cholesterol, and high-density lipoprotein cholesterol [HDL-C]) were known for all cohorts and had been collected using the standardized methodology recommended by the World Health Organization.10 Participants were classified as smokers (if they were smoking at the time of examination or had quit smoking ≤ 1 year previously) or nonsmokers (exsmokers since > 1 year previously or never smoked). Systolic and diastolic blood pressure readings were determined via the mean of 2 determinations obtained at least 5minutes apart. Analytical determinations were performed after participants fasted for 10 to 14hours. Diabetes mellitus diagnosis was established from a previous diagnosis or a baseline blood glucose level > 125mg/dL. In 9 of the 12 cohorts, a concordance study of total cholesterol and HDL-C was performed, with satisfactory results.12 The present validation assessment specifically considered the population for whom the SCORE function was designed: age 40 to 64 years, systolic blood pressure ≥ 100 and ≤ 180mmHg, and total cholesterol ≥ 105mg/dL (3 mmol/L) or ≤ 305mg/dL (8 mmol/L) (Figure 1).

Participant follow-up was at least 10 years for the following fatal cardiovascular disease codes of the ICD-9 (International Classification of Diseases, Ninth Edition), or their equivalents in the 10th revision, considered in the SCORE function5: from 401 to 414 and from 426 to 443, excluding 426.7, 429.0, 430.0, 432.1, 437.3, 437.4, and 437.5. In addition, death from cardiovascular causes5 was classified according to the following ICD-9 codes: 798.1 (instantaneous death) and 798.2 (sudden death occurring less than 24hours after symptom onset). Cause of death was ascertained from medical records, hospital discharge sheets, and the national death registry and that of each autonomous community.
Statistical AnalysisAnalyses were stratified by sex. Continuous variables are reported as mean ± standard deviation and categorical variables as proportions. Overall mortality rates and those according to cause (cardiovascular, noncardiovascular) were estimated using Kaplan-Meier analysis.
The 10-year risk of cardiovascular death was estimated with the SCORE-LOW function with Weibull model coefficients.5 The risk was also estimated with the SCORE-LOW-HDL and SCORE-C functions8 using the HeartScore calculator of the European Society of Cardiology9 because their coefficients are no longer published.7 The free software AutoIt13 was used to automatically add to the corresponding field of the calculator the values of the variables–sex, age, smoking, systolic blood pressure, total cholesterol, and HDL-C (when necessary)–taken from the database. The same program captured the risk estimated by the calculator for the SCORE-LOW-HDL and SCORE-C functions and incorporated this value into the database.
To validate the functions, the observed-to-expected mortality ratio was first estimated with each of the 3 risk functions. To determine the reliability of the SCORE-LOW function,5 its discrimination capacity was analyzed using the area under the ROC (receiver operating characteristic) curve.14 Accuracy was evaluated via a comparison of the risks observed in the cohort and those estimated by the SCORE functions using the Hosmer-Lemeshow test modified for cohort studies with SCORE-LOW risk sextiles (calibration).15 No ROC curves could be evaluated for the SCORE-LOW-HDL and SCORE-C because the HeartScore calculator rounds risk figures to whole numbers.9 Nonetheless, the calibration was analyzed by comparing the observed events and those predicted with 3 whole cutoff points (1%, 2%, and 3%).
The risk estimated with the 3 functions was multiplied by 3 and 5 in men and women with diabetes, respectively, according to the indications of the most recent clinical practice guidelines of the European Society of Cardiology.3 In addition, in a sensitivity analysis, the cardiovascular risk estimated with the SCORE-LOW function was multiplied by 2 and 4 in men and women with diabetes, respectively, as indicated in the reference publication.5
The population distribution was calculated in 4 risk groups defined by 1%, 5%, and 10% cutoff points with the 3 versions of the SCORE function and the percentage of cardiovascular deaths observed in each group.
All analyses were performed using R statistical software version 2.10 (R Foundation for Statistical Computing, Vienna, Austria).
RESULTSOf the 56 577 participants in the FRESCO study, 22 026 were excluded for being younger than 40 years or older than 64 years, as well as 3632 for having systolic blood pressure and total cholesterol values outside of the range considered by SCORE. Finally, 30 919 individuals were included in the validation (Figure 1). The median follow-up time was 10.0 years, with a total of 286 105 persons/y. The 10-year mortality rate was 3.0% for all-cause death but was 0.6% for the cardiovascular causes included in the SCORE function. The cause of death was unknown in 8 participants (0.98%).
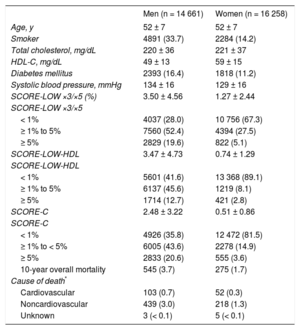
The participants’ characteristics by sex are detailed in Table. The cardiovascular risk profile was more unfavorable in men. The mean risk calculated with the 3 functions was always higher in men than in women, as well as the percentage of men classified in the high-risk group (≥ 5%). SCORE-LOW-HDL classified the fewest people in the high-risk group (≥ 5%) (12.7% of men and 2.8% of women). The ratio between estimated/observed cases was 9.1, 6.5, and 9.1 in men and 3.3, 1.3, and 1.9 in women with the SCORE-LOW, SCORE-LOW-HDL, and SCORE-C functions, respectively.
Participants’ Baseline Characteristics, Cardiovascular Risk Estimated With the SCORE-LOW, SCORE-LOW-HDL, and SCORE-C Functions (Risk Multiplied by 3 and 5 in Men and Women, Respectively), and Outcome Variables Stratified by Sex
| Men (n = 14 661) | Women (n = 16 258) | |
|---|---|---|
| Age, y | 52 ± 7 | 52 ± 7 |
| Smoker | 4891 (33.7) | 2284 (14.2) |
| Total cholesterol, mg/dL | 220 ± 36 | 221 ± 37 |
| HDL-C, mg/dL | 49 ± 13 | 59 ± 15 |
| Diabetes mellitus | 2393 (16.4) | 1818 (11.2) |
| Systolic blood pressure, mmHg | 134 ± 16 | 129 ± 16 |
| SCORE-LOW ×3/×5 (%) | 3.50 ± 4.56 | 1.27 ± 2.44 |
| SCORE-LOW ×3/×5 | ||
| < 1% | 4037 (28.0) | 10 756 (67.3) |
| ≥ 1% to 5% | 7560 (52.4) | 4394 (27.5) |
| ≥ 5% | 2829 (19.6) | 822 (5.1) |
| SCORE-LOW-HDL | 3.47 ± 4.73 | 0.74 ± 1.29 |
| SCORE-LOW-HDL | ||
| < 1% | 5601 (41.6) | 13 368 (89.1) |
| ≥ 1% to 5% | 6137 (45.6) | 1219 (8.1) |
| ≥ 5% | 1714 (12.7) | 421 (2.8) |
| SCORE-C | 2.48 ± 3.22 | 0.51 ± 0.86 |
| SCORE-C | ||
| < 1% | 4926 (35.8) | 12 472 (81.5) |
| ≥ 1% to < 5% | 6005 (43.6) | 2278 (14.9) |
| ≥ 5% | 2833 (20.6) | 555 (3.6) |
| 10-year overall mortality | 545 (3.7) | 275 (1.7) |
| Cause of death* | ||
| Cardiovascular | 103 (0.7) | 52 (0.3) |
| Noncardiovascular | 439 (3.0) | 218 (1.3) |
| Unknown | 3 (< 0.1) | 5 (< 0.1) |
HDL-C, high-density lipoprotein cholesterol; SCORE-C, calibrated Systematic COronary Risk Evaluation; SCORE-LOW, original low-risk Systematic COronary Risk Evaluation; SCORE-LOW-HDL, original low-risk Systematic COronary Risk Evaluation with HDL-C.
Unless otherwise indicated, the data represent No. (%) or mean ± standard deviation.
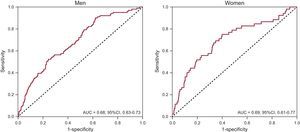
The discrimination capacity of the original SCORE function is shown in Figure 2. The area under the ROC curve was 0.68 in men and 0.69 in women.

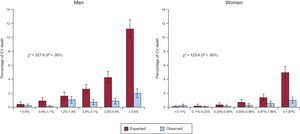
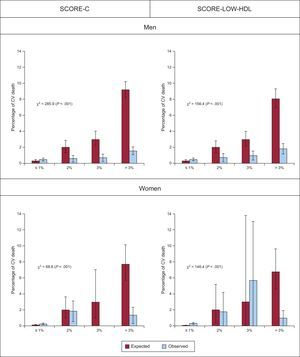
The accuracies of the SCORE-LOW function estimates are presented in Figure 3. Both sexes showed significant differences between the percentages of observed and estimated deaths in the risk sextiles. There were also significant differences for both sexes among the 4 risk groups analyzed with the SCORE-C and SCORE-LOW-HDL functions (Figure 4).


Calibration according to risk group for CV death of the SCORE-C and SCORE-LOW-HDL functions. Error bars indicate the 95% confidence interval. The risk is multiplied by 3 and 5 in men and women with diabetes, respectively. CV, cardiovascular; SCORE-C, calibrated Systematic COronary Risk Evaluation; SCORE-LOW-HDL, original low-risk Systematic COronary Risk Evaluation with high-density lipoprotein cholesterol.
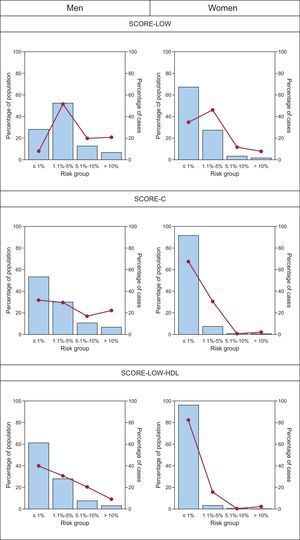
The percentage of cohort participants included in the 4 risk groups and the percentage of deaths in each group are shown in Figure 5. About 80% of the fatal cardiovascular events occurred in approximately 80% of the female population with low risk (< 1% at 10 years) with SCORE-C and SCORE-LOW-HDL. In men, with the same functions, about 40% of events occurred in approximately 60% of the low-risk population. With the SCORE-LOW function, more than 50% of the events occurred in the 1.1% to 5% risk group (intermediate risk) in both sexes.
 and proportion of cases over the total in each group (lines and dots). The risk is multiplied by 3 and 5 in men and women with diabetes, respectively. SCORE-C, calibrated Systematic COronary Risk Evaluation; SCORE-LOW, original Systematic COronary Risk Evaluation; SCORE-LOW-HDL, original low-risk Systematic COronary Risk Evaluation with high-density lipoprotein cholesterol.")
Population proportion in different risk of cardiovascular death groups according to the SCORE-LOW, SCORE-C, and SCORE-LOW-HDL functions (bars) and proportion of cases over the total in each group (lines and dots). The risk is multiplied by 3 and 5 in men and women with diabetes, respectively. SCORE-C, calibrated Systematic COronary Risk Evaluation; SCORE-LOW, original Systematic COronary Risk Evaluation; SCORE-LOW-HDL, original low-risk Systematic COronary Risk Evaluation with high-density lipoprotein cholesterol.
Sensitivity analysis of the SCORE-LOW estimates–by applying a correction factor of 2 and 4 to men and women with diabetes, respectively–showed similar results ().
DISCUSSIONThe present study is the first to analyze the validity components (reliability and accuracy) of the cardiovascular risk estimates of the original SCORE function with and without HDL-C5,9 and of its calibrated version8,9 in a Spanish cohort with a population base of more than 30 000 participants followed up for 10 years. The 3 functions predicted significantly higher cardiovascular mortality rates (from 6.5 to 9.1 times in men and from 1.3 to 3.3 in women) than those observed in this period (accuracy). The discrimination (reliability) of the SCORE functions was acceptable and similar to that of most cardiovascular risk functions.4,11,16,17
Comparison With Other StudiesMost European population-based studies analyzing the validity of the high-risk SCORE function indicate that estimates of risk of cardiovascular death are significantly higher in both sexes than the observed rates in the Netherlands,18 Denmark,19 Norway,20 Germany (2 studies),21,22 Iceland,23 and the United Kingdom.24 In all of these studies, SCORE approximately doubled the true risk of cardiovascular death. In an Australian population, who are mainly of European origin, the risk was overestimated by 75% in women.25
The risk estimation with SCORE-LOW was 40% higher than that observed in the nondiabetic population in Extremadura, Spain.26 This function has also been evaluated in high-risk countries such as the Netherlands18 and Iceland,23 where the risk of cardiovascular death was correctly estimated. However, in Germany21 and the United Kingdom,24 this function overestimated the risk by 31% and 25%, respectively. In Norway,20 the results were acceptable in men, but the risk was overestimated in women (observed-to-expected mortality ratio: 0.69 in patients 50 to 59 years old and 0.56 in those 60 to 69 years old), with similar findings from Australia (16% overestimation).25
In agreement with our results, a cross-sectional study performed in the Catalan population showed that the SCORE-C function (particularly in men) classified a higher percentage of patients as high risk vs the SCORE-LOW and SCORE-LOW-HDL functions.27 In addition, a risk overestimation was seen with the SCORE function calibrated for the Netherlands18 (approximately double), whereas the estimate was adequate in Germany.22 In Denmark, the calibrated function failed to improve the validity of the SCORE-LOW function.19
Implications for Clinical PracticeOverall, the 3 versions of the SCORE function analyzed provided significantly different cardiovascular risk estimates from those actually observed in the Spanish population. In women, 80% of fatal cardiovascular events were concentrated in the low-risk groups of the SCORE-C and SCORE-LOW-HDL functions and in the intermediate- and low-risk groups of SCORE-LOW, whereas 80% of events in men were concentrated in low- and intermediate-risk groups with SCORE-C and SCORE-LOW-HDL and 65% with SCORE-LOW. This observation indicates that the cutoff points defining low, intermediate, and high risk should be revised downward. Definition of the cutoff points is limited by the absence of decimal places in the estimates of the European Society of Cardiology calculator for the SCORE-C and SCORE-LOW-HDL functions.9
The results of the present study suggest that all SCORE versions5,8,9 have significant limitations in the accuracy of the estimates obtained in the Spanish population. It was additionally confirmed that most cardiovascular events occurring in Spain are not fatal.11 The accuracy of tables based solely on cardiovascular mortality can vary over time, given that this type of mortality has greatly decreased in the 3 decades since the development of the SCORE cohorts.2,5 Similarly, the exclusion of individuals aged from 65 to 74 years is also clinically relevant because the rate of death from cardiovascular causes in this population is double that of the individuals included in our cohort (40-64 years). In a Danish study, the authors suggested that future guidelines should focus on individuals older than 65 years because most fatal cardiovascular events occur in this population.19 Recently, a version of SCORE Older People was published, which permits estimation of the risk of cardiovascular death in individuals 65 to 74 years.28 For its derivation, the authors used the SCORE cohorts of Norway (mainly; 86.9% of the sample included in the derivation), Italy, Belgium, and Denmark. In Spain, the SCORE Older People tables showed a lower risk than that estimated using SCORE for persons older than 65 years.29 It is thus reasonable to also promote the use of the functions validated in Spain: the Framingham-Wilson calibrated by REGICOR4,16,17 and by FRESCO,11 which also increases the upper age limit to 79 years.
To perform effective prevention of cardiovascular diseases, the models for predicting individual risk should follow the TRIPOD guidelines.30 These recommendations promote transparency in the publication of the methods used in order to facilitate their evaluation.
Study LimitationsThe FRESCO study combines data from 12 Spanish cohorts that are representative of the populations of different reference areas recruited between 1991 and 2004. The study has a large sample size, exhaustive 10-year follow-up of cardiovascular events, standardized data collection methodology for component cohorts, and broad representativeness of the Spanish population.11 Despite the robustness of these characteristics, there may be some residual heterogeneity among study components. First, the coefficients of the SCORE-C and SCORE-LOW-HDL functions were not available because they have not been published.8 Accordingly, the use of the online HeartScore calculator was required, even though it was designed for the health care setting9 and rounds results to whole numbers. The absence of decimal places prevented calculation of the area under the curve of the 2 functions. This limitation also affected the calibration analysis, which was restricted to 4 risk groups instead of the risk sextiles and deciles (such as in the case of the SCORE-LOW function) used classically to evaluate the accuracy of the cardiovascular risk functions.15,16
CONCLUSIONSThe risk predictions of all SCORE functions significantly differed from the 10-year incidence rates in a contemporary Spanish population eligible for primary cardiovascular prevention. Because the SCORE functions considerably overestimated the true risk of cardiovascular death, their recalibration is required to better adjust their predictions to the actual rates of cardiovascular mortality.
FUNDINGThe present work has received the following support: Fundació La Marató from TV3 (081630); Instituto de Salud Carlos III, Red de Investigación Cardiovascular RD12/0042 (HERACLES Program); Red de Investigación en Actividades Preventivas y de Promoción de la Salud RD06/0018; CP12/03287; Agència de Gestió d’Ajuts Universitaris i de Recerca (2005SGR00577, 2009SGR1195, 2014SGR240); CIBER de Epidemiología y Salud Pública; CIBER de Fisiopatología de la Obesidad y la Nutrición; European Regional Development Fund (FIS CP12/03287, FIS 14/00449, FIS PI081327, FIS PI1101801).
CONFLICTS OF INTERESTNone declared.
- –
Cardiovascular risk calculation through cardiovascular risk functions is key to primary prevention strategies.
- –
The European guidelines for cardiovascular disease prevention and the Spanish Interdisciplinary Committee for Cardiovascular Prevention recommended the use of the SCORE function, among other tools.
- –
The sole cardiovascular risk function validated in Spain is the Framingham-Wilson function calibrated by the REGICOR group and the FRESCO function.
- –
SCORE functions were not valid in a contemporary Spanish population.
- –
SCORE functions significantly overestimate the true risk of cardiovascular death, even in the version calibrated for the Spanish population.
- –
The cutoff points of the SCORE functions should be redefined to achieve efficient stratification of cardiovascular prevention in clinical practice.
The authors thank Susanna Tello, Marta Cabañero, and Leny Franco for their work on project data management.