
The aim of this study was to analyze whether nonelective admissions in patients with heart failure (HF) on nonworking days (NWD) are associated with higher in-hospital mortality.
MethodsWe conducted a retrospective (2018-2019) observational study of episodes of nonelective admissions in patients aged 18 years and older discharged with a principal diagnosis of HF in acute general hospitals of the Spanish National Health System. NWD at admission were defined as Fridays after 14:00hours, Saturdays, Sundays, and national and regional holidays. In-hospital mortality was analyzed with logistic regression models. The length of NWD was considered as an independent continuous variable. Propensity score matching was used as a sensitivity analysis.
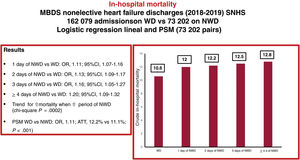
ResultsWe selected 235 281 episodes of nonelective HF admissions. When the NWD periods were included in the in-hospital mortality model, the increases in in-hospital mortality compared with weekday admission were as follows: 1 NWD day (OR, 1.11; 95%CI, 1.07-1.16); 2 days (OR, 1.13; 95%CI, 1.09-1.17); 3 (OR, 1.16; 95%CI, 1.05-1.27); and ≥4 days (OR, 1.20; 95%CI, 1.09-1.32). There was a statistically significant association between a linear increase in NWD and higher risk-adjusted in-hospital mortality (chi-square trend P=.0002). After propensity score matching, patients with HF admitted on NWD had higher in-hospital mortality than those admitted on weekdays (OR, 1.11; average treatment effect, 12.2% vs 11.1%; P<.001).
ConclusionsWe found an association between admissions for decompensated HF on an NWD and higher in-hospital mortality. The excess mortality is likely not explained by differences in severity. In this study, the “weekend effect” tended to increase as the NWD period became longer.
Keywords
A large number of studies have analyzed the association of weekend admissions with significantly higher in-hospital mortality rates compared with weekday admissions (“weekend effect”) in a wide range of patient populations, diseases, health care providers, and health systems.1,2 Major health policy interventions have been proposed and implemented to avoid the weekend effect,3 but these have been highly controversial. The debate about the existence of the “weekend effect” and its causes remains open. Some researchers have questioned the existence of a weekend effect,4 while others have highlighted the uncertainty about its causes,5 attributing the excess mortality to the greater severity of patients admitted at weekends or to structural and managerial aspects of the centers.6 Others have proposed an extended weekend effect describing an excess of mortality also on Mondays and Fridays.7
The existence of a weekend effect on various aspects of health care quality, including mortality, has also been demonstrated in the Spanish National Health System (SNHS).8,9 Heart failure (HF) is one of the main causes of hospital admissions in the SNHS, with high in-hospital mortality rates, 30-day readmissions, and prolonged hospital stays.10 In patients with HF, excess mortality has been described in weekend admissions, attributed to the greater severity of these patients11 or to the reduced hospital staffing at weekends.12
Although there are local exceptions, on weekends and holidays (nonworking days [NWD]) nursing staff are halved, consultants are only on call for emergencies, there are no ward rounds and no imaging, and pathology departments are only used for emergencies.13 The aim of this study was to analyze whether nonelective admissions of patients with HF on NWD and the length of reduced care on admission were associated with higher in-hospital mortality. Secondary objectives were to analyze the association of NWD with length of stay and the likelihood of 30-day readmission for circulatory diseases.
METHODSPopulationRetrospective observational study of episodes of nonelective admission in patients aged 18 years and older discharged with a principal diagnosis of HF from acute general hospitals of the SNHS (table 1 of the supplementary data) from 2018 to 2019. The data source was the Minimum Data Set of the SNHS, which includes information on the demographic characteristics of admitted patients and administrative variables related to the diagnoses and procedures performed in patients during the hospitalization episode, coded according to the International Classification of Diseases, 10th Revision (ICD 10).14
NWD on admission were defined as Fridays after 14:00hours, Saturdays, Sundays and national and regional holidays. If a single working day fell between 2 NWD, it was also considered a NWD. The length of NWD periods was classified into 5 mutually exclusive categories: 0 (admission on a working day); 1: admission on an NWD day; 2: admission on an NWD day accumulating 2 consecutive NWD; 3: admission on an NWD day accumulating 3 consecutive NWD; 4: admission on an NWD day accumulating 4 or more consecutive NWD.
To quantify possible differences in the outcomes of care in patients with HF in the SNHS in relation to NWD, in-hospital mortality, 30-day readmission for circulatory diseases, and length of hospital stay were compared with those of patients admitted on working days (Monday to Friday, excluding national or regional holidays).
To improve the quality and consistency of the data: a) the episodes of patients admitted to a hospital and transferred to another acute hospital were concatenated, attributing the data of the concatenated episode to the index episode, and b) episodes in patients younger than 18 years discharged to home with a stay of 1 day or less, discharges due to transfer to another hospital that could not be concatenated, voluntary discharges, and discharges to unknown destinations were excluded.15
Statistical analysisContinuous variables are expressed as mean and standard deviation or median [interquartile range] and categorical variables as numbers and percentages. Comparisons between continuous variables were made using Student t test for 2 factors and analysis of variance (ANOVA) with Bonferroni correction, for 3 or more factors, and between categorical variables using the chi-square test or Fisher exact statistic.
The adjustment variables defined by the Centers for Medicare and Medicaid Services were used to develop risk-adjusted models for HF mortality and readmissions.15,16 Sex and age (continuous) were independent variables in these models. We fitted the variables to the Minimum Data Set structure after grouping the secondary diagnoses into annually updated Agency for Healthcare Research and Quality “Condition Categories”17,18 (table 2 of the supplementary data). Logistic regression models were fitted including patient demographic and clinical variables and comorbidities with statistical significance and odds ratio (OR) >1.0. Backward stepwise elimination was used to estimate the fit of the models; significance levels for factor selection and elimination were P<.05 and P≥.10, respectively. Calibration was analyzed graphically after patients were grouped into quintiles with respect to predicted probabilities and tabulation of predicted vs observed mean probabilities. Discrimination was assessed using the area under the receiver operating characteristic curve (AUROC).19 To investigate the possible effect of in-hospital mortality as a competing event in readmission, we estimated the risk function of the subdistribution (Fine and Gray model, Stata stcrreg option) and compared the result with that of estimating a Cox proportional hazards model, in both cases considering NWD as an independent variable.20 The chi-square trend was used to assess the association between the linear increases in NWD and risk-adjusted in-hospital mortality.
To minimize potential selection bias in the comparison of outcomes between the 2 groups (weekday and NWD), the effect on causes of in-hospital mortality was further assessed by propensity score matching (option k-nearest neighbours matching, psmatch2, Stata), selecting among the episodes admitted on an NWD day those with a similar profile to each weekday episode, according to the variables statistically significant in the risk-adjusted models. Final matching was performed from the risk-adjusted models with a 1:1 ratio and without replacement. The probability of in-hospital mortality, the effect of differences between groups (average treatment effect), and OR with their 95% confidence intervals (95%CI), were calculated. A P-value of<.05 was considered to be statistically significant. Kernel density plots were used to graphically represent the matching process.
The data source was an anonymized administrative database, not requiring the approval of a Health Care Ethics Committee or informed consent from the patients.
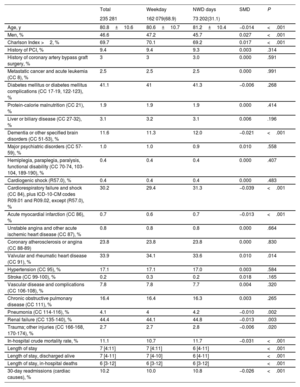
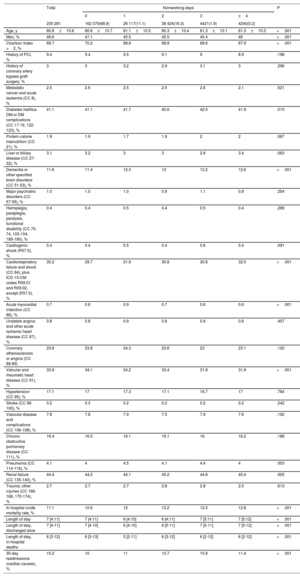
RESULTSAfter exclusions (figure 1 of the supplementary data), 235 281 episodes of nonelective HF admissions were selected, with a mean age of 80.8±10.6 years and 53.4% were female. Crude in-hospital mortality was 11.1%, median length of stay was 6.9 [IQR, 4.1:10.8] days, and 10.2% of the patients were readmitted for circulatory diseases within 30 days of discharge. A total of 73 202 (31.1%) episodes were admitted on NWD, 26 117 episodes (11.1%) corresponded to the 1-day group; 38 424 (16.3%) to 2 days; 4421 (1.9%) to 3 days; and 4240 (1.8%) to 4 or more days of NWD after admission. There were no clinically relevant differences in the patient profile according to the duration of NWD (table 1 and table 2), although NWD patients were slightly older (81.2±10.4 vs 80.5±10.7; P < .001), more likely to be women (54.3% vs 52.8%; P < .001), and with a slightly higher presence of cognitive decline (12% vs 11.3%; P < .001), cardiorespiratory failure (excluding cardiogenic shock) (31.3% vs 29.4%; P < .001), acute myocardial infarction (0.7% vs 0.6%; P < .001), and renal failure (44.8% vs 44.1%; P=.003). The crude mortality rate was 10.7% for patients admitted on weekdays and 11.7% for patients admitted on NWD (P < .001). The crude mortality rates for 1, 2, 3 or more NWD on admission were 12%, 12.2%, 12.5%, and 12.8%, respectively (P < .001).
Profile of patients discharged for heart failure. Weekdays vs “nonworking” days
| Total | Weekday | NWD days | SMD | P | |
|---|---|---|---|---|---|
| 235 281 | 162 079(68.9) | 73 202(31.1) | |||
| Age, y | 80.8±10.6 | 80.6±10.7 | 81.2±10.4 | −0.014 | <.001 |
| Men, % | 46.6 | 47.2 | 45.7 | 0.027 | <.001 |
| Charlson Index >2, % | 69.7 | 70.1 | 69.2 | 0.017 | <.001 |
| History of PCI, % | 9.4 | 9.4 | 9.3 | 0.003 | .314 |
| History of coronary artery bypass graft surgery, % | 3 | 3 | 3.0 | 0.000 | .591 |
| Metastatic cancer and acute leukemia (CC 8), % | 2.5 | 2.5 | 2.5 | 0.000 | .991 |
| Diabetes mellitus or diabetes mellitus complications (CC 17-19, 122-123), % | 41.1 | 41 | 41.3 | −0.006 | .268 |
| Protein-calorie malnutrition (CC 21), % | 1.9 | 1.9 | 1.9 | 0.000 | .414 |
| Liver or biliary disease (CC 27-32), % | 3.1 | 3.2 | 3.1 | 0.006 | .196 |
| Dementia or other specified brain disorders (CC 51-53), % | 11.6 | 11.3 | 12.0 | −0.021 | <.001 |
| Major psychiatric disorders (CC 57-59), % | 1.0 | 1.0 | 0.9 | 0.010 | .558 |
| Hemiplegia, paraplegia, paralysis, functional disability (CC 70-74, 103-104, 189-190), % | 0.4 | 0.4 | 0.4 | 0.000 | .407 |
| Cardiogenic shock (R57.0), % | 0.4 | 0.4 | 0.4 | 0.000 | .483 |
| Cardiorespiratory failure and shock (CC 84), plus ICD-10-CM codes R09.01 and R09.02, except (R57.0), % | 30.2 | 29.4 | 31.3 | −0.039 | <.001 |
| Acute myocardial infarction (CC 86), % | 0.7 | 0.6 | 0.7 | −0.013 | <.001 |
| Unstable angina and other acute ischemic heart disease (CC 87), % | 0.8 | 0.8 | 0.8 | 0.000 | .664 |
| Coronary atherosclerosis or angina (CC 88-89) | 23.8 | 23.8 | 23.8 | 0.000 | .830 |
| Valvular and rheumatic heart disease (CC 91), % | 33.9 | 34.1 | 33.6 | 0.010 | .014 |
| Hypertension (CC 95), % | 17.1 | 17.1 | 17.0 | 0.003 | .584 |
| Stroke (CC 99-100), % | 0.2 | 0.3 | 0.2 | 0.018 | .165 |
| Vascular disease and complications (CC 106-108), % | 7.8 | 7.8 | 7.7 | 0.004 | .320 |
| Chronic obstructive pulmonary disease (CC 111), % | 16.4 | 16.4 | 16.3 | 0.003 | .265 |
| Pneumonia (CC 114-116), % | 4.1 | 4 | 4.2 | −0.010 | .002 |
| Renal failure (CC 135-140), % | 44.4 | 44.1 | 44.8 | −0.013 | .003 |
| Trauma; other injuries (CC 166-168, 170-174), % | 2.7 | 2.7 | 2.8 | −0.006 | .020 |
| In-hospital crude mortality rate, % | 11.1 | 10.7 | 11.7 | −0.031 | <.001 |
| Length of stay | 7 [4:11] | 7 [4:11] | 6 [4-11] | <.001 | |
| Length of stay, discharged alive | 7 [4-11] | 7 [4-10] | 6 [4-11] | <.001 | |
| Length of stay, in-hospital deaths | 6 [3-12] | 6 [3-12] | 6 [3-12] | <.001 | |
| 30-day readmissions (cardiac causes), % | 10.2 | 10.0 | 10.8 | −0.026 | <.001 |
CC, condition categories17,18; ICD-10-CM, International Classification of Diseases, 10th Clinical Modication; NWD, nonworking days; PCI, percutaneous coronary intervention; SMD, standard mean deviation.
Unless otherwise indicated, the data are expressed as percentage, mean±standard deviation, or median [interquartile range].
Profile of patients discharged with heart failure according to the duration of nonworking days in the admission period
| Total | Nonworking days | P | |||||
|---|---|---|---|---|---|---|---|
| 0 | 1 | 2 | 3 | ≥4 | |||
| 235 281 | 162 079(68.9) | 26 117(11.1) | 38 424(16.3) | 4421(1.9) | 4240(0.2) | ||
| Age, y | 80.8±10.6 | 80.6±10.7 | 81.1±10.5 | 80.3±10.4 | 81.3±10.1 | 81.3±10.3 | <.001 |
| Men, % | 46.6 | 47.1 | 45.5 | 45.5 | 45.4 | 46 | <.001 |
| Charlson Index >2, % | 69.7 | 70.2 | 68.8 | 68.8 | 68.6 | 67.9 | <.001 |
| History of PCI, % | 9.4 | 9.4 | 9.5 | 9.1 | 9 | 8.9 | .198 |
| History of coronary artery bypass graft surgery, % | 3 | 3 | 3.2 | 2.9 | 3.1 | 3 | .296 |
| Metastatic cancer and acute leukemia (CC 8), % | 2.5 | 2.6 | 2.5 | 2.5 | 2.6 | 2.1 | .521 |
| Diabetes mellitus DM or DM complications (CC 17-19, 122-123), % | 41.1 | 41.1 | 41.7 | 40.6 | 42.5 | 41.9 | .010 |
| Protein-calorie malnutrition (CC 21), % | 1.9 | 1.9 | 1.7 | 1.9 | 2 | 2 | .067 |
| Liver or biliary disease (CC 27-32), % | 3.1 | 3.2 | 3 | 3 | 2.8 | 3.4 | .063 |
| Dementia or other specified brain disorders (CC 51-53), % | 11.6 | 11.4 | 12.3 | 12 | 12.2 | 12.6 | <.001 |
| Major psychiatric disorders (CC 57-59), % | 1.0 | 1.0 | 1.0 | 0.9 | 1.1 | 0.8 | .254 |
| Hemiplegia, paraplegia, paralysis, functional disability (CC 70-74, 103-104, 189-190), % | 0.4 | 0.4 | 0.5 | 0.4 | 0.5 | 0.4 | .289 |
| Cardiogenic shock (R57.0), % | 0.4 | 0.4 | 0.5 | 0.4 | 0.6 | 0.4 | .091 |
| Cardiorespiratory failure and shock (CC 84), plus ICD-10-CM codes R09.01 and R09.02, except (R57.0), % | 30.2 | 29.7 | 31.9 | 30.8 | 30.8 | 32.5 | <.001 |
| Acute myocardial infarction (CC 86), % | 0.7 | 0.6 | 0.9 | 0.7 | 0.6 | 0.6 | <.001 |
| Unstable angina and other acute ischemic heart disease (CC 87), % | 0.8 | 0.8 | 0.9 | 0.8 | 0.8 | 0.6 | .457 |
| Coronary atherosclerosis or angina (CC 88-89) | 23.8 | 23.8 | 24.3 | 23.6 | 23 | 23.1 | .120 |
| Valvular and rheumatic heart disease (CC 91), % | 33.9 | 34.1 | 34.2 | 33.4 | 31.8 | 31.9 | <.001 |
| Hypertension (CC 95), % | 17.1 | 17 | 17.3 | 17.1 | 16.7 | 17 | .784 |
| Stroke (CC 99-100), % | 0.2 | 0.3 | 0.2 | 0.2 | 0.2 | 0.2 | .242 |
| Vascular disease and complications (CC 106-108), % | 7.8 | 7.8 | 7.9 | 7.5 | 7.9 | 7.6 | .192 |
| Chronic obstructive pulmonary disease (CC 111), % | 16.4 | 16.5 | 16.1 | 16.1 | 16 | 16.2 | .188 |
| Pneumonia (CC 114-116), % | 4.1 | 4 | 4.5 | 4.1 | 4.4 | 4 | .003 |
| Renal failure (CC 135-140), % | 44.4 | 44.2 | 44.1 | 45.2 | 44.8 | 45.4 | .005 |
| Trauma; other injuries (CC 166-168, 170-174), % | 2.7 | 2.7 | 2.7 | 2.8 | 2.8 | 2.5 | .613 |
| In-hospital crude mortality rate, % | 11.1 | 10.6 | 12 | 12.2 | 12.5 | 12.8 | <.001 |
| Length of stay | 7 [4:11] | 7 [4:11] | 6 [4:10] | 6 [4:11] | 7 [5:11] | 7 [5:12] | <.001 |
| Length of stay, discharged alive | 7 [4-11] | 7 [4-10] | 6 [4-10] | 6 [5-11] | 7 [5-11] | 7 [5-12] | <.001 |
| Length of stay, in-hospital deaths | 6 [3-12] | 6 [3-13] | 5 [2-11] | 6 [3-12] | 6 [2-12] | 6 [2-12] | <.001 |
| 30-day readmissions (cardiac causes), % | 10.2 | 10 | 11 | 10.7 | 10.9 | 11.4 | <.001 |
CC, condition categories17,18; ICD-10-CM, International Classification of Diseases, 10th Clinical Modication; IQR, interquartile range; PCI, percutaneous coronary intervention.
The data are expressed as percentage, mean±standard deviation, or median [interquartile range].
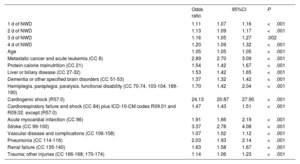
The prognostic variables included in the risk adjustment model for in-hospital mortality are shown in table 3 of the supplementary data. The adjustment model had an AUROC of 0.69 (95%CI, 0.69-0.70) and fair calibration (figure 2 of the supplementary data). When NWD periods were included in the in-hospital mortality model, compared with a weekday admission, 1 day of NWD increased an 11% the odds of in-hospital death (OR, 1.11; 95%CI, 1.07-1.16); 2 days by 13% (OR, 1.13; 95%CI, 1.09-1.17); 3 days by 16% (OR, 1.16; 95%CI, 1.05-1.27); and ≥4 days by 20% (OR, 1.20; 95%CI, 1.09-1.32) (table 3). Although the differences between the NWD groups were not statistically significant, there was a statistically significant association between a linear increase in NWD and higher risk-adjusted in-hospital mortality (chi-square trend P=.0002).
Logistic regression model of risk adjustment for in-hospital mortality. Length of nonworking days as independent variable
| Odds ratio | 95%CI | P | ||
|---|---|---|---|---|
| 1 d of NWD | 1.11 | 1.07 | 1.16 | <.001 |
| 2 d of NWD | 1.13 | 1.09 | 1.17 | <.001 |
| 3 d of NWD | 1.16 | 1.05 | 1.27 | .002 |
| 4 d of NWD | 1.20 | 1.09 | 1.32 | <.001 |
| Age | 1.05 | 1.05 | 1.05 | <.001 |
| Metastatic cancer and acute leukemia (CC 8) | 2.89 | 2.70 | 3.09 | <.001 |
| Protein-calorie malnutrition (CC 21) | 1.54 | 1.42 | 1.67 | <.001 |
| Liver or biliary disease (CC 27-32) | 1.53 | 1.42 | 1.65 | <.001 |
| Dementia or other specified brain disorders (CC 51-53) | 1.37 | 1.32 | 1.42 | <.001 |
| Hemiplegia. paraplegia. paralysis. functional disability (CC 70-74. 103-104. 189-190) | 1.70 | 1.42 | 2.04 | <.001 |
| Cardiogenic shock (R57.0) | 24.13 | 20.87 | 27.90 | <.001 |
| Cardiorespiratory failure and shock (CC 84) plus ICD-10-CM codes R09.01 and R09.02. except (R57.0) | 1.47 | 1.43 | 1.51 | <.001 |
| Acute myocardial infarction (CC 86) | 1.91 | 1.66 | 2.19 | <.001 |
| Stroke (CC 99-100) | 3.37 | 2.78 | 4.08 | <.001 |
| Vascular disease and complications (CC 106-108) | 1.07 | 1.02 | 1.12 | <.001 |
| Pneumonia (CC 114-116) | 2.03 | 1.93 | 2.14 | <.001 |
| Renal failure (CC 135-140) | 1.63 | 1.58 | 1.67 | <.001 |
| Trauma; other injuries (CC 166-168; 170-174) | 1.14 | 1.06 | 1.23 | <.001 |
CC, condition categories17,18; ICD-10-CM, International Classification of Diseases, 10th Clinical Modication; NWD, nonworking days.
The crude rate of 30-day cardiovascular readmission increased with the duration of NWD, from 10% when admission occurred on a weekday to 11.4% when the period of NWD exceeded ≥4 days. The prognostic variables included in the risk adjustment model for 30-day cardiovascular readmissions are shown in table 4 of the supplementary data. The adjustment model had poor discrimination (AUROC, 0.58) and good calibration (figure 3 of the supplementary data). When the NWD period was incorporated into the model for 30-day in-hospital readmissions, compared with a weekday admission, 1 day of NWD increased the risk of 30-day readmission by 11% (OR, 1.10; 95%CI, 1.05-1.16); 2 days by 7% (OR, 1.07; 95%CI, 1. 03-1.11); 3 days by 9% (OR, 1.09; 95%CI, 0.98-1.22); and 4 or more days by 16% (OR, 1.16; 95%CI, 1.04-1.3) (P < .001), although the differences between the NWD groups were not statistically significant. There was no competing effect of mortality on readmissions.
After propensity score matching, patients with HF admitted on an NWD had higher in-hospital mortality than patients with HF admitted on weekdays (OR, 1.11; average treatment effect, 12.2% vs 11.1%; P < .001).
The length of stay of patients with 1 or more NWD was shorter than that of patients admitted on working days (6; IQR, 3:12 vs 7; IQR, 4:11; P < .001).
DISCUSSIONThe main findings of this study were as follows: a) there was an association between patients with HF admitted to SNHS hospitals during periods of NWD with an increased risk of in-hospital mortality and 30-day readmission for circulatory diseases; and b) the increased risk of in-hospital mortality tended to be greater as the period of NWD became longer (figure 1).

Central illustration. Cumulative effect of 'nonworking' days. Methodology and results. 95%CI, 95% confidence interval; ATT, average treatment effect; MBDS, Minimum Basic Data Set; NWD, nonworking days; OR, odds ratio; PSM, propensity score matching; SNHS, Spanish National Health System; WD, working days.
Previous studies have reported an association of admission on weekend days with excess in-hospital mortality in patients admitted for decompensated HF.11,12,21–23 To our knowledge, this study is the first to analyze the association between the duration of NWD on admission and outcomes (in-hospital mortality, 30-day readmissions) in decompensated patients with HF. Despite the described association between weekend admission and greater patient severity,11 our study found slight clinical, but statistically significant differences in the profile of patients according to the duration of NWD groups, with patients with HF admitted on NWD being slightly more severe. However, the differences in in-hospital mortality between the 2 groups remained after risk adjustment (logistic regression model and propensity score matching).
A plausible explanation for the findings of this study is the potential gap in care that may be associated with reduced staffing on weekends and holidays.1 Aldridge et al.24 found no association between specialist intensity and admission mortality in acute hospital trusts in England, but reduced nursing staffing on weekends may be associated with mortality. Zapatero et al.13 reported an association between higher ratios of patients per registered nurse and risk-standardized in-hospital mortality for selected causes, although these authors did not find this association specifically for in-hospital mortality due to HF. Amigo et al.25 also found an association between weekend admissions and short-term mortality from selected causes in Spanish hospitals (Catalonia), with a stronger effect for HF admissions. The ratio of patients to registered nurses is high in acute general hospitals of the SNHS (9.9±0.7, weekday morning shift in internal medicine wards),13 and higher mortality rates and lower quality of care have been described when nursing workload increases.26 Walker et al.27 found no association between excess mortality rates during weekend admissions and hospital workload, but these authors used a proxy for workload due to lack of information on staffing information. Continuity of care during weekends in hospitals of the SNHS is generally addressed by on-duty teams, which are called when a nurse detects worsening in the clinical situation; weekend rounds are infrequent, and the implementation of early warning systems is low.13,28 In-hospital avoidable deaths have been described when patient deterioration goes undetected or communication between staff is inadequate.6,29 Clinical management may also be related to the weekend effect in hospitals of the SNHS, and it has been reported that adherence to clinical practice guidelines may vary throughout the day.30
Although there were no statistically significant differences in risk-adjusted mortality between the NWD groups, we found a statistically significant trend for in-hospital risk-adjusted mortality in patients with HF to increase with the length of NWD. Excess mortality was 20% for NWD of 4 or more days and 11% for NWD of 1 day. A cumulative negative effect of the “weekend effect” can be expected if the contributing weekend conditions remain unchanged, as is the case in the hospitals of the SNHS in relation to reduced staffing, low implementation of early warning systems, and multidisciplinary round wards.
The association between the reported NWD effect of weekends and holidays on patients with HF in the SNHS hospitals indicates the need for research into other diseases with specific risk adjustment models and analysis of the underlying probable causes: staffing and hospital workload, adherence to clinical practice guidelines, and other organizational causes such as the functioning of the primary health care level on weekends and holidays.
LimitationsOur study has several limitations. Due to its observational and retrospective design, based on an administrative database, we cannot exclude the possibility of selection bias and the possible effect of unmeasured confounders. In addition, given the data source used, there may also be bias to the extent that the Minimum Data Set does not collect information on some relevant clinical or analytical variables.27 On the other hand, it is a strength that the use of administrative databases to study health outcomes has been validated by comparison with data extracted from medical records.31,32
This study used a specific risk-adjusted model for HF mortality and readmissions. Although the models used in this study are comparable to other published models in terms of their discriminatory power,15,16 it should be remembered that there are confounding factors in the adjustment models that cannot be taken into account and that may have a significant impact.
The high number of episodes in this study is a strength but also provides an overpowered sample for statistical contrasts. A correct interpretation of the results depends on the clinical significance of the changes; we have therefore included the standard mean deviation in the comparisons between groups.
CONCLUSIONSWe found an association between nonelective hospital admissions for decompensated HF on an NWD day and higher in-hospital mortality and a higher likelihood of 30-day readmission for circulatory diseases in acute general hospitals of the SNHS. The excess of mortality is likely not explained by differences in severity. In this study, the “weekend effect” tended to increase with more prolonged NWDs.
- -
-The “weekend effect” (the association between hospital admission on weekend days and mortality) is controversial. The debate about the existence of a “weekend effect” and its causes remains open.
- -
-The weekend effect has been described in Spain for some conditions and hospitals.
- -
-Some authors have found a “weekend effect” in patients admitted for decompensated heart failure.
- -
This study evaluated the cumulative effect of weekends and nonworking days (NWD) using a specific risk adjustment model for heart failure.
- -
In-hospital mortality in decompensated heart failure tended to increase with the length of NWD; 1 NWD increased mortality by 13.2% and 4 days or more by 20.8%.
- -
The odds ratio for in-hospital death increased from 1.11 for 1 day to 1.29 for 4 or more NWD. This trend was statistically significant.
- -
Differences in outcomes between patients with decompensated heart failure admitted to hospital on NWD and working days were not explained by differences in severity.
This work was supported by an unrestricted grant from the Fundación Interhospitalaria de Investigación Cardiovascular (Madrid, Spain).
ETHICAL CONSIDERATIONSThis study was based on anonymized administrative data and did not require the approval of an ethics committee or informed consent.
STATEMENT ON THE USE OF ARTIFICIAL INTELLIGENCEArtificial intelligence was not used in this study.
AUTHORS’ CONTRIBUTIONSAll authors meet the characteristics defined by the International Committee of Medical Journal Editors.
CONFLICTS OF INTERESTThe authors have no relevant relationships to disclose that could affect the content of this article.
The authors thank the Spanish Ministry of Health its support in the conduct of the RECALCAR project, with special thanks to the Institute of Health Information and to the Spanish Society of Cardiology.