The extent of calcification of the epicardial coronary arteries can be quantified using contrast-free coronary computed tomography angiography (CTA) by calculating the Agatston score (AS) to provide a measure of atherosclerotic load. Several studies have demonstrated that the AS is a strong predictor of cardiovascular events and adds prognostic information to the cardiovascular risk scales.1 The AS has allowed individual cardiovascular risk to be refined, particularly in intermediate-risk patients. Recent guidelines on cardiovascular prevention recommend use of this scale. Currently, contrast-enhanced CTA during cardiac computed tomography can be used to measure the extent of coronary artery disease, whether or not associated with calcification, and up to 20% of noncalcified atherosclerotic lesions can be detected.2 However, use of contrast enhancement in the study procedure hinders calculation of the AS which has traditionally been determined by contrast-free CTA. Several articles have validated different methodologies for obtaining this score during the same cardiac computed tomography procedure3,4; however, few of these studies used software currently available commercially. Recently, Otton et al5 validated a new methodology that allows this score to be obtained during contrast-enhanced cardiac computed tomography with such software.
We present our experience with a study designed to assess the correlation of AS calculated from contrast-free and contrast-enhanced CTA by applying the above methodology. No such study has been published by other groups.
We retrospectively analyzed 50 individuals who underwent a voluntary medical check-up between December 2012 and September 2013. Tests included a contrast-free CTA to calculate the AS and a contrast-enhanced CTA. Patients were only included if some degree of coronary calcification was detected in both studies. No patient had to be excluded due to poor quality of the study (for example, excessive noise or insufficient coronary opacification). The mean (SD, standard deviation) age of the population studied was 58 (11) years and 86% were men. In addition, 47% were smokers, 45% had hypertension, 71% had dyslipidemia, 18% had diabetes, and their mean (SD) REGICOR score was 6.7% (3.7%). Both studies (with and without contrast) were performed consecutively with a Toshiba Aquilion One scanner and the results were analyzed on a Vitrea FX v3.1 workstation (Toshiba Medical Systems, Tokyo, Japan). The AS from contrast-free CTA was quantified using axial views and the VScore tool. Curved multiplanar reconstructions along the short axis (intravascular ultrasonography-like images) were used in contrast-enhanced CTA, with 75% acquired in the R-R interval and using the SurePlaque tool, which enables calculation of the total calcium volume (in mm3) present in the coronary atherosclerotic plaques. According to the published methodology, in contrast-enhanced CTA the AS is derived from the product of a factor that represents the gradient of the linear regression fit of the AS obtained for both methodologies (3.13 HU/μL) and the total calcium volume, using a threshold of 320 HU to discriminate between noncalcified atheroma and contrast material.
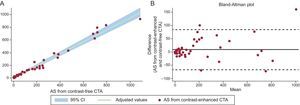
In our study, the median AS was 66.5 (interquartile range, 233) in contrast-free CTA and 63.23 (interquartile range, 181) in contrast-enhanced CTA. In our linear regression model, the correlation between the AS from contrast-free and contrast-enhanced CTA yielded a Pearson correlation coefficient of 0.98 (P<.001), with a gradient for the fit of 3.23 (95% confidence interval [95%CI] 30.8-3.37) (Figure A). The equation that enabled a more accurate calculation of AS from total calcium volume in the CTA studies was as follows:

. B: Degree of agreement between Agatston scores (Bland-Altman plot). AS, Agatston score; CI, confidence interval; CTA, computed tomography angiography.")
A: Correlation between Agatston scores obtained by contrast-free and contrast-enhanced computed tomography angiography (linear regression using Passing-Bablok method). B: Degree of agreement between Agatston scores (Bland-Altman plot). AS, Agatston score; CI, confidence interval; CTA, computed tomography angiography.
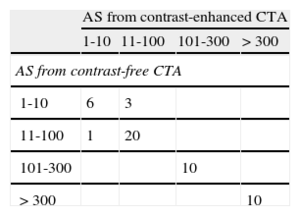
The individual intraclass correlation coefficient between AS in contrast-free and contrast-enhanced CTA was 0.98 (95%CI, 0.97-0.99; P<.001) and the Lin concordance correlation coefficient was 0.987 (Figure B). Reclassification of patients according to clinically relevant AS (> 300), comparing the score for contrast-free and contrast-enhanced CTA yielded a concordance of 100% (κ = +1; P<.001) (Table).
Analysis of Reclassification of Patients According to Their Agatston Score Estimated by Contrast-Free and Contrast-enhanced Computed Tomography Angiography
| AS from contrast-enhanced CTA | ||||
| 1-10 | 11-100 | 101-300 | >300 | |
| AS from contrast-free CTA | ||||
| 1-10 | 6 | 3 | ||
| 11-100 | 1 | 20 | ||
| 101-300 | 10 | |||
| >300 | 10 | |||
AS, Agatston score; CTA, computed tomography angiography.
In conclusion, AS can feasibly be obtained from contrast-enhanced CTA and the value correlates with the one obtained from a conventional approach based on contrast-free CTA. This approach provides complete information on an individual's coronary atherosclerotic load (presence of calcified and noncalcified plaques) in a single acquisition, thereby reducing the radiation dose administered to the patient.
We thank Toshiba Medical Systems for their disinterested assistance by means of a clinical research grant awarded to the principal investigator (David Viladés).