Keywords
INTRODUCTION
Intravascular ultrasound (IVUS) technology was first used over 30 years ago to assist endovascular procedures.1,2 The quantification of IVUS images has become essential in recent years to understand the pathophysiology of ischemic heart disease3 as well as in numerous aspects of interventional cardiology.4 However, the analysis of IVUS sequences is still time-consuming for the observer, thus requiring heavy investments in and labor intensive.
The purpose of the present study was to develop computer tools that would facilitate and automate this analysis as much as possible. Previous articles have evaluated very short sequences and have not yet been incorporated in daily practice.5-9
We proposed the development of a computerized method that would allow three-dimensional (3D) reconstruction of IVUS sequences with minimal participation by the analyst, thus providing a rapid, automatic way to quantify the most commonly used variables (vessel area, lumen area, plaque volume, and lesion severity). We then assessed the reliability of this tool and its performance in terms of time savings over standard manual analysis.
METHODS
Study Setting
The computer method presented was developed by a group of interventional cardiologists and biomedical engineers. Although the more technical aspects were obviously implemented by the engineers, this was always done under the cardiologists' supervision and according to their needs as suggested in each phase.
The entire process was performed using MATLAB 6.5 (The Mathworks Inc., Natick, Massachusetts, USA), and all measurements were done off-line on a dedicated workstation for the analysis of cardiology images (HP Workstation xw6000, Intel Xeon 2.4 GHz, 2Gb RAM) by a single experienced observer.
The IVUS image sequences were obtained with a Clearview Ultra unit (Boston Scientific Corp., Natick, Massachusetts, USA) using an Atlantis Plus 40 catheter (40 MHz) at a catheter withdrawal rate of 0.5 mm/s. The IVUS video sequences were initially recorded on a VHS tape; video digitalization was done using a Pinnacle card (Avid Technology Inc., Mountain View, California, USA) that generated AVI sequences using PIM1 codec at a rate of 25 images/s and a resolution of 352ƒ288 pixels.
Preliminary Image Processing
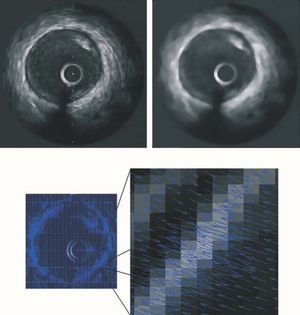
The speckle noise of images obtained by ultrasound echoes was reduced using a median filter that decreases noise by softening the image, while also enhancing the borders of interest.10 Figure 1 (upper panel) shows the result of applying the filter to a typical IVUS image.

Figure 1. (Upper panel) Application of a median filter to a typical IVUS image. The IVUS image (left) presents speckle noise produced by undesirable ultrasound echoes. The filtered image (right) shows lower noise and an enhanced border between the tunica media and adventitia. (Lower panel) Border information from a typical IVUS image. Force field for the entire image (left) and zoom of the field (right), showing convergence toward the media-adventitia contour.
Detection of Media-Adventitia Border Contour
The limit between the media layer and the adventitia defines the vessel area.11 This was obtained using the snake technique,12,13 in which the contour progressively and automatically adapts to each sequence image and only the approximate contour of the first image of the sequence must be manually specified. The media-adventitia limit shows a high contrast in IVUS images, making it relatively simple to detect the border. In the presence of shadows caused by the catheter guidewire or a calcified plaque, the contour is completed smoothly, respecting the usual anatomy of the vessel. Figure 1 (lower panel) shows a typical IVUS image with the border information appropriately identified. Figure 2 (upper left panel) contains an example of automatic adaptation of the contour.

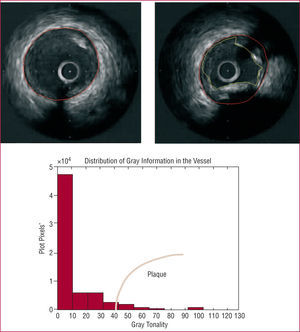
Figure 2. (Upper panel) Automatic adaptation of media-adventitia border contour. (Middle panel) Distribution of gray information in a typical IVUS image. The range of hues may vary between 0 (black) and 255 (white). The region where the intensity is sufficient to estimate the presence of plaque is indicated in red. (Lower panel) Detection of the contours of interest for a typical IVUS image in the presence of calcified plaque. The media-adventitia border contour is in red, and the contour associated with the lumen in yellow.
The main problem of the method is errors caused by abrupt interruptions in the IVUS sequence due to catheter movements. To prevent this error, the specialist was allowed to specify a certain number of additional contours following two criteria: a) the first was based on the correlation between successive images; if the variation detected was sufficiently sensitive to cause the contour to be improperly adapted, specification of a new contour was suggested, and b) the second criterion was based on periodic introduction of a manual contour every certain number of images. The manual contour definition required only a few minutes at the start of the reconstruction, and the rest of the process was fully automatic.
Lumen and Plaque Detection
Once the region of the vessel area has been detected, the rest of the image was differentiated and the method focused on analyzing the area of interest, in order to distinguish between the catheter, lumen, and intima (or plaque). The catheter area was readily detectable, as it always occupied the same region of the image. To distinguish between the lumen region and the plaque or intima, gray shading was used as previously defined in a statistical study on the gray tones corresponding to each region.14 The lumen presented darker tones, whereas the plaque and intima were lighter, showing even greater brightness in the case of calcified plaque. Figure 2 (lower panel) contains an example of gray tone distribution in the area of interest of an IVUS image, where the black tone region represents the region outside the vessel area. Figure 2 (upper right panel) shows an example of detection of two contours of interest: media-adventitia and lumen. The plaque area was defined as the difference between the vessel area and the lumen area.11
Three-Dimensional Reconstruction
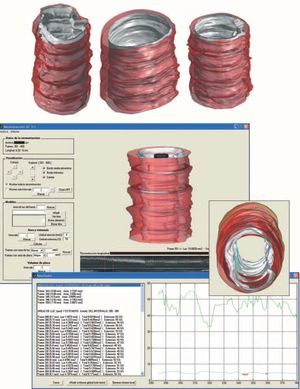
Once all the contours of the region to be reconstructed were obtained, 3D reconstruction was performed. The contour superimposition technique was used, assigning to each image (i.e., to each pair of media-adventitia and lumen contours) a thickness obtained from the catheter withdrawal rate (0.02 mm in this case). Lastly plotting options were applied to obtain adequate 3D modeling. Figure 3 shows several 3D reconstructions of arteries with plaque (upper panel) and an example of measurements taken automatically from a reconstruction (lower panel). The reconstruction can be stored in any electronic format for subsequent analysis.

Figure 3. (Upper panel) Examples of cross-section reconstruction for 5-mm long arteries. The media-adventitia border contour is shown in red, and the contour associated with the lumen in white. (Lower panel) Example of an automatic recording of the areas.
Sequences Analyzed
A total of 11 sequences were analyzed (total of 2300 images): 8 sequences of 250 successive images (each equivalent to a 5-mm length of vessel) and 3 sequences of 100 successive images (each equivalent to a 2-mm length of vessel). These sequences pertain to 11 consecutive patients who underwent an IVUS examination in our interventional cardiology unit. The sequences were selected randomly, and all pertained to native arteries (5 from the right coronary artery, 5 from the left anterior descending artery, and 1 from the circumflex artery) that had not been treated with angioplasty or intracoronary stenting.
Analysis of Variation
The proposed method was validated by manual quantification of the 2300 study images by the observer, followed by a comparison with the measurements obtained after automatic reconstruction of each sequence ("manual-automatic" variation).
In the manual analysis of each sequence, the vessel and lumen areas were assessed, as well as the presence of areas with severe lesion15: area <4 mm² (in all images) and the plaque volume (of the entire sequence), as well as the time taken for the analysis. These data were then compared to those obtained from the automatic analysis of the 3D reconstruction.
The "intra-manual" variability was calculated by quantifying a 100-image sequence two times manually (by the same observer about one month apart). The "intra-automatic" variability (variability of the method developed) was calculated by automatically quantifying this sequence two times (defining different contours). In both cases, the first measurement was defined as standard, and the error was assessed for the second. The standard variability (in mm²/mm²) was also obtained.
Statistical Analysis
Continuous variables are expressed as mean ± standard deviation and dichotomous variables as percentages. Correlations between continuous variables was analyzed by the intraclass correlation coefficient (ICC). Between-method variability (manual versus automatic) were assessed using Bland-Altman plots. These plots are used to compare two measurement techniques, in this case the manual and automatic methods. The error obtained for each pair of measurements (manual-automatic) is plotted on the y-axis, and the mean of the this pair of measurements on the x-axis. Significance was set at a P value of <.05. SPSS 11.0 (SPSS Inc, Chicago, Ill, USA) was used for all analyses.
RESULTS
Internal Variability of the Manual Method and Automatic Method
Values obtained for the internal variability in the manual method and the automatic method with respect to the lumen area, vessel area, and plaque volume are shown in the Table 1. The following section describe the variability of the proposed automatic method versus the manual measurement method to measure areas, calculate volumes, and analyze lesion severity and time expenditure.

Area Measurements
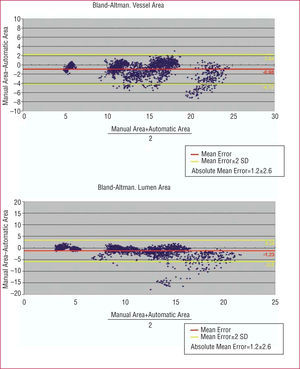
Bland-Altman plots with the vessel area (upper panel) and lumen area (lower panel) results in the 2300 images quantified are depicted in Figure 4. A mean error for the automatic versus manual method of 1.2±1.3 mm² was detected in the vessed area measurement (0.08±0.07 normalized with respect to the actual area, i.e., for each mm² of area, There vas an error of 0.08 mm²) is obtained in the vessel area measurement and 1.6±2.2 mm² in the lumen area measurement (0.11±0.11 normalized).

Figure 4. (Upper panel) Bland-Altman plot with the vessel area measurements obtained, using the manual and automatic methods. (Lower panel) Bland-Altman plot with the measurements obtained with the manual and automatic methods.
In 9 of 11 sequences (82%), the mean error of the automatic versus the manual method in quantifying the vessel and lumen areas was less than 1 mm² (0.86±0.86 mm² for the vessel and 0.77±0.71 mm² for the lumen) and in only 2 of the 11 sequences (18%), the error was greater than 2 mm² (2.56±1.69 mm² for the vessel and 3.75±3.43 mm² for the lumen). In these 2 sequences, there were frequent interruptions in the image due to catheter movement were detected, as well as large areas of shadow due to the presence of calcified plaque; when the 3D reconstruction of these cases were repeated with greater definition of intermediate points by the analyst the error in these 2 sequences was reduced to less than 1 mm² for both the vessel and the lumen area.
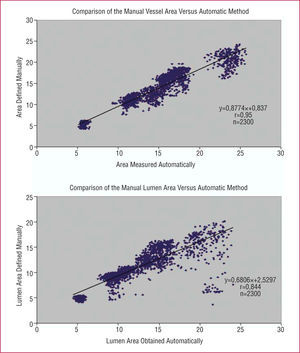
The intraclass correlation coefficient (ICC), used to measure the degree of agreement between the areas measured manually and automatically was 0.9709 (95% confidence interval [95% CI], 0.9682-0.9733), for vessel areas, and a value of 0.9039 (95% CI, 0.8951-0.9120) for lumen areas.
The close correlation between the measurements obtained using the manual and automatic methods is indicated in Figure 5. The few points with more scatter on the regression and Bland-Altman plots correspond to areas with sudden catheter movements or large areas of shadow in the two sequences mentioned above.

Figure 5. (Upper panel) Regression plot with the vessel area measurements obtained by the manual versus automatic method. (Lower panel) Comparison of the lumen area measurements obtained by the manual and automatic methods.
Lesion severity
Among the 11 sequences analyzed, 3 presented areas with lumen areas <4 mm2, according to the manual measurement taken by an experienced observer. The automatic method detected the existence of severe lesions in all 3 cases. Of the 240 images (10.4% of all images analyzed) in which manual measurement detected a lumen area <4 mm², the precision of the automatic method for identifying them was 91% (218 of 240). In the remaining of images, in which manual measurement did not detect a lumen areas <4 mm², the precision of the automatic method was of 99.4% (2047 of 2060).
Volume Calculation
Table 2 contains the results obtained for the eight 250-image sequences using the manual and automatic methods to calculate vessel, lumen, and plaque volumes. The mean error obtained in volume calculations using the automatic method versus the manual method was 4.9±5.2 mm³ for the vessel (0.06±0.05 standardizing with respect to the true volume, i.e., an error of 0.06 mm³ per mm³), 7±8.9 mm³ for the lumen (0.09±0.08, normalized), and 5.4±3.9 mm³ for the plaque (0.5±0.3, normalized).

Time Analysis
The average time taken to measure a 250-image sequence by manual analysis was 60±10 minutes. For the proposed automatic method, the mean time needed by the operator was 10±8 minutes (P<.0001 with respect to the manual analysis).
DISCUSSION
An initial experience in the 3D reconstruction and automatic quantification of IVUS sequences from real cases is presented using a computer method developed jointly by a group of interventional cardiologists and biomedical engineers. The results suggest that the method implemented is reliable, with little variability compared to manual assessment by an experienced analyst, highlighting its accuracy in the detection of vessel and lumen areas (standard error of approximately 0.1) and calculation of volumes (standard error <0.1 for vessel and lumen volumes). In the near future, this type of computer tool could allow considerable saving of time and human effort.
In recent years, IVUS has become an essential technique not only in daily practice,16 but also in several research fields related to ischemic heart disease3 and interventional cardiology.4 Our understanding of aspects such as unstable plaque, the pathophysiology of acute coronary syndrome, and post-angioplasty or post-stent restenosis processes, with all the implications for these conditions, has been enhanced in part due to the information obtained from IVUS.
In the daily practice of an interventional cardiology unit, decisions must be made quickly thus, the information to be obtained from IVUS in this regard is straightforward: lesion severity, lesion length, gross estimation of plaque composition, etc. All these data are quantified rapidly by means of the basic software included in the IVUS unit. Naturally, costly, comprehensive analyses of the entire recorded sequence are not necessary or recommended at this stage. In fact, current off-line analyses usually measure only a few images manually, in the range of 0.5-1 mm, in order to estimate the volumes, sacrificing some precision while still obtaining acceptable measurements quickly.
Nevertheless, research often requires quantification of sequences from thousands of images for a detailed assessment of plaque volume, lumen and vessel area, plaque composition, etc at several levels. In most of the main working groups and laboratories devoted to this field, the measurements tend to be done by a large staff consisting of cardiologists, technicians, and interns. The availability of a reliable automatic method for quantification would reduce the efforts devoted to this task, freeing up resources for other aspects.
Attempts carried out to date in this type of computer method5-9 have not yet become a general part of daily practice. Although the results are promising, the validation has usually been done with sequences containing only a few images,2,8,9 probably due to the difficulty for reconstruction in larger sequences due to factors such as the difficulty to correctly identify borders or image oscillations caused by catheter movements.
This study covered a very large series of 2300 images quantified automatically and their correspondence with the results resulting from manual measurement by an experienced observer. In 8 of the sequences, reconstructions were performed of 250 consecutive images (5 mm), a length that, although still short, is longer than in earlier series.2,8,9 The results obtained suggest that:
1. The method implemented allows a reliable reconstruction of IVUS sequences with a very small variability with respect to the manual measurement in most cases. Significant errors were only detected in a few points of two sequences (as shown in the regression and Bland-Altman plots). These errors were caused by multiple sudden movements of the catheter and by the appearance of large areas of shadow. In any case, these sequences are readily identifiable at the start of reconstruction and can be solved by adding more intermediate points (using the 2 methods proposed in our study) or in extreme cases, by recurring to the use of manual quantification. Moreover, the Bland-Altman plots show that greater scatter is associated with larger vessels: this implies a penalty that is evident in the mean and standard deviation values, but can be considered acceptable for clinical purposes, as was seen in the results obtained when standardizing the error.
2. A very significant reduction in the observer's time and effort was achieved in each case. The automatic method only required manual notation of the media-adventitia contour of the first image and a few intermediate images (completed in a few minutes at the start of the reconstruction). In contrast, manual measurement required delimiting the media-adventitia and lumen in each image (500 contours in a sequence of 250 images, with many more in longer sequences). Furthermore, automatic 3D reconstruction allows simple storage of the information that can be immediately retrieved at any time in a "user-friendly" format, making it possible to obtain considerable data (volume, area, and length of plaque, vessel or lumen for all or selected parts of the sequence, and areas with a vessel or lumen area below a predefined threshold, etc). The manual retrieval of this information is obviously much less dynamic and would use up time in a task that is not always gratifying.
Limitations
The sequences analyzed are longer than in previous studies, but still too short for immediate implementation of the proposed method in daily practice. Sequences previously treated with a stent were not presented; nevertheless it does not appear that this factor represents a limitation for automatic reconstructions. When identifying plaque composition, the radio frequency signal appears to provide more information than the video image.17,18 However, the initial experience of our group in automatic identification of plaque composition based on the intensity scale13 (which can be implemented as part of the 3D reconstruction) suggests a good correlation with the visual interpretation of an experienced observer.
CONCLUSIONS
This study reflects the need for cooperation between cardiologists and bioengineers in the field of cardiovascular imaging. The computer method described here represents an additional advance in automatic reconstruction and quantification of IVUS images; the associated limitations are related to more to the ultrasound image quality than to the reconstruction and quantification models. In the near future, tools such as the one presented or similar ones will help minimize the time and effort taken in the tedious tasks of manual quantification.
This work was funded by a grant from the Red de Centros de Investigación Cardiovascular-Fondo de Investigación Sanitaria (RECAVA-FIS) and a grant from the Autonomous Government of Valencia (Grupos04/042).
Correspondence: Dr. V. Bodí.
Servicio de Cardiología. Hospital Clínic i Universitari.
Avda. Blasco Ibáñez, 17. 46010 Valencia. España.
E-mail: vicentbodi@hotmail.com
Received October 14, 2005.
Accepted for publication March 23, 2006.