Keywords
INTRODUCTION
The effects of flecainide on myocardial tissue with its particular anisotropic structure have been the subject of various studies, including ones on its effect on longitudinal (LV) and transverse (TV) conduction velocities, and how the coupling interval influences this effect.1 However, the results have varied in that different authors have found that different effects predominate on LV and LV.2-5 The importance of studying the effects of flecainide on both velocities and the influence of the coupling interval on this effect is due to its possible relation to the proarrhythmic effects of the drug.6 If the effect of flecainide on longitudinal and transverse ventricular conduction velocities depends on the coupling interval, the predominance of the effects on the longitudinal direction compared to the transverse could depend on the coupling interval. Based on this hypothesis, our aim was to study the effects of flecainide on LV and TV with different coupling intervals in an isolated rabbit heart model, using high-resolution mapping techniques.
METHODS
The procedures followed in this study met the institutional standards and current guidelines for the care and use of laboratory animals.
Eleven isolated Langendorff-perfused rabbit heart preparations (California breed) were studied. Epicardial ventricular electrograms were taken with a plaque-electrode made up of 121 unipolar electrodes located in the left ventricular free wall. Ventricular stimulation was done with bipolar electrodes through 2-ms rectangular pulses at an intensity double the diastolic threshold.
On a basic 12-beat train S0-S0 (baseline cycle length of 250 ms) 2 extrastimuli were introduced at a decreasing coupling interval (S1, S2). S1 was coupled 10 ms above the minimum interval that produced ventricular capture, and the second extrastimulus (S2) added by applying the same procedure. Once the baseline study was completed, this was repeated 15 min after starting continuous flecainide perfusion at 1 µmol/L, a concentration within the range known to yield its characteristic electrophysiological effects7.
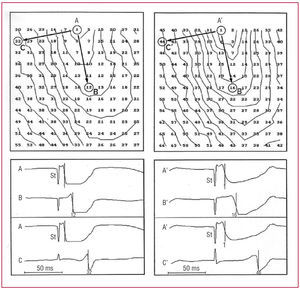
The LV and TV at S0, S1 and S2 were measured and compared before and after flecainide administration by analyzing epicardial activation maps based on the local activation time for each electrode. To this end, the separation was divided between 2 electrodes selected by the difference between their activation times, in both longitudinal and transverse directions (Figure 1). To compare the effects of the drug on conduction velocities and the influence of the coupling interval, the percentage decrease in the different velocities induced by the drug was calculated.

Figure 1. Maps of epicardial activation and selected electrodes obtained at baseline (left) and after flecainide perfusion (right) in one of the experiments (isochronal, 5-ms intervals). Left, baseline: LV (AB) = 45.4 cm/s; TV(AC) = 16.1 cm/s. Right, after flecainide: LV (A'B') = 33.3 cm/s; TV (A'C') = 11.1 cm/s. St indicates stimulus.
Comparisons between pairs of data were done using nonparametric statistical tests for related variables (Wilcoxon). Decreases in conduction velocities are expressed as percentages. A P value less than .05 was considered significant.
RESULTS
The LV and TV were measured before and after administering flecainide. The results are summarized in the Table.

Flecainide significantly decreased both LV and TV for all the coupling intervals studied (Figure 2).

Figure 2. The LV and TV are shown for each coupling interval studied (S0, S1, and S2), at baseline and after flecainide. *P<.05. NS indicates not significant.
There was a trend at baseline for LV to progressively decrease with decreased coupling intervals, which was not seen for TV. After administering the drug, this trend reached statistical significance only for LV (Figure 2).
The percentage decrease in TV was greater than in LV only in the case of S0 (Figure 3). That is, flecainide reduced TV to a greater extent than LV at the longest coupling interval (250 ms), whereas this capacity was lost as the coupling interval decreased, with both velocities being affected similarly.

Figure 3. Percentage decreases (PD) in longitudinal (LV) and transverse (TV) conduction velocity induced by flecainide for S0, S1, and S2 are shown and compared. NS indicates not significant. *P<.05.
DISCUSSION
Flecainide significantly decreased both conduction velocities for each coupling interval used, due to powerfully blocking the fast Na+ inflow current to cardiomyocyte.8 Most authors have reached the same conclusion when studying both healthy3 and pathological1,9 cardiac tissue.
According to our results, the coupling interval influences the effects of flecainide on LV, which has been described by other authors in clinical2 and experimental3 studies. However, in line with our results, none of these authors has described this effect on TV. The coupling interval-dependent effect of flecainide has been associated with several mechanisms,1 such as the drug channel's slow recovery kinetics or the longer 0-phase action potential duration with early extrastimuli11 (factors involving longer drug-channel activation time).
Flecainide has shown a greater effect on TV only with long coupling intervals (250 ms). Different working groups studying the effects of flecainide on both velocities have obtained disparate results. Some authors have found the drug has a greater effect on LV,4 others have found a greater effect on TV3 and yet others have found a similar effect on both.5 This disparity was probably influenced by the fact that the analysis of these effects should be related to the coupling interval used. The importance of studying the effects of flecainide on LV and TV is due to the fact that its proarrhythmic effect could be explained through its interaction with the anisotropic ventricular tissue.3,4 The greatest effect of the drug on TV with long coupling intervals and the influence of the coupling interval (that emerge from our study) could lead to the appearance of areas of functional block and reentrant arrhythmias.12
Limitations
No control group was used in the present study to rule out any observer effects due to variations in the preparations. However, previous studies using the same type of experimental preparation have verified its stability in periods similar to those used in this work.13-15
In conclusion, the effect of flecainide on ventricular conduction velocities depends on the coupling interval. The drug produced a greater reduction in LV with decreasing coupling intervals, which was not found in the case of TV. The predominance of its effects on the longitudinal or transverse direction also depend on the coupling interval such that the effect on TV is greater with longer coupling intervals, but is the same on both velocities with shorter coupling intervals.
Correspondence: Dr. A. Ferrero.
Servicio de Cardiología. Hospital Clínico Universitario.
Avda. Blasco Ibáñez, 17. 46010 Valencia. España.
E-mail: angelferrero@hotmail.com
Received April 10, 2006.
Accepted for publication September 28, 2006.