Since its introduction about 15 years ago, coronary computed tomography angiography has become today the most accurate clinical instrument for noninvasive assessment of coronary atherosclerosis. Important technical developments have led to a continuous stream of new clinical applications together with a significant reduction in radiation dose exposure. Latest generation computed tomography scanners (≥ 64 slices) allow the possibility of performing static or dynamic perfusion imaging during stress by using coronary vasodilator agents (adenosine, dipyridamole, or regadenoson), combining both functional and anatomical information in the same examination. In this article, the emerging role and state-of-the-art of myocardial computed tomography perfusion imaging are reviewed and are illustrated by clinical cases from our experience with a second-generation dual-source 128-slice scanner (Somatom Definition Flash, Siemens; Erlangen, Germany). Technical aspects, data analysis, diagnostic accuracy, radiation dose and future prospects are reviewed.
Keywords
A number of advances during the last 15 years have seen coronary computed tomography angiography (CTA) become one of the mainstay diagnostic tools for noninvasive assessment of coronary atherosclerosis in patients with a low-to-intermediate probability of coronary artery disease (CAD).1–4 Coronary CTA demonstrates high sensitivity and negative predictive value in determining significant stenosis (≥ 50% lumen reduction), approaching 100%.1–4 However, based solely on the morphological characteristics of the coronary lesions, the hemodynamic significance of the stenosis cannot be determined, especially that of intermediate-grade stenosis (40%-70% lumen reduction), as demonstrated by studies of invasive fractional flow reserve (FFR) measurements.5 The landmark FAME trial has demonstrated that an FFR-guided percutaneous coronary intervention approach is superior to treatment with a percutaneous coronary intervention based solely on visual angiographic assessment of coronary lesions, with an improved clinical outcome and a positive economic impact on health care cost.5 To date, the 2 largest randomized controlled trials, the COURAGE6 and BARI 2D7 trials, have failed to show that percutaneous coronary intervention based solely on a standard visual approach is superior to optimal medical therapy in reducing mortality or recurrent myocardial infarction. Therefore, these studies suggest that functional assessment of coronary lesions may help to identify patients who may benefit from revascularization in stable CAD. Moreover, studies correlating the anatomic information of coronary CTA with single-photon emission computed tomography (SPECT) have demonstrated a moderate positive predictive value (about 50%) of CTA in determining inducible myocardial ischemia.8,9 For these reasons, in clinical practice, morphological information obtained with coronary CTA often requires integration with functional imaging tests such as SPECT, positron emission tomography, or magnetic resonance imaging (MRI) during pharmacological stress to highlight perfusion defects, with an impact on patient management and prognosis. However, the latest-generation computed tomography (CT) scanners (≥ 64 slices) allow static and dynamic CT perfusion (CTP) to be obtained during stress by using coronary vasodilator agents (adenosine, dipyridamole, or regadenoson), combining both functional and anatomical information in the same examination, which are essential in state-of-the-art patient management.2,5 In this article, the emerging role and state-of-the-art of myocardial CTP during pharmacological stress are reviewed and illustrated by clinical cases from our preliminary experience with a second-generation 128-slice dual-source CT (DSCT) scanner (Somatom Definition Flash, Siemens; Germany). Technical aspects, data analysis, diagnostic accuracy, radiation dose and the possible future role of this innovation are reviewed.
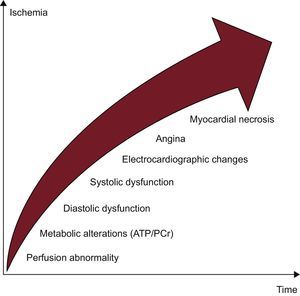
PHYSIOPATHOLOGY OF ISCHEMIAMyocardial perfusion is a highly regulated process influenced by numerous factors, such as epicardial vessels, resistance vessels, and endothelium.10 At rest, the myocardium oxygen extraction rate is very high (75%-80%) and, whenever demands increase, the myocardium can supply incrementing coronary blood flow and oxygen delivery.10 Ischemia can occur secondary to reduced coronary blood flow/perfusion pressure not compensated by the autoregulation process, which is the ability to maintain a relatively stable coronary perfusion over a wide range of perfusion pressures due to dilation of resistance vessels. Coronary blood flow at rest is not compromised by epicardial stenosis of up to 85%-90% but, in the presence of maximal hyperemia, it decreases with stenosis of > 45%.10 Moreover, the physiological effect of stenosis also depends on the degree of compensation of the distal microcirculatory bed.10,11 The ischemic process initially involves the subendocardial layer with an endo-subpericardial front causing a cascade of physiopathological events among which perfusion reduction is an early change (Figure 1).10 For these reasons, stress tests evaluating this parameter are more sensitive in identifying hemodynamically significant stenosis than analysis of the stress-induced wall motion abnormalities or electrocardiogram (ECG) changes alone (Figure 1).10
ACQUISITION MODALITY
Myocardial stress CTP images can be acquired in either a static or dynamic mode. Static CTP imaging acquires a single temporal phase during the arterial first-pass of the contrast agent.12 Among static techniques, the recently introduced dual-energy (DE) acquisition is one of the most promising techniques and consists of the use of different X-ray spectra generated by different tube voltages.13,14 Dynamic time-resolved CTP acquisition allows the acquisition of multiple consecutive contrast-enhanced phases as the contrast bolus transits the myocardium, in a manner similar to stress-MRI.12 By obtaining time attenuation curve (TAC) computation, dynamic acquisition enables perfusion parameters to be calculated from mathematical modeling.9
Monoenergetic Static AcquisitionA single stationary contrast-enhanced first-pass arterial acquisition during pharmacological stress is performed. Optimization of the timing of image acquisition is therefore crucial to acquire the dataset during the peak of myocardial enhancement.15,16 Several acquisition techniques are available with a progressive reduction in dose profile and contrast media administration: retrospective ECG-gating (with prospective tube current modulation),17,18 prospective ECG-gating,19,20 and prospectively ECG-triggered high-pitch spiral acquisition implemented with the second-generation 128-slice DSCT scanner.21,22
Static Acquisition With the Dual-energy TechniqueThe DE technique allows quantitative analysis through evaluation of iodine distribution during the first-pass phase of the contrast agents based on their X-ray absorption characteristics at different X-ray tube voltage settings (kV), which affect the X-ray energy levels.23 Dual-energy acquisition can be performed with a DSCT scanner with 2 tubes simultaneously emitting higher (140-150kV) and lower (80-90-100kV) energy levels.23,24 A second approach consists of a single-source CT scanner with fast tube voltage switching (from 80kV to 140kV) either in a single gantry rotation (GSI Cardiac, GE Healthcare) or in consecutive rotations (Acquilion One, Toshiba).9 Another possibility still under investigation is the double-layer approach with 2 overlaid detectors made of different materials (Philips Medical Systems prototype).9
The introduction of the second-21 or third-generation25 DSCT scanners with high temporal resolution (75ms or 66ms, respectively) can overcome cardiac motion artifacts of the DE CTP, especially in patients with a high heart rate and high heart rate variability.
Dynamic Computed Tomography Perfusion AcquisitionDynamic CTP acquisition allows the quantification of myocardial blood flow and volume and potentially of other hemodynamic parameters, through the mathematical elaboration of TAC.9 Dynamic CTP imaging requires a sufficiently high temporal resolution to image heart rates at stress and a detector array sufficiently wide to image the entire myocardium in rapid succession. Whole-heart coverage can be achieved using a single-tube scanner with a 256-slice wide-detector CT system while the table is stationary with a coverage of 78mm,26 or by using a DSCT scanner with the shuttle mode.27,28 In the shuttle mode, the table moves back and forth in 2 alternate scanning positions covering a total of 73mm.27,28 The newly introduced third-generation DSCT scanner with 192 detectors allows for a wider Z-coverage of 105mm, with the possibility of also studying larger or dilated hearts.25 For both modalities (stationary table or shuttle mode), data are acquired for approximately 30 s during the longitudinal systolic shortening of the left ventricle, when the left ventricular myocardium is thicker, providing a more robust set for perfusion analysis. The amount of contrast medium administered is usually 50mL followed by 50mL of saline at 5-6mL/s.16,27
EXAMINATION PROTOCOLCombined coronary CTA and CTP protocols can be performed with a rest/stress or a stress/rest protocol. Both phases are necessary to accurately differentiate between ischemic and necrotic myocardium. Generally, static rest perfusion evaluation is derived from the anatomical acquisition of the coronary arteries; otherwise, a dynamic perfusion acquisition in both stress and rest states can be performed for quantitative coronary flow reserve measurements.28
The stress CTP scan is acquired during drug-induced arteriolar vasodilation (using dipyridamole, adenosine, or regadenoson) by both direct and endothelium-mediated mechanisms with a 3.5- to 4-fold increase in myocardial blood flow.10 Adenosine nonselectively activates 4 receptor subtypes: A1, A2A, A2B, and A3, of which only A2A receptor activation vasodilates the coronary arterial beds, increases myocardial blood flow, and causes sympathoexcitation; the activation of the other receptors produces short-term undesirable side effects.29 Dipyridamole increases endogenous adenosine levels by reducing its uptake from endothelial cells.10 Both adenosine and dipyridamole may cause bronchospasm in patients with asthma and chronic obstructive pulmonary disease, while the newly introduced regadenoson, a selective A2A receptor agonist, may be safely used in these patients.29 Other common contraindications are severe AV block without PM, sinus bradycardia, systemic hypotension (blood pressure < 90mmHg), and severe carotid stenosis. These drugs, by dilating the small resistance arterioles, reduce the perfusion pressure beyond the stenosis and, by increasing subepicardial blood flow, suppress the autoregulation mechanism (transmural coronary steal phenomenon). This results in a progressive reduction of the downstream flow as the entity of the stenosis increases.10,12 All these agents have demonstrated good sensitivity and specificity; dipyridamole has the advantage of being inexpensive but has a longer vasodilation effect (several minutes instead of a few seconds with adenosine) that requires aminophylline antagonism (slow intravenous injection of 50mg to 250mg).12 Complications are related to systemic vasodilation (tachycardia, hypotension, flushing, headache, and dizziness) and to the induction of myocardial ischemia (chest pain, dyspnea, ST-segment depression), ventricular tachycardia or transient atrio-ventricular block.12,29 Before the examination, patients are advised to avoid drug antagonists such as methylxanthines contained in products such as coffee, tea, chocolate, energy drinks, or brochodilators.9 Dobutamine, a synthetic β1- and β 2-receptor agonist, is commonly used in stress echocardiography for wall motion analysis and currently has no clinical role in CTP imaging.10,12
Two intravenous access sites are required to inject the stress agent and contrast media. Adenosine is infused at a standard rate of 0.14mg/kg/min for 3 to 5minutes with an infusion pump, while dipyridamole is infused in a dose of 0.56mg/kg to 0.84mg/kg over a 4 to 6minute period.10,12 Conversely, regadenoson can be administered in a single dose (400μg).29 During the examination, heart rate is constantly monitored with a 12-lead ECG as well as blood pressure and oxygen saturation. The patient is repeatedly asked about the occurrence of any symptoms, which generally disappear when the drug injection is suspended or when an antagonist is administered.
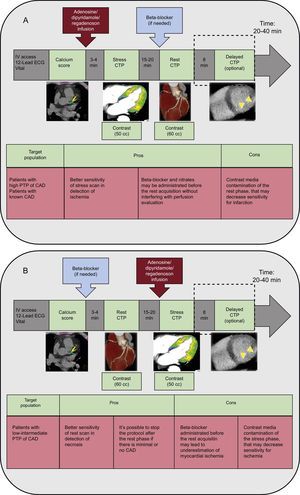
Several protocols have been proposed and are published in the literature with their advantages and disadvantages (Figure 2).9,12 The stress/rest CTP protocol, which allows more sensitive detection of ischemia, should preferably be used in patients with a high pretest probability of CAD or with known CAD, in whom extensive calcifications, multivessel disease or prior stent implantation may reduce coronary CTA accuracy in the evaluation of CAD. Conversely, the rest/stress CTP protocol should be the first choice in patients with a low-to-intermediate pretest probability of CAD, which allows discontinuation of the protocol when absent or minimal CAD is detected during the rest phase, reserving pharmacologic stress for patients with moderate-to-severe CAD (Figure 2).9,12
 and rest-stress (B) computed tomography myocardial perfusion protocols with advantages (pros) and disadvantages (cons). CTP, computed tomography perfusion imaging; CAD, coronary artery disease; ECG, electrocardiogram; IV, intravenous; PTP, pre-test probability of coronary artery disease.")
Stress-rest (A) and rest-stress (B) computed tomography myocardial perfusion protocols with advantages (pros) and disadvantages (cons). CTP, computed tomography perfusion imaging; CAD, coronary artery disease; ECG, electrocardiogram; IV, intravenous; PTP, pre-test probability of coronary artery disease.
Although it is still experimental, a late sequence at 8 to 10minutes can be added without further contrast material injection to reveal the presence of late myocardial enhancement, which indicates nonviable myocardium; low voltage (70-80-90-100kV) protocols should be preferred due to the specific characteristic CT attenuation spectrum of iodine with high attenuation at low photon energies.23 However, a late-enhancement scan is not mandatory in clinical practice due to the relatively poorer signal-to-noise and contrast-to-noise ratios of CT compared with MRI and the difficulty of assessing the transmural extent of the infarct.12,24
DATA POSTPROCESSINGQualitative and Static Quantitative AnalysisStress CTP qualitative analysis is performed by visual analysis of the images acquired during stress and rest conditions, using a standard of normality learned with experience. Images are interpreted based on the presence, location, and extension of the perfusion defect using standard cardiac long-axis and short-axis planes.30 Thick multiplanar reconstruction of approximately 5mm to 8mm is usually preferred to optimize the contrast-to-noise ratio.12,30 Qualitative assessment may be aided by evaluation of myocardial attenuation through measurements of the signal density levels within the myocardium. Automatic software employing “bull's eye” plot of the transmural perfusion ratio (an endocardial-to-mean epicardial ratio of attenuation values), a semiquantitative index parameter initially validated for stress MRI, has been implemented to aid CTP analysis; however, it seems to be unreliable in the presence of prior infarction or significant beam-hardening or motion artifacts.30
In addition to qualitative analysis, the DE technique also allows quantitative analysis. From the raw data of the DE scan, 2 datasets at different kV are extracted, obtaining a merged dataset combining the reduced noise of the high energy level (140-150kV) together with the high contrast resolution of the low energy level (80-90-100kV), resulting in better differentiation of normal and hypoperfused myocardium.23 By exploiting the DE information, a color-coded iodine distribution map–a surrogate marker of myocardial blood supply–may be obtained and overlapped with the virtual-noncontrast reconstruction (Figure 3).13,23 The DE technique allows quantification of the per-voxel amount of iodine concentration within the myocardium expressed in mg/mL (Figure 3), a surrogate marker of myocardial blood supply.23 Furthermore, due to its ability to generate monochromatic image reconstructions, the DE technique has been shown to mitigate or even eliminate beam hardening artifacts related to cardiac geometry and iodinated contrast material occasionally resembling perfusion defects and commonly observed at the left ventricular posterobasal wall.9
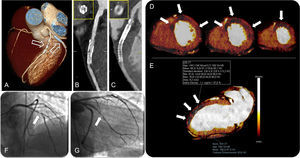
 showing a stent in the middle segment of the left anterior descending artery and double stenting in the proximal main obtuse marginal branch (arrows). Curved planar reformations of the left anterior descending artery (B) and the obtuse marginal branch (C) with the corresponding perpendicular views, showing in-stent restenosis. Myocardial short-axis color-coded iodine distribution maps of computed tomography dual-energy perfusion imaging from middle to apical segments show perfusion defects at the antero-septal, anterior, antero-lateral and lateral wall corresponding to the territory of the left anterior descending artery and left circumflex artery (arrows in D). Quantitative analysis of the dual-energy map at the level of the anterior wall (arrows) shows a 37% reduction in iodine content with respect to the remote myocardium at the inferior wall (E). Invasive coronary angiography confirmed the in-stent restenosis of the left anterior descending artery (arrow in F) and the obtuse marginal branch (arrow in G). AF, atrial fibrillation; CT, computed tomography; RF, radiofrequency; ROI, region of interest.")
A three-dimensional volume rendered computed tomography image (A) showing a stent in the middle segment of the left anterior descending artery and double stenting in the proximal main obtuse marginal branch (arrows). Curved planar reformations of the left anterior descending artery (B) and the obtuse marginal branch (C) with the corresponding perpendicular views, showing in-stent restenosis. Myocardial short-axis color-coded iodine distribution maps of computed tomography dual-energy perfusion imaging from middle to apical segments show perfusion defects at the antero-septal, anterior, antero-lateral and lateral wall corresponding to the territory of the left anterior descending artery and left circumflex artery (arrows in D). Quantitative analysis of the dual-energy map at the level of the anterior wall (arrows) shows a 37% reduction in iodine content with respect to the remote myocardium at the inferior wall (E). Invasive coronary angiography confirmed the in-stent restenosis of the left anterior descending artery (arrow in F) and the obtuse marginal branch (arrow in G). AF, atrial fibrillation; CT, computed tomography; RF, radiofrequency; ROI, region of interest.
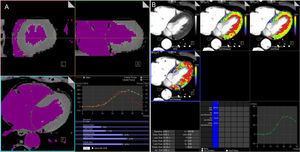
Dynamic CTP imaging allows either a semiquantitative or a fully quantitative perfusion analysis.9 Simple semiquantitative metrics, in a manner similar for stress MRI perfusion, allow for evaluation of blood flow kinetic parameters derived from the upslope of the TAC (time-to-peak, peak enhancement, upslope, and the area under the curve).9,10,26,28 Since semiquantitative analysis needs computation of only the upslope part of the TAC, a lesser temporal sampling is required with a reduced radiation dose. Conversely, absolute myocardial perfusion quantification requires a complete first-pass coverage of the myocardium and is based on a dedicated algorithm that has been successfully used previously in MRI studies.9,10 For a quantitative analysis using a DSCT scanner, a modified parametric deconvolution technique based on a 2-compartment model of intra- and extravascular space to fit the TAC is used.9,28 The volumetric images dataset (≈10-15 sets of data) is processed using dedicated commercial perfusion software on a standard workstation (Syngo VPCT body-myocardium, Siemens Healthcare; Erlangen, Germany). After double-sampling of the AIF (arterial input function), the mathematical elaboration of the TAC enables calculation of the myocardial blood flow (MBF) in mL/100mL/min and the myocardial blood volume (MBV) in mL/100mL of each voxel, generating a 3D color-coded map representation (Figure 4). Myocardial blood flow and MBV are computed according to the following equations:

 obtained with a second-generation dual-source 128 slice computed tomography scanner are processed with dedicated volume perfusion software. The algorithm double-sampled the arterial input function from regions of interest that were placed in the descending aorta at the cranial and caudal ends of the 2 image stacks, and combined into one arterial input function that has twice the sampling rate of the tissue time-attenuation curve. B: for each voxel, estimated myocardial blood flow (mL/100mL/min) and myocardial blood volume (mL/100mL) may be calculated by parametric deconvolution technique based on a 2-compartment model of intra- and extravascular space to fit the time attenuation curve. Other hemodynamic parameters can be derived, such as the transit-constant (Ktrans, mL/100mL/min), which describes permeability by calculating volume transfer between blood plasma and the extracellular extravascular space. Myocardial perfusion is represented with a 3-dimensional color-coded map.")
A: dynamic volumetric images datasets (≈ 10-15 sets of data) obtained with a second-generation dual-source 128 slice computed tomography scanner are processed with dedicated volume perfusion software. The algorithm double-sampled the arterial input function from regions of interest that were placed in the descending aorta at the cranial and caudal ends of the 2 image stacks, and combined into one arterial input function that has twice the sampling rate of the tissue time-attenuation curve. B: for each voxel, estimated myocardial blood flow (mL/100mL/min) and myocardial blood volume (mL/100mL) may be calculated by parametric deconvolution technique based on a 2-compartment model of intra- and extravascular space to fit the time attenuation curve. Other hemodynamic parameters can be derived, such as the transit-constant (Ktrans, mL/100mL/min), which describes permeability by calculating volume transfer between blood plasma and the extracellular extravascular space. Myocardial perfusion is represented with a 3-dimensional color-coded map.
Semiautomated software enabling a polar plot display of the modified 17-segment American Heart Association myocardial model is now available, with a substantially reduced analysis times and improvement in the standardization of the perfusion analysis.
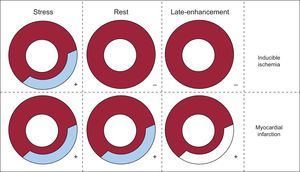
IMAGE INTERPRETATIONSimilar to SPECT image and MRI interpretation, demonstration of a stress perfusion defect partially or totally reversible at rest indicates the presence of ischemic but viable myocardium; conversely, a matching defect on stress and rest images indicates a fixed defect consistent with the presence of myocardial necrosis (Figure 5).12,30 The DE CTP technique, by means of 3-dimensional color-coded map representation of the static distribution of the contrast media during the time-frame of image acquisition,13,23 shows a reduced iodine content in the ischemic or necrotic myocardium compared with the remote myocardium (Figure 3).
; when the perfusion defect persists at rest imaging it indicates the presence of myocardial infarction.")
Guide to computed tomography myocardial perfusion imaging analysis. The demonstration of a stress perfusion defect partially or totally reversible at rest indicates the presence of ischemic but viable myocardium (inducible ischemia); when the perfusion defect persists at rest imaging it indicates the presence of myocardial infarction.
Dynamic stress CTP demonstrates reduced MBF and MBV in the segments corresponding to the perfusion defects, due to inducible ischemia or infarction (Figure 6). Furthermore, analysis of TAC allows differentiation of ischemic from necrotic myocardium. Ischemic but viable myocardium shows a decreased wash-in with a delayed and reduced peak enhancement and a conserved wash-out compared with remote myocardium, whereas necrotic myocardium demonstrates a reduction in both wash-in and wash-out rates in the areas of scarring and necrosis (Figure 6). The integration of CTP analysis with coronary anatomical data is a crucial step for image interpretation and enables determination of whether a perfusion defect matches a region supplied by a stenotic coronary artery, thus determining the hemodynamic significance of coronary lesions (Figure 6). It is important to be aware of the variation of the vascular territory distribution in myocardial perfusion, which accounts for coronary anatomy variability. Moreover, reversible perfusion defects can be localized in the distribution territory of normal epicardial coronary arteries if there is microvascular and/or endothelial dysfunction.10,11
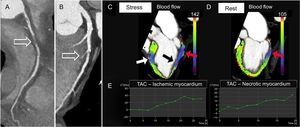
 and a critical stenosis (> 70%) of the middle segment of the left anterior descending artery due to a mixed atherosclerotic plaque with involvement of the second septal perforating branch (arrow in B). Three-dimensional color-coded oblique 2-chamber computed tomography perfusion images at stress (C) and rest (D) show a reversible perfusion defect in the territory of the left anterior descending artery (middle antero-septal wall, color-coded in blue, white arrow in C), consistent with inducible ischemia, and a fixed perfusion defect in the territory of the right coronary artery (proximal inferior wall color-coded in blue-violet, red arrows in C and D), indicating myocardial necrosis. Note also a reversible defect in the territory of the right coronary artery (middle inferior wall, color-coded in blue, black arrow in C) indicating peri-infarct ischemia. The corresponding tissue time-attenuation curves of the ischemic (E, left image) and necrotic (E, right image) myocardium, respectively at the antero-septal and inferior wall, demonstrate a decreased wash-in with a delayed and reduced peak enhancement, especially in the area of scarring. During stress, a significant reduction was observed in both myocardial blood flow and myocardial blood volume of the necrotic (blood flow = 50 ± 14mL/100mL/min; blood volume = 7 ± 2mL/100mL) and ischemic (blood flow = 65 ± 15mL/100mL/min; blood volume= 10 ± 2mL/100mL) myocardium. TAC, time attenuation curve.")
Curved planar reformation demonstrating chronic total occlusion of the proximal-mid right coronary artery (arrow in A) and a critical stenosis (> 70%) of the middle segment of the left anterior descending artery due to a mixed atherosclerotic plaque with involvement of the second septal perforating branch (arrow in B). Three-dimensional color-coded oblique 2-chamber computed tomography perfusion images at stress (C) and rest (D) show a reversible perfusion defect in the territory of the left anterior descending artery (middle antero-septal wall, color-coded in blue, white arrow in C), consistent with inducible ischemia, and a fixed perfusion defect in the territory of the right coronary artery (proximal inferior wall color-coded in blue-violet, red arrows in C and D), indicating myocardial necrosis. Note also a reversible defect in the territory of the right coronary artery (middle inferior wall, color-coded in blue, black arrow in C) indicating peri-infarct ischemia. The corresponding tissue time-attenuation curves of the ischemic (E, left image) and necrotic (E, right image) myocardium, respectively at the antero-septal and inferior wall, demonstrate a decreased wash-in with a delayed and reduced peak enhancement, especially in the area of scarring. During stress, a significant reduction was observed in both myocardial blood flow and myocardial blood volume of the necrotic (blood flow = 50 ± 14mL/100mL/min; blood volume = 7 ± 2mL/100mL) and ischemic (blood flow = 65 ± 15mL/100mL/min; blood volume= 10 ± 2mL/100mL) myocardium. TAC, time attenuation curve.
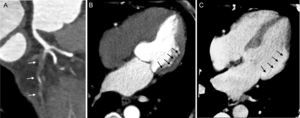
Iodinated contrast media, as well as Gd-based contrast agents used in MRI, are trapped and accumulate in the intracellular space of irreversibly damaged myocardiocytes after myocardial infarction or in the expanded extracellular space due to fibrous scar tissue: these necrotic/fibrotic lesions can be demonstrated as hyperdense areas (hyper-enhancement) in a late sequence obtained 8 to 10minutes after contrast media injection (Figure 7).24
. A 4-chamber rest computed tomography perfusion image acquired during first-pass enhancement showing a large perfusion defect at the lateral wall (arrows, B) in the territory of the left circumflex artery. Corresponding 4-chamber late-enhancement image obtained at 8minutes using a low voltage (80kV) protocol demonstrating hyper-enhancement due to myocardial necrosis (arrows, C).")
Curved planar reformation demonstrating chronic total occlusion at the ostium of the left circumflex artery (arrows, A). A 4-chamber rest computed tomography perfusion image acquired during first-pass enhancement showing a large perfusion defect at the lateral wall (arrows, B) in the territory of the left circumflex artery. Corresponding 4-chamber late-enhancement image obtained at 8minutes using a low voltage (80kV) protocol demonstrating hyper-enhancement due to myocardial necrosis (arrows, C).
During the last decade, several technological improvements have allowed a drastic reduction in the dose profile associated with coronary CTA together with an improvement in image quality. Accordingly, from an initial 20 mSV, the dose can now be reduced as low as 2 mSv or less by means of prospective ECG triggering, including the high-pitch spiral and iterative reconstruction methods.21,22
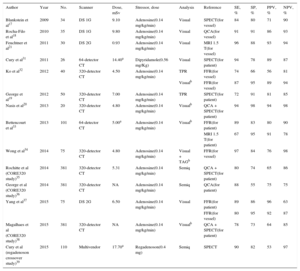
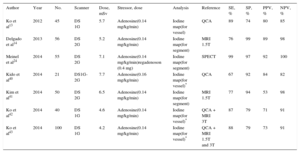
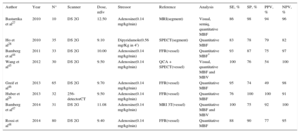
Tables 1 and 2 show the radiation dose, scanning protocols, and diagnostic accuracy of static CTP. The reported effective dose is in the range of 4.2mSv to 7.7mSv with the DE modality and is 5 mSv or less with the prospective ECG-gating monoenergetic technique, approaching 1 mSv with the high-pitch spiral acquisition of the DSCT scanner system (Tables 1 and 2). Accordingly, a complete stress/rest protocol by means of high-pitch 128-slice DSCT scanner may result in a radiation dose as low as 2.5 mSv, while maintaining a sensitivity of 96% and a specificity of 88% compared with cardiac MRI on a vessel level.21 Conversely, the effective dose of dynamic CTP is fairly variable, ranging from 3.8 mSv16 to 12.5 mSv,27 and is strictly dependent on protocol optimization16 (Table 3). As a result, a combined rest/stress dynamic CTP study with 100kV can require a mean radiation dose of 18 mSv.28 This value may be consistently decreased using recent technical developments, including the low voltages (70 kV to 80 kV) acquisition and iterative reconstruction.49,50
Static Computed Tomography Perfusion Imaging
| Author | Year | No. | Scanner | Dose, mSv | Stressor, dose | Analysis | Reference | SE, % | SP, % | PPV, % | NPV, % |
|---|---|---|---|---|---|---|---|---|---|---|---|
| Blankstein et al17 | 2009 | 34 | DS 1G | 9.10 | Adenosine(0.14 mg/kg/min) | Visual | SPECT(for vessel) | 84 | 80 | 71 | 90 |
| Rocha-Filo et al18 | 2010 | 35 | DS 1G | 9.80 | Adenosine(0.14 mg/kg/min) | Visual | QCA(for vessel) | 91 | 91 | 86 | 93 |
| Feuchtner et al21 | 2011 | 30 | DS 2G | 0.93 | Adenosine(0.14 mg/kg/min) | Visual | MRI 1.5 T(for vessel) | 96 | 88 | 93 | 94 |
| Cury et al31 | 2011 | 26 | 64-detector CT | 14.40a | Dipyridamole(0.56 mg/Kg) | Visual | SPECT(for patient) | 94 | 78 | 89 | 87 |
| Ko et al32 | 2012 | 40 | 320-detector CT | 4.50 | Adenosine(0.14 mg/kg/min) | TPR | FFR(for vessel) | 74 | 66 | 56 | 81 |
| Visualb | FFR(for vessel) | 87 | 95 | 89 | 94 | ||||||
| George et al19 | 2012 | 50 | 320-detector CT | 7.00 | Adenosine(0.14 mg/kg/min) | TPR | SPECT(for patient) | 72 | 91 | 81 | 85 |
| Nasis et al20 | 2013 | 20 | 320-detector CT | 4.80 | Adenosine(0.14 mg/kg/min) | Visualb | QCA + SPECT(for patient) | 94 | 98 | 94 | 98 |
| Bettencourt et al33 | 2013 | 101 | 64-detector CT | 5.00a | Adenosine(0.14 mg/kg/min) | Visualb | FFR(for patient) | 89 | 83 | 80 | 90 |
| MRI 1.5 T(for patient) | 67 | 95 | 91 | 78 | |||||||
| Wong et al34 | 2014 | 75 | 320-detector CT | 4.80 | Adenosine(0.14 mg/kg/min) | Visual + TAGb | FFR(for vessel) | 97 | 84 | 76 | 98 |
| Rochitte et al (CORE320 study)35 | 2014 | 381 | 320-detector CT | 5.31 | Adenosine(0.14 mg/kg/min) | Semiq | QCA + SPECT(for patient) | 80 | 74 | 65 | 86 |
| George et al (CORE320 study)36 | 2014 | 381 | 320-detector CT | NA | Adenosine(0.14 mg/kg/min) | Semiq | QCA(for patient) | 88 | 55 | 75 | 75 |
| Yang et al37 | 2015 | 75 | DS 2G | 6.50 | Adenosine(0.14 mg/kg/min) | Visual | FFR(for patient) | 89 | 86 | 96 | 63 |
| FFR(for vessel) | 80 | 95 | 92 | 87 | |||||||
| Magalhaes et al (CORE320 study)38 | 2015 | 381 | 320-detector CT | NA | Adenosine(0.14 mg/kg/min) | Visualb | QCA + SPECT(for patient) | 78 | 73 | 64 | 85 |
| Cury et al (regadenoson crossover study)39 | 2015 | 110 | Multivendor | 17.70a | Regadenoson(0.4 mg) | Semiq | SPECT | 90 | 82 | 53 | 97 |
1G, first generation; 2G, second generation; CT, computed tomography; DS, dual-source scanner; FFR, fractional flow reserve; MRI, magnetic resonance imaging; N°, patients’ number; NA, nonassessable; NPV, negative predictive value; PPV, positive predictive value; QCA, quantitative coronary angiography; SE, sensitivity; Semiq, semiquantitative analysis using a stress score; SP, specificity; SPECT, single-photon emission computed tomography; TAG, transluminal attenuation gradient; TPR, transmural perfusion ratio.
Static Dual-energy Computed Tomography Perfusion Imaging
| Author | Year | No. | Scanner | Dose, mSv | Stressor, dose | Analysis | Reference | SE, % | SP, % | PPV, % | NPV, % |
|---|---|---|---|---|---|---|---|---|---|---|---|
| Ko et al13 | 2012 | 45 | DS 1G | 5.7 | Adenosine(0.14 mg/kg/min) | Iodine map(for vessel) | QCA | 89 | 74 | 80 | 85 |
| Delgado et al14 | 2013 | 56 | DS 2G | 5.2 | Adenosine(0.14 mg/kg/min) | Iodine map(for segment) | MRI 1.5T | 76 | 99 | 89 | 98 |
| Meinel et al24 | 2014 | 55 | DS 2G | 7.1 | Adenosine(0.14 mg/kg/min)regadenoson (0.4 mg) | Iodine map(for segment) | SPECT | 99 | 97 | 92 | 100 |
| Kido et al40 | 2014 | 21 | DS1G-2G | 7.7 | Adenosine(0.16 mg/kg/min) | Iodine map(for vessel)* | QCA | 67 | 92 | 84 | 82 |
| Kim et al41 | 2014 | 50 | DS 2G | 6.5 | Adenosine(0.14 mg/kg/min) | Iodine map(for segment) | MRI 1.5T | 77 | 94 | 53 | 98 |
| Ko et al42 | 2014 | 40 | DS 1G | 4.6 | Adenosine(0.14 mg/kg/min) | Iodine map(for vessel)* | QCA + MRI 3T | 87 | 79 | 71 | 91 |
| Ko et al43 | 2014 | 100 | DS 1G | 4.2 | Adenosine(0.14 mg/kg/min) | Iodine map(for vessel)* | QCA + MRI 1.5T and 3T | 88 | 79 | 73 | 91 |
1G, first generation; 2G, second generation; CT, computed tomography; DS, dual-source scanner; MRI, magnetic resonance imaging; N°, patients’ number; NPV, negative predictive value; PPV, positive predictive value; QCA, quantitative coronary angiography; SE, sensitivity; SP, specificity; SPECT, single-photon emission computed tomography.
Dynamic Computed Tomography Perfusion Imaging in Human Studies
| Author | Year | N° | Scanner | Dose, mSv | Stressor | Reference | Analysis | SE, % | SP, % | PPV, % | NPV, % |
|---|---|---|---|---|---|---|---|---|---|---|---|
| Bastarrika et al27 | 2010 | 10 | DS 2G | 12.50 | Adenosine(0.14 mg/kg/min) | MRI(segment) | Visual, semiq, quantitative MBF | 86 | 98 | 94 | 96 |
| Ho et al28 | 2010 | 35 | DS 2G | 9.10 | Dipyridamole(0.56 mg/Kg in 4′) | SPECT(segment) | Quantitative MBF | 83 | 78 | 79 | 82 |
| Bamberg et al44 | 2011 | 33 | DS 2G | 10.00 | Adenosine(0.14 mg/kg/min) | FFR(vessel) | Quantitative MBF* | 93 | 87 | 75 | 97 |
| Wang et al45 | 2012 | 30 | DS 2G | 9.50 | Adenosine(0.14 mg/kg/min) | QCA + SPECT(vessel) | Visual, quantitative MBF and MBV | 100 | 76 | 54 | 100 |
| Greif et al46 | 2013 | 65 | DS 2G | 9.70 | Adenosine(0.14 mg/kg/min) | FFR(vessel) | Quantitative MBF | 95 | 74 | 49 | 98 |
| Huber et al26 | 2013 | 32 | 256-detectorCT | 9.50 | Adenosine(0.14 mg/kg/min) | FFR(vessel) | Quantitative MBF | 76 | 100 | 100 | 91 |
| Bamberg et al47 | 2014 | 31 | DS 2G | 11.08 | Adenosine(0.14 mg/kg/min) | MRI 3T(vessel) | Quantitative MBF and MBV | 100 | 75 | 92 | 100 |
| Rossi et al48 | 2014 | 80 | DS 2G | 9.40 | Adenosine(0.14 mg/kg/min) | FFR(vessel) | Quantitative MBF | 88 | 90 | 77 | 95 |
2G, second-generation; CT, computed tomography; DS, dual-source scanner; FFR, fractional flow reserve; MRI, magnetic resonance imaging; MBF, myocardial blood flow; MBV, myocardial blood volume; N°, patients’ number; NPV, negative predictive value; PPV, positive predictive value; QCA, quantitative coronary angiography; SE, sensitivity; Semiq, semiquantitative analysis; SP, specificity; SPECT, single-photon emission computed tomography.
Based on the above data, stress CTP can be considered competitive regarding the overall dose compared with SPECT imaging (dose of 10 mSv for 99mTc and 20 mSv to 40 mSv for scintigraphy with 201Tl),22 allowing the integration of functional and anatomical data in a single examination.
ACCURACYMultiple single-center studies and the first multicenter trials have shown that stress CTP provides good diagnostic accuracy for the detection of myocardial perfusion defects by both static monoenergetic and DE modalities (Tables 1 and 2). In particular, Ko et al13 have demonstrated the higher accuracy of DE CTP study compared with coronary CTA examination alone in detecting significant stenosis according to conventional coronary angiography. In a recent study, by comparing the accuracy of different acquisition protocols with the DE technique and SPECT, Meinel et al24 concluded that an examination including both stress and rest DE CTP is the modality of choice to reveal perfusion defects, with a sensitivity of 99%, specificity of 97%, positive predictive value of 92%, and negative predictive value of 100%; late-enhancement acquisition did not significantly improve diagnostic performance.24 An ongoing prospective, multicenter study, the DECIDE-Gold trial, which evaluates the accuracy of rest-stress DE CTP imaging compared with invasive FFR (primary endpoints) and functional imaging (secondary endpoints), will improve the current evidence on DE CTP in the detection of myocardial ischemia.51
The CORE 320 study, a prospective multicenter international trial using the 320-detector scanner with 381 participants, has evaluated the diagnostic accuracy of combined coronary CTA and static adenosine-stress CTP compared with invasive angiography and SPECT. The study concluded that the overall performance of stress CTP imaging in the diagnosis of anatomic coronary stenosis (≥ 50%) was higher than that of SPECT and was driven in part by the higher sensitivity for left main and multivessel disease.36 According to the CORE320 data, when combined with coronary CTA, myocardial CTP analysis substantially increased specificity and overall accuracy in identifying flow-limiting stenosis (CAD ≥ 50%) as determined by invasive coronary angiography and SPECT.35,38 These findings were consistent among patients with and without previous CAD, both in per-patient and in per-vessel analyses.35,38 Another recent randomized, multicenter, multivendor CTP study with regadenoson in 110 participants, conducted at 11 sites in the United States using 6 different CT scanners, has demonstrated the noninferiority of the static CTP protocol in detecting perfusion defects with respect to SPECT as the reference standard, with high sensitivity and specificity of 90% and 82%, respectively.39 Moreover, as in the CORE320 trial, regadenoson CTP provides improved diagnostic accuracy over CTA alone for the detection of myocardial ischemia.39
The software-derived transmural perfusion ratio and other index parameters such as the myocardial reserve index (difference in attenuation between the stress and rest phases) have been introduced as useful semiquantitative parameters for static myocardial CTP; however, they have shown lower diagnostic accuracy than standard visual qualitative analysis, especially when visual perfusion was added to the coronary CTA information.32,38
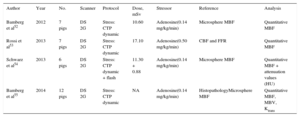
Regarding the diagnostic accuracy of dynamic stress CTP, data obtained from animal model-based studies have been very encouraging, demonstrating a good correlation with fluorescent microsphere measurements and histopathology (Table 4). Preliminary human studies confirmed the good diagnostic performance of dynamic CTP compared with well-established noninvasive functional methods such as SPECT and perfusion-MRI, and with the gold-standard, invasive FFR (Table 3). Indeed, CTP imaging added the possibility of improving the overall diagnostic accuracy of coronary CTA, particularly in the interpretation of intermediate stenosis.47,48
Dynamic Computed Tomography Perfusion Imaging in Animal Studies
| Author | Year | No. | Scanner | Protocol | Dose, mSv | Stressor | Reference | Analysis |
|---|---|---|---|---|---|---|---|---|
| Bamberg et al52 | 2012 | 7 pigs | DS 2G | Stress: CTP dynamic | 10.60 | Adenosine(0.14 mg/kg/min) | Microsphere MBF | Quantitative MBF |
| Rossi et al53 | 2013 | 7 pigs | DS 2G | Stress: CTP dynamic | 17.10 | Adenosine(0.50 mg/kg/min) | CBF and FFR | Quantitative MBF |
| Schwarz et al54 | 2013 | 6 pigs | DS 2G | Stress: CTP dynamic + flash | 11.30 + 0.88 | Adenosine(0.14 mg/kg/min) | Microsphere MBF | Quantitative MBF + attenuation values (HU) |
| Bamberg et al55 | 2014 | 12 pigs | DS 2G | Stress: CTP dynamic | NA | Adenosine(0.14 mg/kg/min) | HistopathologyMicrosphere MBF | Quantitative MBF, MBV, Ktrans |
2G, second-generation; CBF, coronary blood flow; CTP, computed tomography perfusion; DS, Dual-Source scanner; FFR, fractional flow reserve; HU: Hounsfield unit; Ktrans, permeability constant; MBF, myocardial blood flow; MBV, myocardial blood volume; NA, nonassessable.
By means of dynamic CTP imaging, different absolute MBF cut-off values ranging from 75mL/100mL/min to 103.1mL/100mL/min with a DSCT scanner system and as high as 164mL/100mL/min using a 256-slices CT scanner have been proposed to distinguish between ischemic and nonischemic myocardium compared with invasive FFR.26,44,48,56,57 The lack of uniformity may be attributed to variation in study protocols, the use of different scanners, and mathematical algorithms.26,48,56 More recently, a study by Meinel et al58 has also demonstrated the utility of dynamic CTP with DSCT scanner in the quantitative assessment of global left ventricular perfusion. Whole-heart perfusion was lower in patients with perfusion defects and decreased with an increasing extent of obstructive CAD, demonstrating the clinical feasibility of differentiating patients with normal perfusion from patients with 3-vessel obstructive CAD causing balanced ischemia.58
Furthermore, a recent study has shown that a relative MBF measurement (an absolute MBF-to-remote MBF ratio) may outperform absolute measures of MBF with a superior correlation with invasive FFR for detecting hemodynamically significant coronary lesions.56 Some results were recently confirmed in a retrospective multicenter registry of 137 patients, in which the MBF ratio allowed a superior discrimination of obstructive CAD as detected by CTA compared with absolute MBF.57
Although a relative MBF may correct for intra-individual systemic variations in MBF, numerous other factors are known to modify the inter- and intra-individual MBF: age, sex, body mass index, hemodynamic (comprising differences in vasodilator responsiveness), anatomic, metabolic, myogenic, endothelial, and neural mechanisms acting at different levels of the vascular tree, and methodological aspects (variations in contrast dose and injection technique as well as scanning protocols and different scanner types).11,48,56 Further studies are needed to confirm the superiority of the normalized measurement of the MBF or other potential physiologic parameters with respect to absolute quantitative metrics.
While a human study has shown similar high diagnostic accuracy for ischemia prediction as detected by FFR of the single-shot CTP and the MBF parameter derived from dynamic CTP,26 a large animal study has demonstrated a significantly better performance of quantitative MBF compared with the static single-phase myocardial attenuation value.54 In particular, a notable difference in accuracy was demonstrated at lower degree of stenosis (50%), thus resulting in better discriminatory power for dynamic CTP with respect to static CTP in detecting ischemic myocardium.54
The results of initial meta-analyses have confirmed the high accuracy of CTP, although significant heterogeneity was a potential limitation of these analyses.59,60 In particular, a meta-analysis by Takx et al59 evaluating the accuracy of different myocardial perfusion techniques in comparison with FFR, indicated that CTP performed similarly to MRI and positron emission tomography and better than SPECT and echocardiography. Pooled results of another meta-analysis including 22 studies (1507 patients) comparing CTP to reference standards, including invasive coronary angiography, SPECT, and MRI, showed acceptable diagnostic performance for all myocardial perfusion CTP techniques (static and dynamic CTP) with sensitivity ranging from 75% to 89% and specificity from 78% to 95%.60
STRENGTHS AND LIMITATIONSStress CTP still has a number of limitations, some of which will eventually be overcome as CT technology improves. Optimal scan acquisition parameters and reconstruction methods, post-processing, and standardized interpretation of stress CTP are still under investigation. Beam hardening and motion artifacts may hamper the diagnostic accuracy of stress CTP, but correction algorithms that may mitigate these effects are readily available. Furthermore, radiation exposure is also likely to decrease as CT technology advances, for example by employing iterative reconstruction methods for dynamic CTP imaging without affecting image quality.50 Stress CTP studies have been performed with and without beta-blockade, which may have influenced myocardial perfusion assessment. Finally, most of the current evidence on CTP comes from single-center studies with a limited number of enrolled patients. However, CTP has superior spatial resolution to SPECT, the most widely used functional imaging technique in routine clinical practice, which may allow detection of smaller, especially subendocardial perfusion defects. Furthermore, CTP provides “one-stop shop” imaging with the unique advantage of achieving integrated anatomic and functional evaluation in a single examination. These strengths potentially make CTP a more effective gatekeeper to invasive coronary angiography with better stratification of patients who would benefit from revascularization.
CONCLUSIONS AND FUTURE PROSPECTSThe rapid technological progress in cardiac imaging has dramatically widened the application of CTA in the assessment of ischemic cardiomyopathy, enabling pharmacological stress myocardial CTP imaging. This modality is highly appealing and is able to improve diagnostic accuracy, particularly the specificity and positive predictive value of coronary CTA.
Stress CTP has the potential to evaluate a broad spectrum of coronary vascular dysfunction: from microvascular dysfunction related to cardiovascular risk factors and advanced diffuse nonobstructive atherosclerosis, to intermediate-to-severe stenosis or multivessel CAD. Stress CTP may increase diagnostic accuracy in the assessment of stent patency and diffusely calcified coronary tree.61,62
Further studies seem to be warranted to demonstrate the noninferiority of the static single-phase protocol with respect to dynamic stress CTP, since the dynamic time-resolved technique provides fully quantitative data but at the price of a higher dose due to the extended imaging time. It's probable that in the near future the choice of the optimal acquisition protocol and pattern for analysis to accurately assess the left ventricular myocardial perfusion will be driven by various factors, including technical aspects (type of imaging platform used) and patient-based variables (patient's physical condition, coronary status, and pretest probability of CAD).
Future prospects may include further technological improvements in both hardware (better sensitivity and a wider range of the detector system, higher temporal and spatial resolution, and DE implementation) and software updates (enabling post-processing standardization which is needed for more accurate and reproducible data analysis and successful clinical implementation).
We are positive about the future usefulness of myocardial CTP. Even though the diagnostic validation of CTP is still ongoing, the potential role of CTP as a diagnostic tool in detecting hemodynamically significant CAD is promising and merits further investigation. Results from the first controlled studies are outstanding and encouraging, but, as technology continues to evolve, further larger, multicenter trials are warranted to demonstrate the effective clinical role of CTP and its economic impact in relation to other functional imaging modalities.
Finally, although myocardial perfusion is historically a strong estimator of outcome, the prognostic implication of perfusion defects as assessed by CTP must be completely defined. We thus eagerly await studies assessing the prognostic value of CTP imaging for the prediction of future cardiac events, which will strengthen its diagnostic role in clinical practice.
CONFLICTS OF INTERESTNone declared.