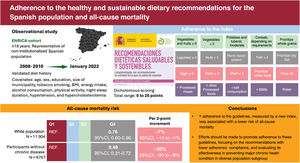
The healthy and sustainable dietary recommendations for the Spanish population have recently been launched. We aimed to develop a food-based dietary index to measure adherence to these guidelines and assess its association with all-cause mortality.
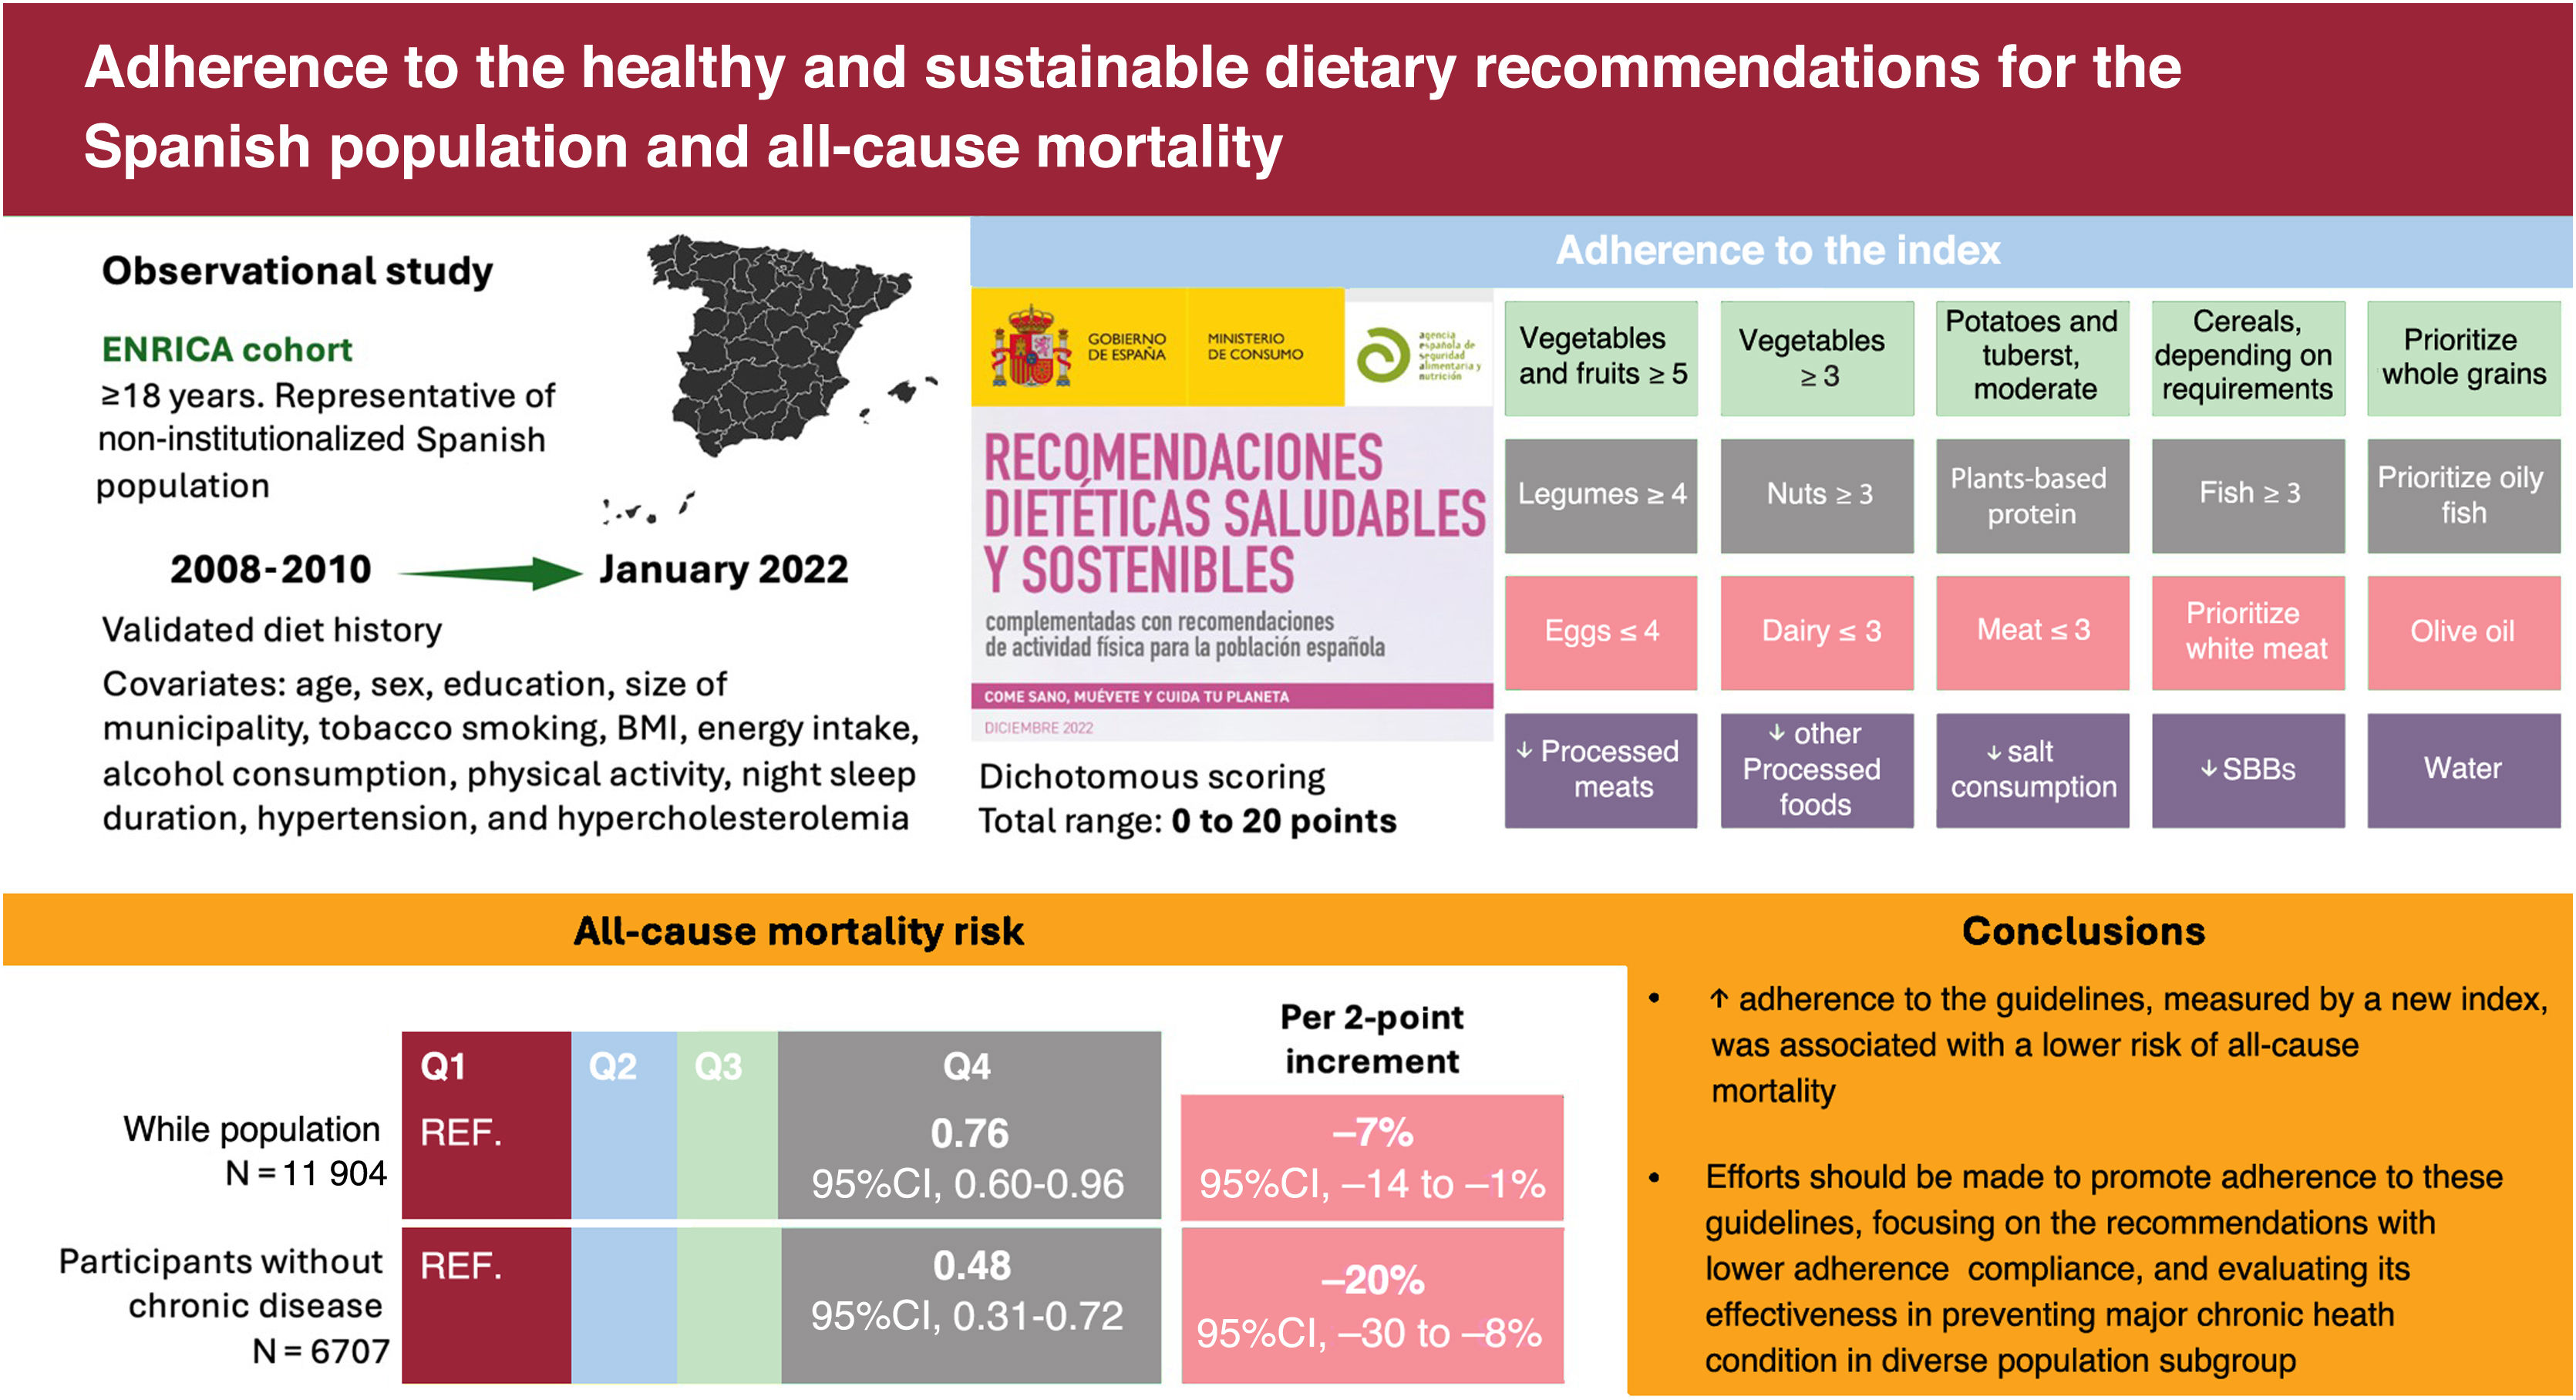
MethodsData were drawn from 11 904 individuals, representative of the Spanish population aged 18 and older, recruited between 2008 and 2010, and followed-up until 2022. The healthy and sustainable dietary recommendations for the Spanish population index (HS-DRSI) includes 20 food components, scored dichotomously to reflect adherence to the recommendations. The association between the HS-DRSI and all-cause mortality was examined using Cox proportional hazard models adjusted for sociodemographic, lifestyle, and morbidity factors, within a retrospective cohort design.
ResultsThe mean±SE age of participants was 46.9±0.3 years and 50.5% were female. After a median follow-up of 12.9 years, 939 all-cause deaths were recorded. Compared with participants in the lowest quartile of adherence (HS-DRSI range: 1-5), those in the highest quartile (HS-DRSI range: 9-17) had a lower risk of mortality (HR, 0.76; 95%CI, 0.60-0.96; P for trend=.02). A 2-point increase in the HS-DRSI was associated with a 7% lower risk of mortality (HR, 0.93; 95%CI, 0.86-1.00; P=.04). This protective association was also observed among participants without chronic diseases at baseline (HR per 2-point increment: HR, 0.80; 95%CI, 0.70-0.92; P=.002). Results were robust in sensitivity analyses.
ConclusionsHigher adherence to the healthy and sustainable dietary recommendations for the Spanish population was associated with lower all-cause mortality.
Keywords
Poor diet quality is a leading determinant of chronic noncommunicable diseases, which account for most of the mortality and morbidity in Spain1 and worldwide.2 This has prompted the formulation of national dietary guidelines that provide evidence-based food consumption recommendations to help individuals select foods that ensure optimal nutrient intake, promote health, and prevent diet-related chronic diseases.3,4 Concurrently, the environmental impact of food has garnered significant attention.5 Transforming food production systems and dietary choices is necessary to achieve the 2030 Agenda for Sustainable Development and the United Nations’ Sustainable Development Goals. This transformation aims to promote diets that are protective of ecosystems, culturally acceptable, affordable, nutritionally adequate, safe, and healthy.6
To this end, the Scientific Committee of the Spanish Agency for Food Safety and Nutrition (AESAN) updated the Spanish dietary guidelines, incorporating the latest information on the impact of diet on health while considering sustainability.3 Published in December 2022, the healthy and sustainable dietary recommendations for the Spanish population provide food-based recommendations for a healthy and sustainable diet, within the Mediterranean diet, emphasizing the consumption of fruits, vegetables, whole grains, plant-based protein, fish, olive oil as the main fat, and water as the beverage of choice, while moderating the intake of potatoes, eggs, dairy products, and meat. They also advise limiting the consumption of processed foods, saturated fats, salt, and sugary drinks.3
Several dietary indices have been developed to quantify adherence to national food-based dietary guidelines.7 These indices can help to assess the diet quality of specific populations, monitor changes over time, and promote culturally rooted dietary practices. They also serve as valuable tools for nutritional education, public health policies, and clinical practice.7,8 Furthermore, such indices enable researchers to investigate associations between dietary adherence and health outcomes in population-based studies, especially at the national level, providing valuable insight for future guideline updates.8
Therefore, the main objectives of this study were firstly, to develop the healthy and sustainable dietary recommendations for the Spanish population index (HS-DRSI) and estimate the degree of adherence to these guidelines in the adult population of Spain, and secondly, to examine the association between the HS-DRSI and all-cause mortality in this population.
METHODSStudy design and participantsThe Study on Nutrition and Cardiovascular Risk in Spain (ENRICA) is a prospective cohort study of Spanish adults aged 18 years and older. The study design and data collection methods have been previously described.9 Briefly, a representative sample of the noninstitutionalized population was selected between 2008 and 2010 using multistage stratified cluster sampling. First, participants were stratified by province and municipality size. Second, clusters were randomly selected in 2 stages: municipalities and census sections. Finally, households within each section were chosen through random telephone dialing. Individuals in the households were selected proportionally to the distribution of the Spanish population by sex and age group. Baseline data were collected by trained research staff in 3 sequential stages. First, a computer-assisted telephone interview was conducted using a structured questionnaire on sociodemographic factors, lifestyles, health status, and morbidity. This was followed by 2 home visits to collect biological samples, perform a physical examination, and obtain a detailed dietary history.
The study was approved by the Clinical Research Ethics Committee of La Paz University Hospital in Madrid and conducted in accordance with the Declaration of Helsinki for biomedical research.
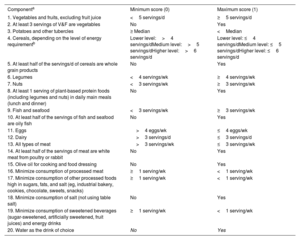
Adherence to the healthy and sustainable dietary recommendations for the Spanish populationThe HS-DRSI was designed to assess adherence to the latest comprehensive update on healthy and sustainable dietary guidelines published by AESAN3. A detailed description of the methods used to collect dietary information and construct the index is provided in the . The components and scoring criteria are shown in table 1.
Components and scoring criteria of the healthy and sustainable dietary recommendations for Spanish population index
| Componenta | Minimum score (0) | Maximum score (1) |
|---|---|---|
| 1. Vegetables and fruits, excluding fruit juice | <5 servings/d | ≥5 servings/d |
| 2. At least 3 servings of V&F are vegetables | No | Yes |
| 3. Potatoes and other tubercles | ≥ Median | <Median |
| 4. Cereals, depending on the level of energy requirementb | Lower level:>4 servings/dMedium level:>5 servings/dHigher level:>6 servings/d | Lower level: ≤4 servings/dMedium level: ≤5 servings/dHigher level: ≤6 servings/d |
| 5. At least half of the servings/d of cereals are whole grain products | No | Yes |
| 6. Legumes | <4 servings/wk | ≥4 servings/wk |
| 7. Nuts | <3 servings/wk | ≥3 servings/wk |
| 8. At least 1 serving of plant-based protein foods (including legumes and nuts) in daily main meals (lunch and dinner) | No | Yes |
| 9. Fish and seafood | <3 servings/wk | ≥3 servings/wk |
| 10. At least half of the servings of fish and seafood are oily fish | No | Yes |
| 11. Eggs | >4 eggs/wk | ≤4 eggs/wk |
| 12. Dairy | >3 servings/d | ≤3 servings/d |
| 13. All types of meat | >3 servings/wk | ≤3 servings/wk |
| 14. At least half of the servings of meat are white meat from poultry or rabbit | No | Yes |
| 15. Olive oil for cooking and food dressing | No | Yes |
| 16. Minimize consumption of processed meat | ≥1 serving/wk | <1 serving/wk |
| 17. Minimize consumption of other processed foods high in sugars, fats, and salt (eg, industrial bakery, cookies, chocolate, sweets, snacks) | ≥1 serving/wk | <1 serving/wk |
| 18. Minimize consumption of salt (not using table salt) | No | Yes |
| 19. Minimize consumption of sweetened beverages (sugar-sweetened, artificially sweetened, fruit juices) and energy drinks | ≥1 serving/wk | <1 serving/wk |
| 20. Water as the drink of choice | No | Yes |
1 serving of vegetables=175 g; 1 serving of fruits=160 g; 1 serving of cereals=50 g of bread or 70g of pasta/rice; 1 serving of legumes=55 g dried or 170g cooked; 1 serving of nuts=25 g; 1 serving of fish and seafood=137.5 g; 1 serving of eggs=1 egg (∼58 g); 1 serving of dairy=225 mL of milk, 105 g of fresh cheese, 50 g of hard cheese or 125 g yogurt and other fermented milks; 1 serving of meat=112.5 g; 1 serving of bakery: 70 g; 1 serving of cookies: 30 g; 1 serving of chocolate: 30 g; 1 serving of sweets=10 g; 1 serving of snacks=30 g.
Information on vital status was retrieved from the National Death Index of Spain, and the date of death from any cause was obtained up to 31 January 2022. Participants were linked to the information system by combining first and last names, birthdates, and national identity card numbers.10
Other variablesInformation on demographic factors, lifestyle behaviors, anthropometry, and health status was also obtained ().
Statistical analysisAmong the 13 105 participants in the ENRICA cohort, we excluded those with missing dietary data or implausible energy intake values (n=985) and those with missing information on potential confounders (n=216). Thus, the analyses were conducted with 11 904 individuals ().
Baseline characteristics of study participants among quartiles of the HS-DRSI were assessed using ANOVA for continuous variables, and the chi-square test for categorical variables. Food and nutrient intake across quartiles of the score were described using means and standard errors. In addition, we estimated the prevalence of inadequate micronutrient intake among quartiles of the score. Adequacy was evaluated using the Recommended Dietary Allowances proposed by AESAN.11
Person-years of follow-up were calculated from the date of study entry to the date of death or the end of the study (31 January 2022), whichever occurred first. The association between quartiles of adherence to the HS-DRSI and the risk of all-cause mortality was estimated using hazard ratios (HRs) and their 95% confidence intervals (95%CI) derived from Cox proportional hazards models. The lowest quartile of HS-DRSI served as the reference group.
Three sequential models were constructed: model 1 adjusted for age and sex; model 2 additionally adjusted for educational attainment and size of municipality; and model 3 further adjusted for tobacco smoking, BMI, energy intake, alcohol consumption, leisure time physical activity, night sleep duration, prevalent hypertension, and hypercholesterolemia. Linear trends were evaluated by modeling the median values of the quartiles as a continuous variable. Additionally, we examined the associations of a 2-point increment and a 1-standard deviation increment in the HS-DRSI with mortality. We also examined the association among healthy participants by excluding those with prevalent chronic diseases at baseline. Plots of Schoenfeld residuals against time did not indicate violations of the proportional hazards assumption in the models.
In additional analyses, we assessed a possible nonlinear association between adherence to the score and all-cause mortality nonparametrically with restricted cubic splines, which provide a better fit to the data. Second, we evaluated the independent association of each individual component of the HS-DRSI with all-cause mortality by treating compliance with each component as the exposure and adjusting for the remaining components.
Third, to compare the association between the HS-DRSI and mortality with other dietary indices and this outcome, we calculated the correlation among different indices by using Spearman coefficients and replicated the main analyses using adherence to the Alternate Healthy Eating Index (AHEI), Dietary Approaches to Stop Hypertension (DASH)-style diet, Global Diet Quality Score (GDQS), Mediterranean Diet Adherence Screener (MEDAS), and Mediterranean Diet Score (MDS) as exposures ().
Fourth, we assessed potential differences in the associations among population subgroups through stratified analyses by sex, age (18-59, 60-74, ≥75 years), current smoking status (no, yes), leisure time physical activity (< median, ≥ median), obesity (no, yes), diabetes (no, yes), hypercholesterolemia (no, yes), and hypertension (no, yes). To test for interactions, we used likelihood-ratio tests comparing models with and without an interaction term, defined as the cross-product of the HS-DRSI (as a continuous variable) and the stratification variable.
Finally, to address potential reverse causation, whereby poor health status might influence dietary intake, we excluded deaths occurring within the first 2 years of follow-up and reanalyzed the data.
Statistical significance was set at a 2-tailed P<.05. Analyses were performed using SAS software, version 9.4 (SAS Institute, United States). The SAS SURVEY procedures were used for descriptive data and regression models to account for the complex sampling design, including sampling weights and indicators of stratification and clustering.
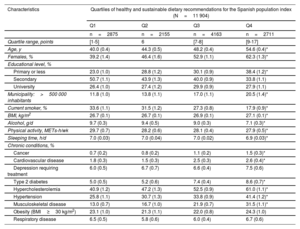
RESULTSThe baseline characteristics of study participants are shown in table 2. The mean age±SE was 46.9±0.3 years, and 50.5% were female. The distribution of adherence to the HS-DRSI is depicted in ; only 22.8% of participants had an adherence score ≥9 points (moderate adherence). Compared with participants with the lowest adherence to the guidelines (HS-DRSI ≤5), those in the highest quartile (HS-DRSI ≥9) were older, more frequently female, had lower educational attainment, lived in larger municipalities, were less often current smokers, had a higher BMI, slept fewer hours at night, and had a higher prevalence of morbidities.
Baseline characteristics of study participants in the ENRICA cohort
| Characteristics | Quartiles of healthy and sustainable dietary recommendations for the Spanish population index (N=11 904) | |||
|---|---|---|---|---|
| Q1 | Q2 | Q3 | Q4 | |
| n=2875 | n=2155 | n=4163 | n=2711 | |
| Quartile range, points | [1-5] | 6 | [7-8] | [9-17] |
| Age, y | 40.0 (0.4) | 44.3 (0.5) | 48.2 (0.4) | 54.6 (0.4)* |
| Females, % | 39.2 (1.4) | 46.4 (1.6) | 52.9 (1.1) | 62.3 (1.3)* |
| Educational level, % | ||||
| Primary or less | 23.0 (1.0) | 28.8 (1.2) | 30.1 (0.9) | 38.4 (1.2)* |
| Secondary | 50.7 (1.1) | 43.9 (1.3) | 40.0 (0.9) | 33.8 (1.1) |
| University | 26.4 (1.0) | 27.4 (1.2) | 29.9 (0.9) | 27.9 (1.1) |
| Municipality:>500 000 inhabitants | 11.8 (1.0) | 13.8 (1.1) | 17.0 (1.1) | 20.5 (1.4)* |
| Current smoker, % | 33.6 (1.1) | 31.5 (1.2) | 27.3 (0.8) | 17.9 (0.9)* |
| BMI, kg/m2 | 26.7 (0.1) | 26.7 (0.1) | 26.9 (0.1) | 27.1 (0.1)* |
| Alcohol, g/d | 9.7 (0.3) | 9.4 (0.5) | 9.0 (0.3) | 7.1 (0.3)* |
| Physical activity, METs-h/wk | 29.7 (0.7) | 28.2 (0.6) | 28.1 (0.4) | 27.9 (0.5)* |
| Sleeping time, h/d | 7.0 (0.03) | 7.0 (0.04) | 7.0 (0.02) | 6.9 (0.03)* |
| Chronic conditions, % | ||||
| Cancer | 0.7 (0.2) | 0.8 (0.2) | 1.1 (0.2) | 1.5 (0.3)* |
| Cardiovascular disease | 1.8 (0.3) | 1.5 (0.3) | 2.5 (0.3) | 2.6 (0.4)* |
| Depression requiring treatment | 6.0 (0.5) | 6.7 (0.7) | 6.6 (0.4) | 7.5 (0.6) |
| Type 2 diabetes | 5.0 (0.5) | 5.2 (0.6) | 7.4 (0.4) | 8.6 (0.7)* |
| Hypercholesterolemia | 40.9 (1.2) | 47.2 (1.3) | 52.5 (0.9) | 61.0 (1.1)* |
| Hypertension | 25.8 (1.1) | 30.7 (1.3) | 33.8 (0.9) | 41.4 (1.2)* |
| Musculoskeletal disease | 13.0 (0.7) | 16.7 (1.0) | 21.9 (0.7) | 31.5 (1.1)* |
| Obesity (BMI≥30 kg/m2) | 23.1 (1.0) | 21.3 (1.1) | 22.0 (0.8) | 24.3 (1.0) |
| Respiratory disease | 6.5 (0.5) | 5.8 (0.6) | 6.0 (0.4) | 6.7 (0.6) |
BMI, body mass index; METs, metabolic equivalents.
Values are expressed as means (SE) and proportions (SE).
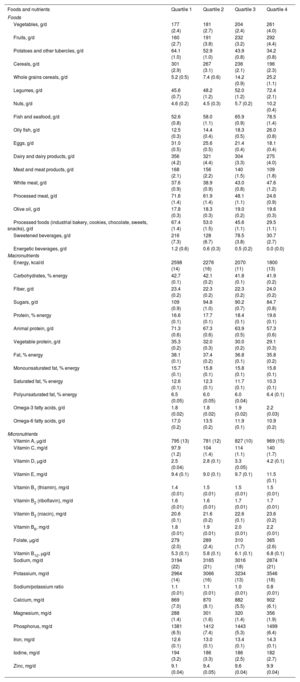
When food and nutrient intake was examined among quartiles of the HS-DRSI, a higher quartile was associated with greater intake of vegetables, fruits, whole grains, legumes, nuts, fish, white meat, olive oil, fiber, protein, omega-3 fatty acids, and several vitamins and minerals, including vitamins A, C, D, folic acid, calcium, potassium, and zinc (table 3). Conversely, higher adherence to the HS-DRSI was associated with lower intake of total energy, potatoes and other tubers, cereals, eggs, dairy products, total meat, processed meat, sweetened beverages, energy drinks, alcohol, sugars, and saturated fats (table 3). The prevalence of inadequate nutrient intake was lower in the higher quartiles of adherence to the score, except for iodine ().
Food and nutrient intake according to quartiles of the healthy and sustainable dietary recommendations for the Spanish population in the ENRICA cohort
| Foods and nutrients | Quartile 1 | Quartile 2 | Quartile 3 | Quartile 4 |
|---|---|---|---|---|
| Foods | ||||
| Vegetables, g/d | 177 (2.4) | 181 (2.7) | 204 (2.4) | 261 (4.0) |
| Fruits, g/d | 160 (2.7) | 191 (3.8) | 232 (3.2) | 292 (4.4) |
| Potatoes and other tubercles, g/d | 64.1 (1.0) | 52.9 (1.0) | 43.9 (0.8) | 34.2 (0.8) |
| Cereals, g/d | 301 (2.9) | 267 (3.1) | 236 (2.1) | 196 (2.3) |
| Whole grains cereals, g/d | 5.2 (0.5) | 7.4 (0.6) | 14.2 (0.9) | 25.2 (1.1) |
| Legumes, g/d | 45.6 (0.7) | 48.2 (1.2) | 52.0 (1.2) | 72.4 (2.1) |
| Nuts, g/d | 4.6 (0.2) | 4.5 (0.3) | 5.7 (0.2) | 10.2 (0.4) |
| Fish and seafood, g/d | 52.6 (0.8) | 58.0 (1.1) | 65.9 (0.9) | 78.5 (1.4) |
| Oily fish, g/d | 12.5 (0.3) | 14.4 (0.4) | 18.3 (0.5) | 26.0 (0.8) |
| Eggs, g/d | 31.0 (0.5) | 25.6 (0.5) | 21.4 (0.4) | 18.1 (0.4) |
| Dairy and dairy products, g/d | 356 (4.2) | 321 (4.4) | 304 (3.3) | 275 (4.0) |
| Meat and meat products, g/d | 168 (2.1) | 156 (2.2) | 140 (1.5) | 109 (1.8) |
| White meat, g/d | 37.6 (0.9) | 38.9 (0.9) | 43.0 (0.8) | 47.6 (1.2) |
| Processed meat, g/d | 71.6 (1.4) | 61.9 (1.4) | 48.1 (1.1) | 24.6 (0.9) |
| Olive oil, g/d | 17.8 (0.3) | 18.3 (0.3) | 19.0 (0.2) | 19.6 (0.3) |
| Processed foods (industrial bakery, cookies, chocolate, sweets, snacks), g/d | 67.4 (1.4) | 53.0 (1.5) | 45.6 (1.1) | 29.5 (1.1) |
| Sweetened beverages, g/d | 216 (7.3) | 128 (6.7) | 78.5 (3.8) | 30.7 (2.7) |
| Energetic beverages, g/d | 1.2 (0.6) | 0.6 (0.3) | 0.5 (0.2) | 0.0 (0.0) |
| Macronutrients | ||||
| Energy, kcal/d | 2598 (14) | 2276 (16) | 2070 (11) | 1800 (13) |
| Carbohydrates, % energy | 42.7 (0.1) | 42.1 (0.2) | 41.8 (0.1) | 41.9 (0.2) |
| Fiber, g/d | 23.4 (0.2) | 22.3 (0.2) | 22.3 (0.2) | 24.0 (0.2) |
| Sugars, g/d | 109 (0.9) | 94.8 (1.0) | 90.2 (0.7) | 84.7 (0.8) |
| Protein, % energy | 16.6 (0.1) | 17.7 (0.1) | 18.4 (0.1) | 19.6 (0.1) |
| Animal protein, g/d | 71.3 (0.6) | 67.3 (0.6) | 63.9 (0.5) | 57.3 (0.6) |
| Vegetable protein, g/d | 35.3 (0.2) | 32.0 (0.3) | 30.0 (0.2) | 29.1 (0.3) |
| Fat, % energy | 38.1 (0.1) | 37.4 (0.2) | 36.8 (0.1) | 35.8 (0.2) |
| Monounsaturated fat, % energy | 15.7 (0.1) | 15.8 (0.1) | 15.8 (0.1) | 15.8 (0.1) |
| Saturated fat, % energy | 12.6 (0.1) | 12.3 (0.1) | 11.7 (0.1) | 10.3 (0.1) |
| Polyunsaturated fat, % energy | 6.5 (0.05) | 6.0 (0.05) | 6.0 (0.04) | 6.4 (0.1) |
| Omega-3 fatty acids, g/d | 1.8 (0.02) | 1.8 (0.02) | 1.9 (0.02) | 2.2 (0.03) |
| Omega-6 fatty acids, g/d | 17.0 (0.2) | 13.5 (0.2) | 11.9 (0.1) | 10.9 (0.2) |
| Micronutrients | ||||
| Vitamin A, μg/d | 795 (13) | 781 (12) | 827 (10) | 969 (15) |
| Vitamin C, mg/d | 97.9 (1.2) | 104 (1.4) | 114 (1.1) | 140 (1.7) |
| Vitamin D, μg/d | 2.5 (0.04) | 2.8 (0.1) | 3.3 (0.05) | 4.2 (0.1) |
| Vitamin E, mg/d | 9.4 (0.1) | 9.0 (0.1) | 9.7 (0.1) | 11.5 (0.1) |
| Vitamin B1 (thiamin), mg/d | 1.4 (0.01) | 1.5 (0.01) | 1.5 (0.01) | 1.5 (0.01) |
| Vitamin B2 (riboflavin), mg/d | 1.6 (0.01) | 1.6 (0.01) | 1.7 (0.01) | 1.7 (0.01) |
| Vitamin B3 (niacin), mg/d | 20.6 (0.1) | 21.6 (0.2) | 22.6 (0.1) | 23.6 (0.2) |
| Vitamin B6, mg/d | 1.8 (0.01) | 1.9 (0.01) | 2.0 (0.01) | 2.2 (0.01) |
| Folate, μg/d | 279 (2.0) | 289 (2.4) | 310 (1.7) | 365 (2.6) |
| Vitamin B12, μg/d | 5.3 (0.1) | 5.8 (0.1) | 6.1 (0.1) | 6.8 (0.1) |
| Sodium, mg/d | 3194 (22) | 3165 (21) | 3016 (18) | 2874 (21) |
| Potassium, mg/d | 2964 (14) | 3066 (16) | 3234 (13) | 3546 (18) |
| Sodium/potassium ratio | 1.1 (0.01) | 1.1 (0.01) | 1.0 (0.01) | 0.8 (0.01) |
| Calcium, mg/d | 869 (7.0) | 870 (8.1) | 882 (5.5) | 902 (6.1) |
| Magnesium, mg/d | 288 (1.4) | 301 (1.6) | 320 (1.4) | 356 (1.9) |
| Phosphorus, mg/d | 1381 (6.5) | 1412 (7.4) | 1443 (5.3) | 1499 (6.4) |
| Iron, mg/d | 12.6 (0.1) | 13.0 (0.1) | 13.4 (0.1) | 14.3 (0.1) |
| Iodine, mg/d | 194 (3.2) | 186 (3.3) | 186 (2.5) | 182 (2.7) |
| Zinc, mg/d | 9.1 (0.04) | 9.4 (0.05) | 9.6 (0.04) | 9.9 (0.04) |
Values are expressed as means (SE).
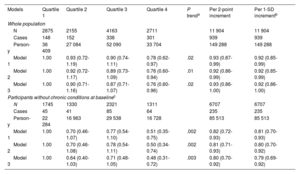
During a median follow-up of 12.9 years, 939 deaths (7.89%) were recorded. A higher HS-DRSI score was associated with lower all-cause mortality after adjustment for sociodemographic factors (model 2, quartile 4 vs quartile 1: HR, 0.76; 95%CI, 0.60-0.94; P for trend=.01) (table 4). In model 3, the estimate for the comparison between the highest and the lowest quartiles of HS-DRSI remained similar (HR, 0.76; 95%CI, 0.60-0.96; P for trend=.02). The HR of mortality for a 2-point increment in the score was 0.93 (95%CI, 0.86-1.00) (table 4). Among participants without chronic conditions at baseline, the magnitude of the association after adjustment for the main sociodemographic and lifestyle factors was somewhat stronger than in the population with diseases at baseline (quartile 4 vs quartile 1: HR, 0.48; 95%CI, 0.31-0.72; P for trend=.003) and per 2-point increment (HR, 0.80; 95%CI, 0.70-0.92) (table 4). We observed a dose-response relationship when modeling the association with restricted cubic splines () (P for nonlinear trend=.05 and 0.03, respectively).
Hazard ratios (95% confidence intervals) for the association between adherence to healthy and sustainable dietary recommendations for the Spanish population index and all-cause mortality in the ENRICA cohort
| Models | Quartile 1 | Quartile 2 | Quartile 3 | Quartile 4 | P trenda | Per 2-point increment | Per 1-SD incrementb |
|---|---|---|---|---|---|---|---|
| Whole population | |||||||
| N | 2875 | 2155 | 4163 | 2711 | 11 904 | 11 904 | |
| Cases | 148 | 152 | 338 | 301 | 939 | 939 | |
| Person-y | 36 409 | 27 084 | 52 090 | 33 704 | 149 288 | 149 288 | |
| Model 1 | 1.00 | 0.93 (0.72-1.19) | 0.90 (0.74-1.11) | 0.78 (0.62-0.97) | .02 | 0.93 (0.87-0.99) | 0.92 (0.85-0.99) |
| Model 2 | 1.00 | 0.92 (0.72-1.17) | 0.89 (0.73-1.09) | 0.76 (0.60-0.94) | .01 | 0.92 (0.86-0.99) | 0.92 (0.85-0.99) |
| Model 3 | 1.00 | 0.90 (0.71-1.16) | 0.87 (0.71-1.07) | 0.76 (0.60-0.96) | .02 | 0.93 (0.86-1.00) | 0.92 (0.86-1.00) |
| Participants without chronic conditions at baselinec | |||||||
| N | 1745 | 1330 | 2321 | 1311 | 6707 | 6707 | |
| Cases | 45 | 41 | 85 | 64 | 235 | 235 | |
| Person-y | 22 284 | 16 963 | 29 538 | 16 728 | 85 513 | 85 513 | |
| Model 1 | 1.00 | 0.70 (0.46-1.07) | 0.77 (0.54-1.10) | 0.51 (0.35-0.75) | .002 | 0.82 (0.72-0.93) | 0.81 (0.70-0.93) |
| Model 2 | 1.00 | 0.70 (0.46-1.08) | 0.78 (0.54-1.11) | 0.50 (0.34-0.74) | .002 | 0.81 (0.71-0.93) | 0.80 (0.70-0.92) |
| Model 3 | 1.00 | 0.64 (0.40-1.03) | 0.71 (0.48-1.05) | 0.48 (0.31-0.72) | .003 | 0.80 (0.70-0.92) | 0.79 (0.69-0.92) |
SD, standard deviation.
Model 1: Cox proportional hazard model adjusted for age and sex.
Model 2: additionally adjusted for education (≤ primary, secondary, university) and municipality (population <10 000; 10 000-100 000;>100 000-500 000;>500 000 inhabitants).
Model 3: additionally adjusted for tobacco smoking (never, former, current), body mass index (BMI) (<25, 25-29.9, and ≥30kg/m2), energy intake (kcal/d), alcohol consumption (g/d), night sleep duration (h/d), leisure time physical activity (METs-h/wk), hypertension (no/yes), and hypercholesterolemia (no/yes).
Test for linear trend calculated by assigning the median score in each quartile and modeling this as a continuous variable.
Participants with any of the following conditions were excluded: cancer, cardiovascular disease (heart disease, stroke, or heart failure), respiratory disease (asthma or chronic obstructive pulmonary disease), musculoskeletal disease (arthritis, osteoarthritis, or hip fracture), depression requiring treatment, obesity, or type 2 diabetes.
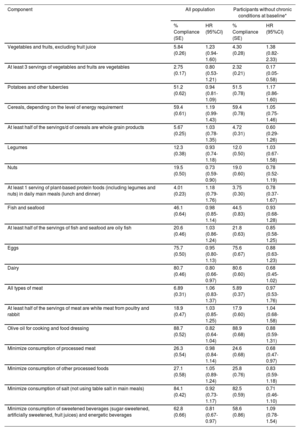
Table 5 shows compliance with individual dietary recommendations and all-cause mortality. The recommendations with the highest compliance were using olive oil for cooking and food dressing (88.7%), minimizing salt consumption (84.1%), and consuming ≤3 servings/d of dairy (80.7%). Conversely, those with the lowest compliance were: eating at least 3 servings of vegetables from the total of vegetable and fruit intake (2.75%), and including at least 1 serving of plant-based protein foods in daily main meals (4.01%). We found significant inverse associations with mortality for meeting the recommendations for nuts (≥3servings/wk), dairy (≤3 servings/d) and sweetened and energy drinks (<1 serving/wk): the corresponding HR were 0.73 (95%CI, 0.59-0.90), 0.80 (95%CI, 0.66-0.97), and 0.81 (95%CI, 0.67-0.97), respectively. Among participants without chronic conditions at baseline, significant associations were found for consuming at least 3 servings of vegetables from the total for vegetable and fruit intake (HR, 0.17; 95%CI, 0.05-0.58) and minimizing processed meat consumption (HR, 0.68; 95%CI, 0.47-0.97) (table 5).
Hazard ratios (95% confidence intervals) for the association between targets of the healthy and sustainable dietary recommendations for the Spanish population index and all-cause mortality in the ENRICA cohort
| Component | All population | Participants without chronic conditions at baseline* | ||
|---|---|---|---|---|
| % Compliance (SE) | HR (95%CI) | % Compliance (SE) | HR (95%CI) | |
| Vegetables and fruits, excluding fruit juice | 5.84 (0.26) | 1.23 (0.94-1.60) | 4.30 (0.28) | 1.38 (0.82-2.33) |
| At least 3 servings of vegetables and fruits are vegetables | 2.75 (0.17) | 0.80 (0.53-1.21) | 2.32 (0.21) | 0.17 (0.05-0.58) |
| Potatoes and other tubercles | 51.2 (0.62) | 0.94 (0.81-1.09) | 51.5 (0.78) | 1.17 (0.86-1.60) |
| Cereals, depending on the level of energy requirement | 59.4 (0.61) | 1.19 (0.99-1.43) | 59.4 (0.78) | 1.05 (0.75-1.46) |
| At least half of the servings/d of cereals are whole grain products | 5.67 (0.25) | 1.03 (0.78-1.35) | 4.72 (0.31) | 0.60 (0.29-1.26) |
| Legumes | 12.3 (0.38) | 0.93 (0.74-1.18) | 12.0 (0.50) | 1.03 (0.67-1.58) |
| Nuts | 19.5 (0.50) | 0.73 (0.59-0.90) | 19.0 (0.60) | 0.78 (0.52-1.19) |
| At least 1 serving of plant-based protein foods (including legumes and nuts) in daily main meals (lunch and dinner) | 4.01 (0.23) | 1.18 (0.79-1.76) | 3.75 (0.30) | 0.78 (0.37-1.67) |
| Fish and seafood | 46.1 (0.64) | 0.98 (0.85-1.14) | 44.5 (0.83) | 0.93 (0.68-1.28) |
| At least half of the servings of fish and seafood are oily fish | 20.6 (0.46) | 1.03 (0.86-1.24) | 21.8 (0.63) | 0.85 (0.58-1.25) |
| Eggs | 75.7 (0.50) | 0.95 (0.80-1.13) | 75.6 (0.67) | 0.88 (0.63-1.23) |
| Dairy | 80.7 (0.46) | 0.80 (0.66-0.97) | 80.6 (0.60) | 0.68 (0.45-1.02) |
| All types of meat | 6.89 (0.31) | 1.06 (0.83-1.37) | 5.89 (0.37) | 0.97 (0.53-1.76) |
| At least half of the servings of meat are white meat from poultry and rabbit | 18.9 (0.47) | 1.03 (0.85-1.25) | 17.9 (0.60) | 1.04 (0.68-1.58) |
| Olive oil for cooking and food dressing | 88.7 (0.52) | 0.82 (0.64-1.04) | 88.9 (0.68) | 0.88 (0.59-1.31) |
| Minimize consumption of processed meat | 26.3 (0.54) | 0.98 (0.84-1.14) | 24.6 (0.68) | 0.68 (0.47-0.97) |
| Minimize consumption of other processed foods | 27.1 (0.58) | 1.05 (0.89-1.24) | 25.8 (0.76) | 0.83 (0.59-1.18) |
| Minimize consumption of salt (not using table salt in main meals) | 84.1 (0.42) | 0.92 (0.73-1.17) | 82.5 (0.59) | 0.71 (0.46-1.10) |
| Minimize consumption of sweetened beverages (sugar-sweetened, artificially sweetened, fruit juices) and energetic beverages | 62.8 (0.66) | 0.81 (0.67-0.97) | 58.6 (0.86) | 1.09 (0.78-1.54) |
Cox proportional hazard model adjusted for age, sex, education (≤ primary, secondary, university), municipality (population <10 000; 10 000-100 000;>100 000-500 000;>500 000 inhabitants), tobacco smoking (never-, former-, current smoker), body mass index (<25, 25-29.9, and ≥30kg/m2), energy intake (kcal/d), alcohol consumption (g/d), night sleep duration (h/d), leisure time physical activity (METs-h/wk), hypertension (no/yes), hypercholesterolemia (no/yes), and by the other components.
Participants with any of the following conditions were excluded: cancer, cardiovascular disease (heart disease, stroke, or heart failure), respiratory disease (asthma or chronic obstructive pulmonary disease), musculoskeletal disease (arthritis, osteoarthritis, or hip fracture), depression requiring treatment, obesity, or type 2 diabetes.
Significant positive correlations were found between all dietary scores (). The HS-DRSI was moderately correlated with the AHEI (r=0.56), DASH (r=0.56), and MEDAS (r=0.59), and these scores were moderately to strongly correlated with each other (r=0.54-0.73). We found protective associations of similar magnitude to that found for the HS-DRSI per 1-standard deviation increment in the AHEI (HR, 0.90; 95%CI, 0.83-0.98), GDQS (HR, 0.91; 95%CI 0.84-0.98), MEDAS (HR, 0.89; 95%CI, 0.82-0.97), and MDS (HR, 0.91; 95%CI, 0.84-0.99) (). The results for the DASH-style diet were in the same direction but did not reach statistical significance.
Lastly, no significant differences in the associations with mortality were found between the HS-DRSI and any of the stratification variables (P for interaction>.05 in all cases) (). Excluding deaths in the first 2-years of follow-up yielded results consistent with the main analyses (HR quartile 4 vs quartile 1: 0.74; 95%CI, 0.58-0.94; P for trend=.02).
DISCUSSIONIn this retrospective cohort study, the HS-DRSI was developed to measure adherence to the 2022 healthy and sustainable dietary recommendations for the Spanish population. Higher adherence to the guidelines reflected optimal intake of key nutrients and was associated with a lower risk of all-cause mortality in a representative cohort of Spanish adults, including all participants and those without chronic morbidities at baseline (figure 1). Although significant results were found only for an HS-DRSI score of ≥ 9 points, the association appeared to be linear. The protective association was consistent across the main population subgroups and was of similar magnitude to that found for other well-known healthy dietary indices. Among the individual components of the HS-DRSI, meeting the recommended intake of nuts, dairy, and sweetened beverages, was inversely associated with all-cause mortality.

A major characteristic of the guidelines used to derive the HS-DRSI is the consideration of both the environmental and health impacts of food choices. This is mainly reflected in the prioritization of healthy plant-based foods while reducing animal food sources.5 Accordingly, we included a specific target of at least 1 serving of plant protein in the main meals. Gradually, other countries have started incorporating sustainability aspects into their dietary guidelines, yet only a minority comprehensively address the environmental impact of food choices.12 The HS-DRSI includes 16 components that reflect recommendations for consumption for the 6 food groups included in the guidelines (fruit and vegetables, potatoes and other tubers, cereals, sources of vegetable and animal protein, olive oil, and water), as well as 4 components based on additional food groups proposed to be minimized or limited (processed meat, other processed foods, salt, and unhealthy beverages). The HS-DRSI shares common components with other well-established dietary indices, giving positive scores for higher consumption of fruits, vegetables, nuts, and legumes, and lower consumption of red and processed meats, salt, and sweetened beverages.13–15 Consumption of fish and seafood, preference for white meat, and olive oil as the fat of choice are characteristic targets of the Mediterranean pattern.13 Although the scoring systems vary among different indices, both the HS-DRSI and the MEDAS are based on dichotomous scoring with defined cutoffs for food consumption. A dichotomous scoring system was chosen over a more complex approach to facilitate interpretation and implementation beyond research (eg, in clinical settings).
The results from this study show that compliance with the dietary guidelines was poor, with only 22.8% of the participants meeting 9 or more of the recommendations. This is not surprising, as previous evidence suggested that adherence to the Mediterranean diet declined in the past decades in Spain.16,17 These findings highlight the significant potential for improving diet through clinical and public health interventions, specifically, targeting population groups with poorer adherence, as well as emphasizing the recommendations with the lowest adherence, which are those related to a healthy plant-based dietary pattern, ie, increasing consumption of vegetables, including at least 1 serving of plant-based protein foods at main meals, prioritizing whole grain products, and reducing consumption of meat.
Our findings support those of previous population-based studies reporting inverse associations between adherence to the Mediterranean diet and mortality, wherein the guidelines are mainly circumscribed in both Mediterranean18,19 and non-Mediterranean regions.20 We observed a 24% reduction in mortality risk among participants in the highest vs lowest HS-DRSI quartiles. The magnitude of the association for a 1 standard deviation increment in adherence to the HS-DRSI (8%) was similar to that found for other indices not considering sustainability, such as the AHEI (10%), the GDQS (9%), the MEDAS (11%), and the MDS (9%). These results are in line with previous studies that have shown associations between individual healthy diet indices and lower mortality.21,22 Lastly, our study is consistent with previous research indicating that adherence to food-based recommendations is associated with lower all-cause mortality.23,24
Among the individual components of the HS-DRSI, meeting the recommendations for nuts, vegetables, processed meat, dairy, and sweetened beverages was associated with reduced mortality. Consumption of nuts and vegetables has been inversely associated with all-cause death in several prospective cohort studies25,26, while consumption of processed meat and sweetened beverages has been extensively associated with all-cause and cardiovascular mortality.27,28 Regarding dairy consumption, the evidence is mixed in relation to its impact on health, with 2 recent meta-analyses finding no evidence for a protective or detrimental association with all-cause mortality29,30; therefore, the new Spanish guidelines recommend reducing consumption of these products to <3 servings/d based only on their high environmental impact.
The strengths of this study include the use of a large cohort representative of the adult population of Spain, with long follow-up and a comprehensive assessment of usual food consumption using a validated dietary history. An advantage of dietary indices that comprise only food-based components over those including both foods and nutrients is that they capture the complexity of the food matrix, the interaction between nutrients, the presence of nonnutrients, and the synergies that occur through the combination of different dietary components, which are better captured by the overall dietary pattern.3,31 Moreover, they facilitate adaptation to easy dietary assessment tools for clinical settings.
Several limitations of the study should also be acknowledged. First, whereas “water as the drink of choice” was included in the conceptualization of the index, we could not ascertain adherence to this item due to the lack of data on water intake in this cohort. To provide a more comprehensive assessment of dietary intake, food frequency questionnaires and other tools for this purpose should be expanded to include water consumption; future updates or studies in other settings should consider extending the score to incorporate this core component. The guidelines also provide recommendations on physical activity over the lifespan that were not addressed in this study. Complementary studies could assess adherence to this dimension independently or as part of a lifestyle score.32
Second, the dietary guidelines do not include recommendations on alcoholic beverage consumption, which was therefore not considered a component in the index.
Third, diet was measured only at baseline; thus, potential changes in dietary habits that may have occurred during follow-up were not assessed, which could lead to misclassification and incorrect associations.
Fourth, inherent to self-reported information, a certain level of recall bias and misclassification in food consumption cannot be ruled out. Additionally, information on lifestyle behaviors and morbidity was also self-reported, entailing potential measurement error.
Fifth, due to a large decrease in sample size, analyses among healthy participants showed wide confidence intervals, suggesting less precise results. Nonetheless, estimates showed a clear protective effect, stronger than for those with chronic conditions at baseline, emphasizing the ability of HS-DRSI to prevent premature death. Similarly, since there were few participants with higher scores, characterization of the impact of high adherence on mortality was not properly addressed; more evidence is needed to understand whether a ceiling effect may occur and at what level of adherence.
Sixth, we could not assess cause-specific mortality due to the small number of cases in the study population. Despite adjustment for multiple confounders, residual confounding by unmeasured or imprecisely measured variables (eg, socioeconomic status, comorbidities) may persist; therefore replication of these analyses in other cohorts in Spain is recommended.
Lastly, while our findings provide valuable insight for the Spanish population, their generalizability is limited due to cultural, nutritional, and health differences in other countries.
CONCLUSIONSWe have designed a dietary index to assess adherence to the Dietary Recommendations for the Spanish population updated in 2022. In a nationally representative cohort of adults from Spain, higher adherence to the guidelines was associated with a lower risk of all-cause mortality in participants with and without chronic diseases. Efforts should be made to promote adherence to these guidelines, focusing on the recommendations with lower compliance (ie, consumption of fruits and vegetables, whole grains, plant-based protein foods, and reducing meat consumption) and evaluating their effectiveness in preventing major chronic health conditions in diverse population subgroups.
FUNDINGThis work was supported by grants from the Instituto de Salud Carlos III, State Secretary of R+D+I of Spain ERDF/ESF (European Regional Development Fund/European Social Fund) (FIS 20/1040, 23/272). VVC holds a “Training of university professors - FPU” grant (FPU19/06572) from the Spanish Ministry for Universities. The funding agencies had no role in study design, data collection and analysis, interpretation of results, manuscript preparation, or the decision to submit this manuscript for publication.
ETHICAL CONSIDERATIONSWritten informed consent was provided by all study participants. The study was approved by the Clinical Research Ethics Committee of La Paz University Hospital in Madrid and conducted in accordance with the Declaration of Helsinki for biomedical research. SAGER guidelines regarding potential sex/gender bias have been followed.
STATEMENT ON THE USE OF ARTIFICIAL INTELLIGENCENo artificial intelligence was used in the preparation of this article.
AUTHORS’ CONTRIBUTIONSThe authors’ contributions were as follows: V. Vega-Cabello and E. López-García designed the research; V. Vega-Cabello performed the statistical analyses; V. Vega-Cabello and E. López-García drafted the manuscript; E. López-García supervised the conduct of the research; all authors reviewed the manuscript for important intellectual content and read and approved the final manuscript; and V. Vega-Cabello and E. López-García had primary responsibility for final content.
CONFLICTS OF INTERESTNone of the authors has a conflict of interest related to this work.
- -
National dietary guidelines provide evidence-based recommendations on food consumption that ensure optimal nutrient intake, promote health, and prevent chronic diseases related to unhealthy diets. New evidence on the effects of diet on health and food sustainability has not yet been included in most national dietary guidelines.
- -
The healthy and sustainable dietary recommendations for the Spanish population index (HS-DRSI) was developed in accordance with the new Spanish recommendations, based on the impacts of food consumption on health and the environment. Higher adherence to the dietary guidelines led to optimal nutrient intake and was associated with a lower risk of all-cause mortality in the general population and among healthy participants.
Supplementary data associated with this article can be found in the online version, at https://doi.org/10.1016/j.rec.2024.11.008