Congestion plays a major role in the pathogenesis, presentation, and prognosis of heart failure and is an important therapeutic target. However, its severity and organ and compartment distribution vary widely among patients, illustrating the complexity of this phenomenon. Although clinical symptoms and signs are useful to assess congestion and manage volume status in individual patients, they have limited sensitivity and do not allow identification of congestion phenotype. This leads to diagnostic uncertainty and hampers therapeutic decision-making. The present article provides an updated overview of circulating biomarkers, imaging modalities (ie, cardiac and extracardiac ultrasound), and invasive techniques that might help clinicians to identify different congestion profiles and guide the management strategy in this diverse population of high-risk patients with heart failure.
Keywords
Congestion in heart failure (HF) has traditionally been considered a hemodynamic concept, defined as increased central filling pressures that commonly result in or are the consequence of fluid accumulation in the intravascular and extravascular compartments.1,2 However, congestion is not synonymous with fluid overload, as increased intracardiac pressures are not always associated with total blood volume expansion and vice versa.3
Congestion and fluid accumulation in HF result from different mechanisms and complex interactions. Cardiac dysfunction results in increased backward pressure and volume redistribution. Additionally, it leads to neurohormonal activation to maintain an effective circulatory volume and adequate organ perfusion pressure.4 These biological responses cause sodium and water avidity in the kidneys, aggravating and perpetuating fluid overload. Although total blood volume expansion has classically been considered a homogeneous, simple, and passive condition, current evidence supports the role of fluid accumulation as a complex, heterogeneous, and dynamic process that modifies the natural course of HF syndromes.5,6
CONGESTION PHENOTYPESThe complex, heterogeneous, and dynamic interplay between the interstitial and intravascular fluid compartments is one of the main reasons explaining the wide variability in the distribution and severity of congestion/fluid accumulation among patients with HF.
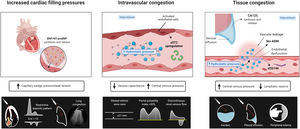
Intravascular congestionIncreased central filling pressures are a crucial feature of most HF decompensations.1 Although this elevation in filling pressures has been classically considered a consequence of total blood volume expansion and the inability of the failing heart to accommodate and distribute central blood volume, changes in systemic and pulmonary venous capacitance function also play a crucial and unappreciated role in regulating central hemodynamics.
The venous system can store large amounts of fluid (approximately 70% of total blood volume), mainly distributed in the low resistance and high capacitance splanchnic vasculature (storing up to 20%-30% of the total blood volume-unstressed volume). Nonetheless, this “venous reservoir” system contains large amounts of α1 and α2 adrenergic receptors, making them highly sensitive to stimulation by the sympathetic nervous system.7 Therefore, impaired storage capacity or increased sympathetic tone may result in an almost instantaneous volume shift from the splanchnic vessels to the central circulation, leading to increases in preload without any changes in total blood volume.8 Several studies have found a poor correlation between intracardiac pressures and direct measurement of circulating blood volume or weight change, clearly arguing against the concept that sodium and water retention are the sole drivers of increases in filling pressure.3,9–11
Tissue congestion/fluid overloadFluid retention leads to a progressive and sustained increase in hydrostatic pressures in the vascular compartment. Together with other factors such as vascular permeability and Starling forces between the plasma and interstitium, part of the fluid overload is shifted toward the interstitial compartment because of net capillary filtration.12 Because of markedly increased lymphatic function,13 interstitial fluid is initially efficiently drained, without fluid accumulation. Nevertheless, when lymph flow reaches a plateau, the rate of transudation from capillaries into the interstitium exceeds lymphatic capacity, and fluid starts to build up in the interstitial space.14 Several mechanisms can lead to lymphatic dysregulation in patients with HF. Among them, decreased lymphatic drainage due to elevated central venous pressure (CVP), impaired lymph vessel integrity and compliance, lymphatic valve dysfunction, impaired renal lymphodynamics, and maladaptive lymphangiogenesis contribute to interstitial fluid accumulation.15 Importantly, the interstitium comprises a network of glycosaminoglycans (GAGs), collagen, and elastin fibers that attempt to maintain the interstitial structure and act as a buffer since most water molecules and cations, such as sodium in the interstitial space, are bound to these GAGs.14 However, long-term GAG saturation and increased permeability due to various conditions such as diabetes or inflammation will alter the integrity of this network and lead to tissue congestion.
ASSESSMENT OF INTRAVASCULAR CONGESTIONInvasive assessmentCongestion, or the increase of right and left ventricular filling pressures, are hallmark features of decompensated HF.16 Right heart catheterization is the most accurate method to evaluate the elevation in cardiac filling pressures by directly measuring right atrial pressure (RAP) and the pulmonary arterial wedge pressure. Persistent high filling pressures usually precede HF hospitalizations, and implantable pressure sensor devices in the pulmonary artery (which monitor pulmonary artery pressures) have been suggested to reduce HF hospitalizations.17 Although it is considered the gold standard for diagnosing intravascular congestion,18 routine use of invasive assessment is limited due to its technical complexity, high cost, and availability. Furthermore, the clinical utility of pressure-guided therapies remains to be more extensively evaluated. For instance, in the acute setting, the addition of pulmonary artery catheterization to guide decongestive therapy did not affect overall mortality and hospitalization in the Evaluation Study of Congestive Heart Failure and Pulmonary Artery Catheterization Effectiveness (ESCAPE trial).19
Similar to invasive cardiac filling pressure measurements, blood volume status and composition can also be quantified using the clinically approved blood volume analyzer (BVA) (BVA100TM, Daxor Corporation, United States of America), which uses the gold standard indicator dilution technique with an Iodine131-tagged albumin tracer to provide quantitative measurement of total blood volume, plasma volume, and red blood cell volume.20 Interestingly, preliminary data suggest a disconnection between intracardiac pressures and direct measurement of circulating blood volume using this technology,3,10 highlighting the concept that congestion is the product of a distinct cardiovascular pressure-volume interplay.
Symptoms and signsJugular venous pressureIncreased jugular venous pressure is considered one of the most valuable physical findings indicative of increased central filling pressures.21 However, its precise estimation is difficult, and there is significant interobserver variability.22 As a consequence, the reported accuracy for estimating CVP from the jugular veins ranges from 43% to 79%.23
Orthponea and bendopneaThe supine position increases venous blood flow from the lower extremities and the venous reservoirs, which may raise venous return and elevate pulmonary venous and capillary pressures, promoting the exacerbation of symptoms of dyspnea in the supine position. In addition, worsening dyspnea when bending forward is associated with increased RAP, pulmonary arterial wedge pressure, and other intravascular congestion features.24
Third heart soundThe third heart sound is the result of early diastolic left ventricular (LV) filling and abrupt deceleration of the atrioventricular blood flow. The higher the transmitral inflow rate and the steeper the rapid filling, the greater the deceleration of the LV inflow, and the more likely a third heart sound will be generated.25 Accordingly, the third heart sound is a surrogate of restrictive diastolic filling and, thus, of increased LV filling pressures. It shows high specificity but low sensitivity and also requires clinical expertise.
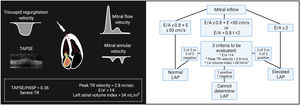
Ultrasound evaluationCardiac ultrasoundLeft-sided filling pressuresThe American Society of Echocardiography and the European Society of Cardiovascular Imaging have developed a stepwise algorithm to estimate filling pressures, especially left atrial pressure. These algorithms integrate mitral pulsed-wave inflow velocities, mitral annular e’ velocity, E/e’ ratio, peak velocity of the tricuspid regurgitation (TR) jet, and left atrium maximum volume index (figure 1).26 This algorithm has shown an overall accuracy of 87% for estimating LV pressures, with an incremental benefit when combined with clinical evaluation.27 However, although this algorithm performs better when estimating LV filling pressures in individuals with HF and reduced LV ejection fraction (HFrEF), it is still associated with prognosis in those with preserved LV ejection fraction.28
 function such as tricuspid annular plane systolic excursion (TAPSE) and the TAPSE/pulmonary artery systolic pressure (PASP) ratio, and the severity of tricuspid regurgitation are noninvasive markers of increased right-sided filling pressures. E/A, mitral early diastolic velocity/atrial diastolic velocity ratio; E/e′, mitral early diastolic velocity/average early diastolic e′ velocity ratio; LA, left atrial; LAP, left atrial pressure; TR, tricuspid regurgitation.")
Noninvasive assessment of cardiac filling pressure. Elevated left ventricular filling pressure is defined as either E/A ratio ≥2, or if E/A is <2, at least 2 of the 3 parameters shown must be above cutoff values. Surrogates of right ventricular (RV) function such as tricuspid annular plane systolic excursion (TAPSE) and the TAPSE/pulmonary artery systolic pressure (PASP) ratio, and the severity of tricuspid regurgitation are noninvasive markers of increased right-sided filling pressures. E/A, mitral early diastolic velocity/atrial diastolic velocity ratio; E/e′, mitral early diastolic velocity/average early diastolic e′ velocity ratio; LA, left atrial; LAP, left atrial pressure; TR, tricuspid regurgitation.
Surrogates of right ventricular (RV) function, such as tricuspid annular plane systolic excursion (TAPSE) or the TAPSE/pulmonary artery systolic pressure ratio as a noninvasive global marker of RV-pulmonary arterial coupling, are strongly associated with prognosis.29,30 Functional TR is the final consequence of RV-pulmonary arterial uncoupling, pulmonary hypertension and/or RV dysfunction leading to fluid overload, systemic congestion, and further RV impairment.31 There are 2 important points regarding right-sided echo parameters in HF. First, the interplay between them improves risk stratification. Patients with both RV-pulmonary arterial uncoupling and significant TR are at the highest risk of events following an episode of HF decompensation and are associated with severe systemic congestion features.32,33 Second, the predictive value and clinical impact of these parameters seem to be higher in patients with HF and preserved LV ejection fraction (HFpEF) than in those with HFrEF.33 In HFpEF, right heart dysfunction-pulmonary hypertension constitutes an established phenotype characterized by severe systemic congestion and an ominous prognosis that commonly overwhelm left-heart dysfunction features. In contrast, in HFrEF, right heart dysfunction may be a proxy of advanced HF.
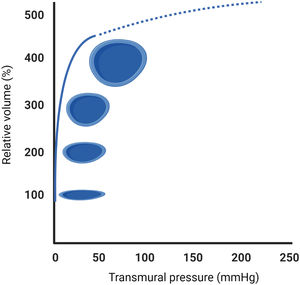
Evaluation of extracardiac congestion using bedside ultrasoundThe pressure-volume diagram of a vein shows that compliance is extremely high in the low-pressure range (figure 2). In other words, unstressed veins can accept relatively large blood volumes with a little pressure build-up (functional blood reservoirs). However, further stretching the vein's radius due to volume overload and alterations in venous tone by smooth muscle stimulation (ie, sympathetically mediated vasoconstriction) will eventually reach the upper limits of the systemic venous capacitance (maximal buffering capacity), causing a rapid rise in venous pressures and wall tension (stressed veins) without further increase in the vein's luminal area (maximal dilatation) (figure 2). Nonetheless, studying the physiological components of the venous system in humans is invasive and technically challenging, limiting its clinical applicability. Therefore, there is increased interest in searching for other noninvasive alternatives to estimating venous capacity.
. However, at unphysiologically high transmural pressures, compliance is quite low (dashed line).")
Point-of-care ultrasound (POCUS) has recently emerged as a promising diagnostic tool at the bedside to assess extracardiac organ/vascular congestion and monitor decongestive therapy. POCUS is a limited, centered, and real-time ultrasound examination consisting of the focused evaluation of central vessels (inferior vena cava [IVC] and jugular vein), abdominal compartment (hepatic, portal, and renal veins), and lungs to detect ultrasonographic findings that may help clinicians to indirectly monitor venous blood volume, venous capacitance, and lung congestion. A detailed description of how to perform POCUS is summarized in the .
Central vesselsInferior vena cavaThe IVC is a highly compliant large conduit vessel transferring blood from organs below the diaphragm to the right heart. In essence, IVC is an anatomical continuation of the right atrium (RA). Consequently, as RAP increases, it is transmitted backward into the IVC, modifying its size and collapsibility.
Although several studies have shown a moderate correlation between IVC diameter and collapsibility with RAP,34,35 these parameters yield more accurate results when used to discriminate between normal/low (IVC diameter <2.1cm and collapse> 50%) vs high CVPs (IVC diameter> 2.1cm with <50% collapse).34 In other words, IVC dimensions and collapsibility can detect elevated RAP, but they are not sufficiently precise to estimate RAP values. Moreover, although changes in IVC diameter and collapsibility have been shown to be useful for monitoring diuretic response36,37 and stratifying risk,38,39 further studies are needed to establish whether an IVC-guided approach is more effective than usual care in acute HF (AHF).40
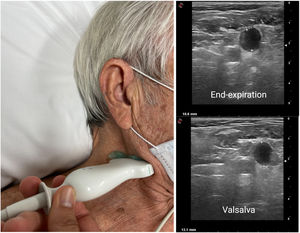
Internal jugular vein ultrasoundThe diameter of the internal jugular vein (IJV) in healthy individuals and euvolemic patients is small (∼0.10-0.15?cm) but increases several times during a Valsalva maneuver (usually up to ∼1cm). In patients with elevated RAP or intravascular congestion, the diameter of the IJV increases at rest, leading to a reduced IJV ratio. An IJV ratio <4 is considered abnormal (the ratio may decrease <2 in severe congestion) (figure 3) and predicts worse outcomes independent of natriuretic peptide values.41,42
Abdominal compartmentHepatic veins
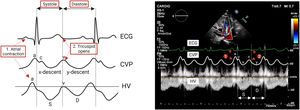
Hepatic veins (HV) drain into the RA through IVC. Therefore, HV flow patterns closely correlates with pressure changes in the RA (analogous to jugular venous pulse tracing) (figure 4). The normal HV waveform is triphasic with 4 components, including a retrograde A wave (atrial systole), anterograde S wave (ventricular systole), transitional V wave (atrial overfilling transition wave), and an anterograde D wave (ventricular diastole).34

There is a systolic predominance in HV flow in individuals with low or normal RA pressures.In contrast, this systolic predominance is lost when RAP increases.20 In patients with RV dysfunction or hemodynamically significant TR, there is a reversal of the S wave-to=D wave ratio (S <D) or even a retrograde S wave as a consequence of the regurgitation of blood into the RA and the inability of the failing ventricle to move the tricuspid annulus toward the cardiac apex. However, although TR and RV dysfunction commonly coexist, the S wave does not become retrograde in the absence of severe TR.43 Therefore, a detailed echocardiographic examination should be performed if the HV Doppler signal shows a retrograde S wave.43
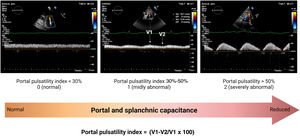
Portal veinPortal vein flow alterations have been proposed as a marker of venous congestion and RV dysfunction.44–47 Given its relatively low perfusion pressure (approximately 10mmHg), portal inflow is highly sensitive to elevations of outflow (downstream) pressures from the right heart. Therefore, when RAP is elevated (as in right-sided HF), and the maximal buffering capacity of the IVC has been reached, pressure variations in the RA during the cardiac cycle are transmitted into the portal system, increasing portal flow pulsatility (PPI> 30%) (figure 5). Similarly, reductions in splanchnic venous capacitance due to sympathetic activation can also contribute to portal inflow alterations as a consequence of the volume shift (autotransfusion) from splanchnic reservoir vessels. Interestingly, preliminary findings suggest that PPI is highly dynamic and improves considerably with diuretics.48 Although further studies are needed to confirm the usefulness of portal venous flow evaluation by Doppler ultrasound in HF, we envision that it might add valuable information to currently established protocols like IVC and lung ultrasound (LUS).
Renal venous ultrasound
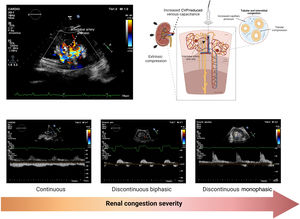
Elevation of CVP and intra-abdominal pressure are transmitted backward, causing increased interstitial and tubular hydrostatic pressure within the encapsulated kidney. Recently, ultrasound techniques to assess renal blood flow have demonstrated the utility of pulsed-wave Doppler evaluation to identify renal congestion.49,50 In normal conditions, intrarenal veins exhibit continuous flow independent of renal function. However, intrarenal veins become less compliant as CVP increases, dampening the continuous flow to a discontinuous pattern. Further increases in CVP may ultimately lead to a single flow phase in diastole (monophasic intrarenal venous flow [IRVF] pattern), in which renal venous outflow may exclusively depend on RV filling51 (figure 6).

Given the association between IRVF and CVP pressures, some may argue that an altered IRVF pattern is simply an alternative measure indicative of elevated CVP. However, because the kidneys are encapsulated organs, renal venous outflow does not depend exclusively on CVP but also on extrinsic factors that may exert extrarenal compression (eg, ascites, visceral edema, engorgement of splanchnic circulation). Furthermore, IRVF might become disrupted because of sympathetically mediated reductions in systemic and intrarenal venous capacitance irrespective of other metrics indicative of increased cardiac filling pressures. Indeed, a high proportion of patients admitted with AHF exhibit discontinuous IRVF patterns at admission,52 which strongly correlates with clinical outcomes independent of conventional prognostic factors, including CVP.51,53 Interestingly, preliminary data suggest that IRVF patterns are dynamic and may change with decongestive treatment,52,54 opening a new avenue for renal venous ultrasound as a potential marker for diagnosis and treatment guidance. However, further studies are needed to elucidate whether a therapeutic strategy based on the IRVF pattern in combination with other Doppler echocardiography-derived venous congestion-related findings is associated with improved clinical outcomes in patients with HF.
Circulating biomarkersNatriuretic peptidesBrain natriuretic peptide (BNP) and N-terminal pro-b-type natriuretic peptide (NT-proBNP) are useful markers for diagnosis and risk stratification in HF syndromes.55,56 Both are well-known surrogates of increased left-filling pressures and pulmonary arterial wedge pressure in patients with HF.55,57 However, their usefulness for assessing and grading fluid accumulation and tissue congestion is limited. For instance, ischemia and atrial fibrillation are associated with increased ventricular wall tension without necessarily being linked to congestion.55 Likewise, other factors such as age, body mass index, and renal function strongly influence plasma levels of natriuretic peptides (NPs).55 Thus, it is essential to consider these factors when interpreting NP levels.
Overall, greater reductions over time in NP levels identify patients with a better prognosis. For instance, in AHF, a more than 30% decrease in NPs has been established as a cutoff for identifying clinical and hemodynamic improvement.55 However, although there is a clear relationship between cardiac filling pressures and prognosis, changes in NPs may show only a weak or moderate relationship with surrogates of decongestion in AHF.14
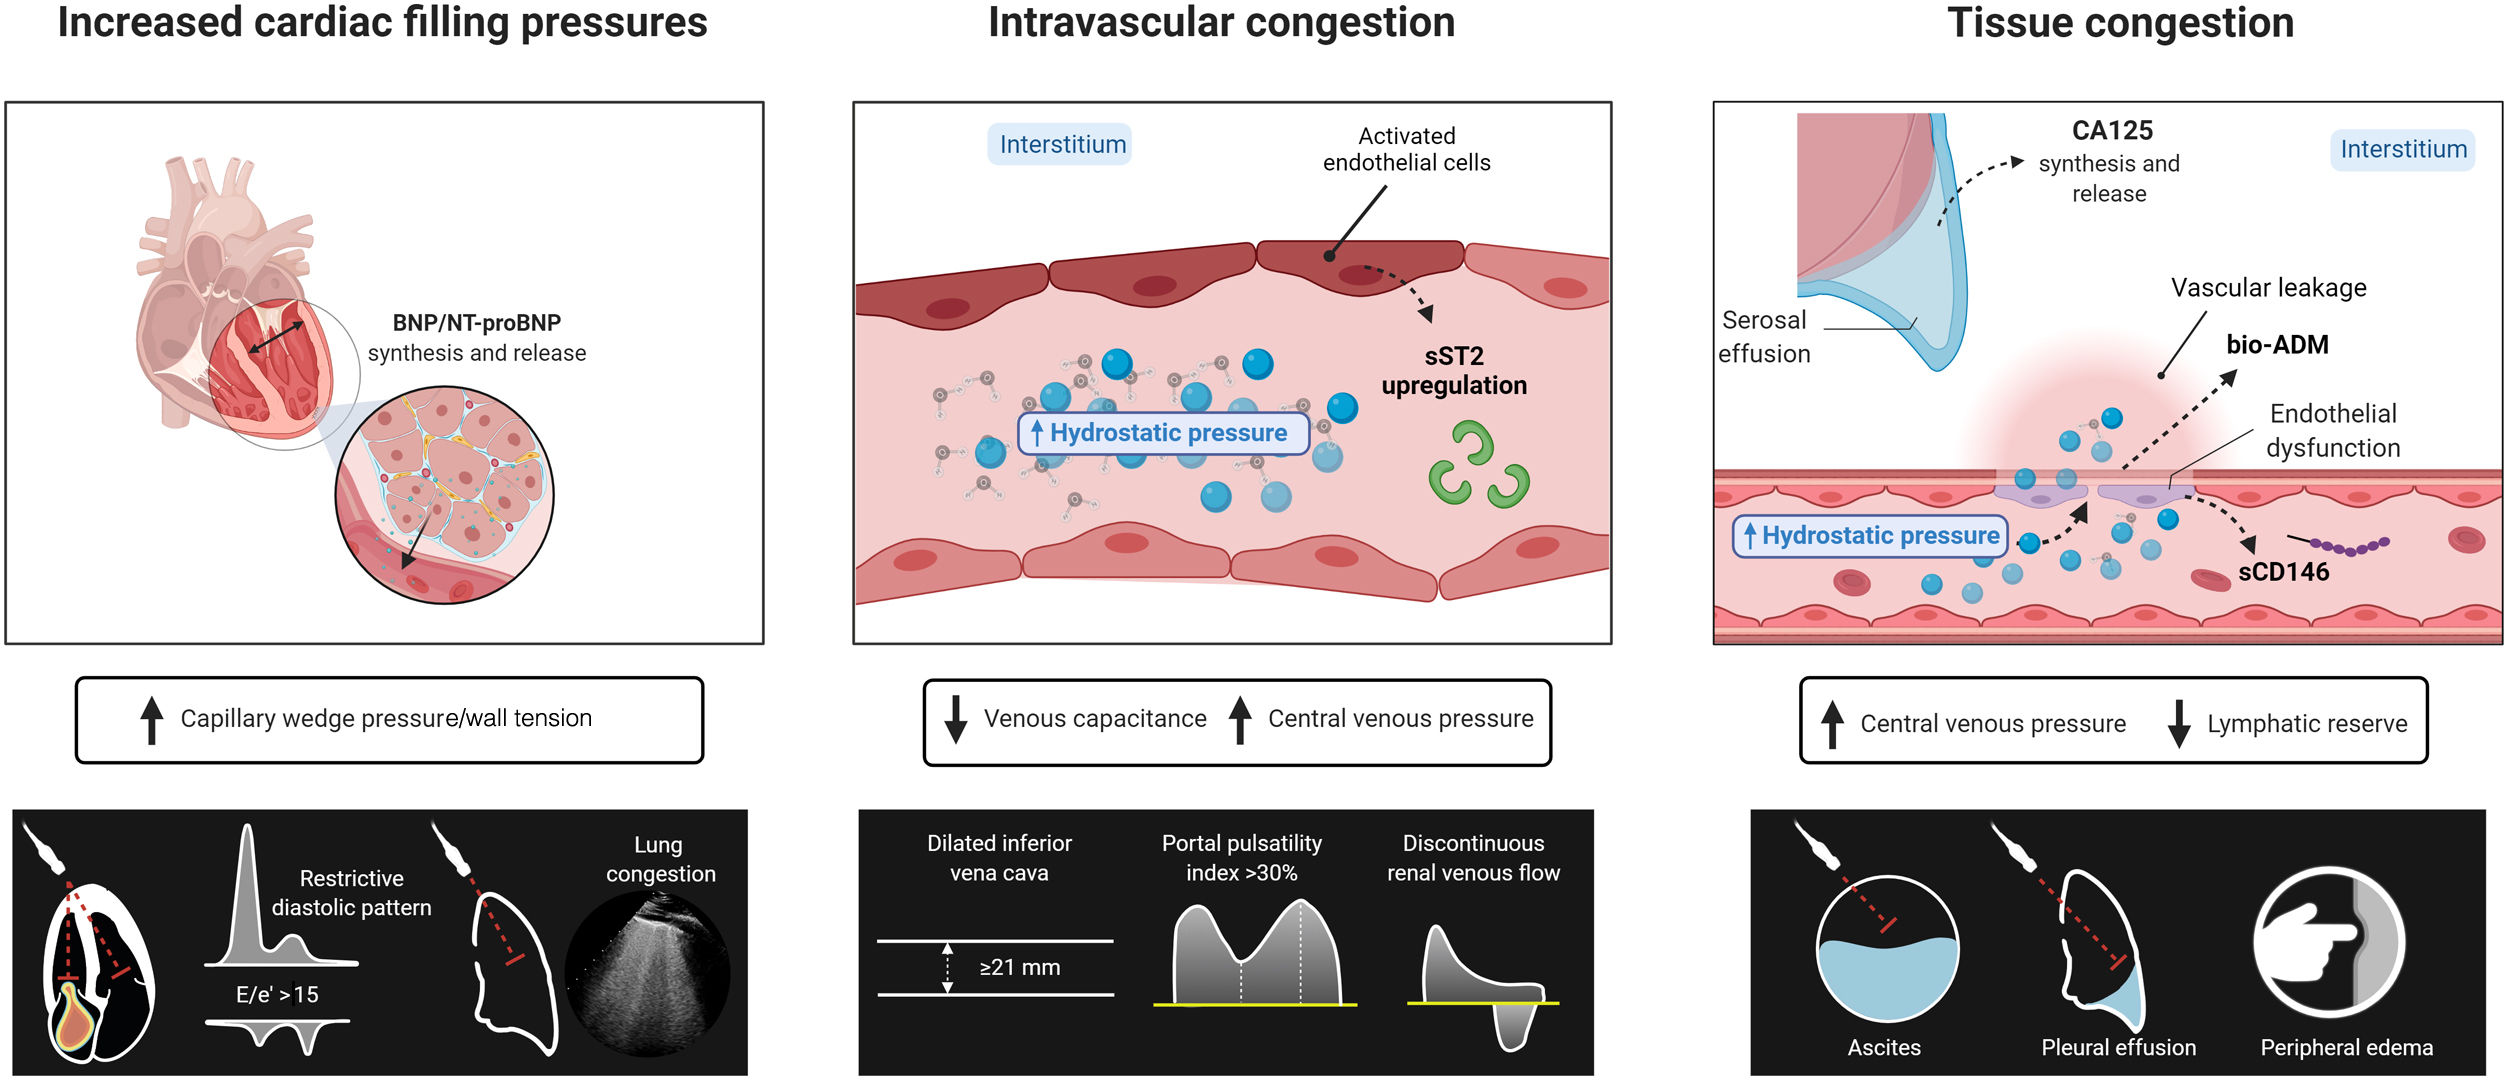
Soluble ST2Soluble suppression of tumorigenicity 2 (ST2) is a member of the Toll-like/interleukin-1 receptor superfamily.58 The soluble circulating form (sST2) has been shown to be a valuable marker for risk stratification in acute or chronic HF.59,60 As a marker of congestion, sST2 positively correlates with echocardiographic indicators of right-sided HF61 and invasively measured central venous and pulmonary wedge pressures.62 More recently, sST2 has also been identified as a surrogate of diuretic resistance.63 The mechanisms behind sST2 upregulation in AHF seem to be related to the peripheral release of proinflammatory cytokines by activated vascular endothelial cells and lungs in response to hemodynamic congestion and inflammation.64,65 However, more studies are required to evaluate the exact role of this biomarker as a surrogate of congestion and the utility of serial assessment for monitoring and guiding decongestion.
CD146A cluster of differentiation 146 (CD146) is a glycoprotein expressed on endothelial cells, smooth muscle cells, and pericytes within the whole vascular tree.66 This protein interacts with various ligands and mediates pleiotropic functions in vessel homeostasis.66 D146 is overexpressed in AHF syndromes and is associated with inflammation, vascular injury, and endothelial dysfunction.67,68
Higher CD146 levels have been reported in patients with AHF and clinical surrogates of congestion.69 A peripheral venous stress study performed by inflating a pressure cuff over forearm veins induced a rapid and pronounced increase in circulating CD146 in the congested arm.70 These data suggest that CD146 could potentially be a reliable biomarker of venous congestion. However, the evidence endorsing the association of this biomarker with other parameters of congestion and its clinical utility for characterizing the profile of congestion is limited.
ASSESSMENT OF TISSUE CONGESTIONVolume overload is usually a more gradual phenomenon resulting from the avidity of sodium and water in the renal tubule, an imbalance between the hydrostatic and oncotic pressures of the intravascular and interstitial compartment, and reduced lymphatic reserve.
Symptoms and signsSystemic tissue congestionAscites and peripheral edema usually indicate interstitial/third space fluid accumulation. Peripheral edema offers high specificity for diagnosing tissue congestion. However, its sensitivity is low,18 as other comorbidities such as venous insufficiency, renal failure, and hypoalbuminemia may also contribute to its presence. Likewise, serosal effusions are also found in several conditions other than HF.
Pulmonary tissue congestionThe main manifestations of pulmonary tissue congestion are rales and pleural effusion. However, their discriminatory accuracy for estimating congestion in HF is limited, and their absence does not exclude pulmonary congestion in HF patients.71
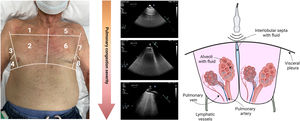
Ultrasound evaluationLung ultrasoundLUS is a quantitative, simple, and rapid method for identifying and quantifying extravascular lung fluid. In a normally aerated lung, the pleural line (A-line) will be the only structure that can be visualized with LUS. A-lines are visualized as hyperechogenic, thin, and horizontal lines that move with respiration due to visceral and parietal pleura sliding during the respiratory cycle. In patients with suspected or confirmed HF, the increased extravascular lung water and interlobular septa thickening due to edema creates vertical reverberation artifacts known as “B-lines” (figure 7). When these B-lines are numerous, they merge and form confluent zones, identifying zones of alveolar edema (figure 7). LUS is already widely used for diagnosis and prognosis in different HF scenarios.72–74 Furthermore, the number and location of B-lines seem to be dynamic and change rapidly after decongestive therapy, making them an attractive marker for monitoring lung decongestion.

Nonetheless, some caveats need to be acknowledged when using LUS in daily clinical practice. First, B-lines are only an expression of lung aeration loss. Accordingly, LUS does not distinguish between the nature of fluid (transudate vs exudate), the reason for interlobular septal thickening (ie, fibrosis, edema), or the mechanism responsible for the transudation of fluid from the vessel to the interstitium (increased hydrostatic pressure or increased vascular permeability). Therefore, LUS should always be interpreted in the proper clinical context and in addition to other clinical and biochemical markers. Second, the optimal cutoff values for risk stratification in different clinical scenarios should be defined in larger prospective studies. Finally, although small controlled studies suggest the clinical utility of guiding therapy,75 larger randomized trials are required to demonstrate that LUS guided-treatment is safe, improves symptoms and quality of life, and long-term outcomes.
Circulating biomarkersCarbohydrate antigen 125Carbohydrate antigen 125 (CA125) is a high molecular weight glycoprotein encoded by the MUC16 gene in humans.76 It is expressed on the surface of serous cells as a membrane-bound protein and is released to the circulation in a soluble form.76 This biomarker is widely used for monitoring ovarian cancers.76 However, CA125 is also upregulated in other cancers and benign conditions related to volume expansion.76 The exact trigger for CA125 upregulation is unknown. However, activation of mesothelial cells in response to elevated hydrostatic pressure, mechanical stress, and inflammatory stimuli are postulated as the main ones.76 Cumulative evidence supports the association between circulating CA125 levels and parameters of congestion and fluid overload, especially proxies of tissue congestion/serosal effusions.76 For instance, in a large study in patients with AHF, the presence of pleural effusion, the severity of TR, and peripheral edema were factors strongly associated with CA125 levels.77 Additionally, recent small studies also support the association of this glycoprotein with renal venous congestion and elevated intra-abdominal pressures in patients with AHF.78,79
This biomarker has some remarkable properties. First, CA125 changes are strongly associated with disease severity and clinical outcomes, especially during the first weeks following an episode of worsening HF (transitional phase).76,80 A longitudinal study of 946 consecutive patients discharged for AHF showed that the long-term trajectory delineated by repeated measures of CA125 predicted long-term mortality (low risk when the biomarker decreased and high risk when it remained high or increased during follow-up).81 Second, circulating CA125 levels are not substantially modified by age, kidney function, ischemic etiology, atrial fibrillation, or LV ejection fraction.76 These advantageous properties suggest a clinical utility in the full spectrum of patients with HF and for monitoring the course of the disease. Additionally, 2 small randomized clinical trials show the potential of this biomarker for guiding diuretic therapy in patients with a recent episode of worsening HF.82,83 In CHANCE-HF, 380 patients with a recent HF decompensation and CA125 ≥ 35 U/mL were randomized to standard care vs CA125-guided therapy. In the CA125 arm, up/down titration of diuretics was more frequent, which translated into a reduction of 1-year HF hospitalizations.82
To correctly interpret CA125 levels in HF, some aspects must be highlighted. First, there is a time gap between congestion onset and CA125 upregulation and release (lagged effect). Accordingly, patients with long-standing fluid overload are more likely to show elevated circulating CA125 plasma levels. For instance, in patients with a more acute onset (minutes to hours), those with predominantly intravascular redistribution will probably show no CA125 upregulation.76 Second, CA125 has a long-circulating half-life (7-12 days).76 Thus, serial assessment of CA125 for monitoring decongestion should be performed in the first weeks and not during the first days of decompensation.76
Bio-adrenomedullinAdrenomedullin (ADM) is thought to maintain vascular integrity and permeability barrier function.84 In HF, current evidence indicates the utility of the bioactive form of ADM (bio-ADM) as a proxy for congestion and fluid accumulation.85 For instance, bio-ADM is positively associated with the severity of clinical congestion score in AHF patients.86 Furthermore, in patients with stable advanced HFrEF, bio-ADM correlated positively with surrogates of high intravascular pressures (pulmonary capillary wedge pressure, mean RAP, and NT-proBNP).87 Likewise, other studies indicated that bio-ADM also correlates with other surrogates of tissue congestion (CA125, edema).86,88 Therefore, we postulate that bio-ADM may reflect the integrated assessment of vascular and tissue congestion types as a marker of vascular permeability. Interestingly, in patients with clinical signs of residual congestion 7 days after hospital admission, bio-ADM levels were high at baseline and remained persistently elevated during this first week of hospitalization.89 However, the role of this biomarker for monitoring and guiding diuretic therapy requires further and more in-depth evaluation.
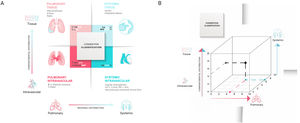
HOW TO INTEGRATE THESE TECHNIQUES: A PRACTICAL MULTIPARAMETRIC APPROACHMoving from traditional clinical assessment to a more comprehensive and multiparametric approach (figure 8) may allow us to better profile the severity and distribution of congestion. Furthermore, integrating imaging techniques and circulating biomarkers together with the clinical history and physical examination may improve the diagnostic accuracy of congestion status, revealing the predominant congestion phenotype. Therefore, we propose an integrative approach using NPs, CA125, and bio-ADM as circulating biomarkers and LUS and venous ultrasound as imaging techniques figure 9A). Patients can be classified according to their regional (ie, pulmonary and systemic) and compartmental (ie, intravascular and tissue) distribution of congestion. For instance, we envision 2 extreme situations. On the one hand, patients with right-sided HF may have a more gradual clinical onset, with a predominant systemic congestion distribution, with elevated CA125 and bio-ADM plasma levels as surrogate markers of tissue congestion and ultrasound evidence of reduced venous capacitance (ie, dilated IVC, portal pulsatility index> 30%, discontinuous intrarenal venous flow). On the other hand, those with a predominantly left-sided HF may have a more acute clinical presentation with pulmonary congestion assessed by LUS, higher NPs plasma levels, and E/e’ ≥ 15 as surrogate markers of increased left-sided filling pressures and normal or mildly abnormal CA125, bio-ADM, and venous ultrasound parameters. In between, we will find diverse degrees of overlap that may also change over time (figure 9B). The identification of the predominant congestion phenotype and changes over time by this multiparametric approach may allow: a) early detection of subclinical congestion; b) more accurate monitoring of congestion status; and c) improved treatment decision-making moving into a more precision medicine scenario. Regarding therapeutic implications, we postulate that patients with predominantly intravascular congestion may benefit more from modulation of vascular tone rather than aggressive decongestive strategies. Conversely, those with predominant tissue congestion/volume overload may be eligible for a more intensive diuretic approach while maintaining the vascular refill. Further studies are warranted to test the last postulates.

 regional and compartmental distribution of congestion by physical examination, circulating biomarkers, and imaging techniques. B: the graph has 3 axes, that refer to rising levels of pulmonary congestion and systemic congestion, acknowledging the different steps of compartmental distribution (intravascular and tissular congestion). This representation is actually the 3-dimensional (3D) version of the 2D graph presented in panel A. This 3D conceptual approach provides congestion coordinates, thus categorizing all dimensions of congestion all at once. In the example provided herein, the patient has predominantly systemic congestion (score 7/10) but also a moderate amount of pulmonary congestion (score 5/10). On the Y-axis, we can observe that the patient has intravascular congestion, and is transitioning toward tissue congestion. Bio-ADM, bioadrenomedullin; CA125, carbohydrate antigen 125; IVC, inferior vena cava; LV, left ventricular; LUS, lung ultrasound; NT-proBNP, N-terminal pro-b-type natriuretic peptide; PAWP, pulmonary artery wedge pressure; PPI, portal flow pulsatility index; POCUS, point-of-care ultrasound.")
A: 2-dimensional (2D) regional and compartmental distribution of congestion by physical examination, circulating biomarkers, and imaging techniques. B: the graph has 3 axes, that refer to rising levels of pulmonary congestion and systemic congestion, acknowledging the different steps of compartmental distribution (intravascular and tissular congestion). This representation is actually the 3-dimensional (3D) version of the 2D graph presented in panel A. This 3D conceptual approach provides congestion coordinates, thus categorizing all dimensions of congestion all at once. In the example provided herein, the patient has predominantly systemic congestion (score 7/10) but also a moderate amount of pulmonary congestion (score 5/10). On the Y-axis, we can observe that the patient has intravascular congestion, and is transitioning toward tissue congestion. Bio-ADM, bioadrenomedullin; CA125, carbohydrate antigen 125; IVC, inferior vena cava; LV, left ventricular; LUS, lung ultrasound; NT-proBNP, N-terminal pro-b-type natriuretic peptide; PAWP, pulmonary artery wedge pressure; PPI, portal flow pulsatility index; POCUS, point-of-care ultrasound.
Accurate assessment of congestion remains a challenge in daily clinical practice. Traditional clinical assessment has crucial limitations and drawbacks. A multiparametric approach including widely available imaging techniques and circulating biomarkers may improve its characterization and optimize depletive treatments.
FUNDINGThis work was supported by Instituto de Salud Carlos III and CIBER Cardiovascular funds (16/11/00420 and 16/11/00403).
AUTHORS’ CONTRIBUTIONSAll authors meet each of the following characteristics defined by the International Committee of Medical Journal Editors in the criteria for authorship of scientific articles:
- •
Substantial contributions to the conception or design of the work; or the acquisition, analysis, or interpretation of data for the work.
- •
Drafting the work or revising it critically for important intellectual content.
- •
Final approval of the version to be published.
- •
Agreement to be accountable for all aspects of the work in ensuring that questions related to the accuracy or integrity of any part of the work are appropriately investigated and resolved.
M. Fudim reports grants or contracts from the National Institutes of Health and the American Heart Association and consulting fees from Daxor, Axon Therapies, BSC, and Bodyport. N. Girerd reports payment or honoraria for lectures, presentations, speakers bureaus, manuscript writing, or educational events from AstraZeneca, Bayer, Boehringer-Ingelheim, Roche Diagnostics, Novartis, Vifor, and Lilly. J.L. Górriz reports honoraria for lectures from AstraZeneca, Boehringer-Ingelheim, Novonordisk and support for attending meetings and/or travel from Vifor. A. Bayés-Genís reports honoraria for lectures and/or consulting from Abbot, AstraZeneca, Boehringer-Ingelheim, Roche Diagnostics, Novartis, and Vifor. All other authors declare no competing interests.
Supplementary data associated with this article can be found in the online version, at https://doi.org/10.1016/j.rec.2022.07.009