A large proportion of patients with non—ST-segment elevation acute coronary syndrome (NSTEACS) are initially selected for medical management (MM) and do not undergo coronary revascularization during or immediately after the index event. The aim of this study was to explore the clinical pathways leading to MM in NSTEACS patients and their influence on prognosis.
MethodsPatient characteristics, pathways leading to MM, and 2-year outcomes were recorded in a prospective cohort of 5591 NSTEACS patients enrolled in 555 hospitals in 20 countries across Europe and Latin America. Cox models were used to assess the impact of hospital management on postdischarge mortality.
ResultsMedical management was the selected strategy in 2306 (41.2%) patients, of whom 669 (29%) had significant coronary artery disease (CAD), 451 (19.6%) had nonsignificant disease, and 1186 (51.4%) did not undergo coronary angiography. Medically managed patients were older and had higher risk features than revascularized patients. Two-year mortality was higher in medically managed patients than in revascularized patients (11.0% vs 4.4%; P < .001), with higher mortality rates in patients who did not undergo angiography (14.6%) and in those with significant CAD (9.3%). Risk-adjusted mortality was highest for patients who did not undergo angiography (HR = 1.81; 95%CI, 1.23-2.65), or were not revascularized in the presence of significant CAD (HR = 1.90; 95%CI, 1.23-2.95) compared with revascularized patients.
ConclusionsMedically managed NSTEACS patients represent a heterogeneous population with distinct risk profiles and outcomes. These differences should be considered when designing future studies in this population.
Keywords
An invasive management strategy is recommended for most patients with non—ST-segment elevation acute coronary syndrome (NSTEACS).1–3 Nevertheless, a large proportion of NSTEACS patients are initially managed medically; that is, they do not undergo coronary revascularization (CR) during or immediately after the index admission.4–6 This observation has triggered studies designed to evaluate specific therapeutic approaches for these patients.7–13 However, patients with NSTEACS may be selected for medical management (MM) for a number of different reasons, and we hypothesized that patient profiles and outcomes may vary accordingly.
The aims of this analysis were to study rates of the use of the different management strategies for NSTEACS in real-world practice from an international perspective, the main clinical pathways that lead to the nonuse of CR, and the relationship between these pathways and postdischarge outcomes.
METHODSStudy DesignEPICOR (long-tErm follow-up of antithrombotic management Patterns In acute CORonary syndrome patients - NCT01171404) is a prospective, international, observational, real-life practice, cohort study. The rationale, design, definitions, site selection, and baseline patient characteristics have been published previously.14–16 Briefly, 10 568 patients hospitalized for an acute coronary syndrome, with or without ST-segment elevation, within 24hours of symptom onset and who survived until hospital discharge were enrolled in 555 hospitals in 20 countries in Northern, Southern, and Eastern Europe and Latin America between September 2010 and March 2011. Patients were excluded from the study if they had ‘secondary’ acute coronary syndrome, any condition or circumstance that might limit completion of follow-up, serious comorbidities considered likely to limit life expectancy to less than 6 months, and previous enrolment in EPICOR or another clinical trial. All patients gave informed consent. Medical treatments for acute coronary syndrome, diagnostic and therapeutic procedures, and clinical events during the acute phase (pre- and in-hospital) were recorded using electronic case report forms. Patients were followed up by telephone calls for up to 2 years after hospital discharge. Vital status, hospitalizations, cardiovascular and bleeding events, and changes in medication were recorded for each call.
The definitions used in EPICOR have been presented elsewhere.14,16 A diagnosis of non—ST-segment elevation myocardial infarction required the presence of chest pain/discomfort, lack of persistent ST-segment elevation, left bundle branch block or intraventricular conduction disturbances, and elevation of cardiac biomarkers (creatinine kinase-isoenzyme MB and troponins) with at least 1 value above the 99th percentile of the upper reference limit. Unstable angina was defined as the presence of angina symptoms at rest or on minimal exercise, and transient ST-T changes, and no significant increase in biomarkers of necrosis but objective evidence of ischemia by noninvasive imaging or significant coronary stenosis on angiography. Cardiovascular events included myocardial infarction, heart failure, arrhythmia, unstable angina, ischemic stroke, and transient ischemic attack. Bleeding events included all kinds of bleeds.
Management StrategiesTwo management strategies were defined for patients with NSTEACS: a) CR, which included patients who underwent any kind of CR (either percutaneous or surgical) during the index admission, and b) MM, for those discharged without CR. According to the reasons for MM, 3 subgroups were predefined: a) patients who did not undergo diagnostic coronary angiography (CAG–); b) patients who underwent CAG and had significant (at least 1 stenosis > 50% in 1 coronary artery) coronary artery disease (CAD) but did not undergo CR (CAG+, CAD+), and c) patients who underwent angiography and had no significant CAD (CAG+, CAD–).17
Statistical AnalysisBaseline characteristics, hospital management, and in-hospital outcomes for patients with NSTEACS were compared according to the initial management strategy. Comparisons were made between CR and MM or across the 3 MM subgroups using chi-square tests. In a second step, we investigated the independent predictors of selection for angiography or MM. We used univariate logistic regression models to assess any association between angiography or MM and individual covariates. To identify the strongest independent predictors, we used multivariable logistic regression. We forced the inclusion of geographical region (Northern Europe, Eastern Europe, Southern Europe, and Latin America) and type of hospital (regional, nonuniversity general, university general, and private) into the model. Additionally, we fitted a random-effect at the hospital level to account for within-hospital clustering of events. We used a forward stepwise variable selection with a P-value cut-off of .05 to select a final model. Finally, the impact of MM on 2-year outcomes was studied. Comparisons of clinical outcome rates (mortality, cardiovascular events, and bleeding events) during follow-up between the management groups were done by fitting a Cox proportional hazards model for time to death or time to first event, censored at 2 years postdischarge. In our minimally adjusted Cox models, we adjusted for age, sex, geographical region, type of hospital (as described above), and a random-effect (shared frailty) term at the hospital level. In our fully adjusted models, we additionally adjusted risk factors associated with 1-year mortality identified from our previous publication.18
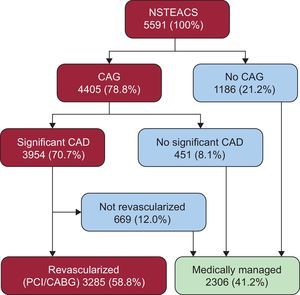
RESULTSManagement Strategies for Patients With Non—ST-segment Elevation Acute Coronary SyndromeA total of 5625 NSTEACS patients were enrolled at hospital discharge. Data on in-hospital management strategies were available for all except 34 (0.7%) of these. Of the remaining 5591 patients, 4405 (78.8%) underwent CAG (Figure 1). Of these, 3954 patients (70.7%) had CAD, and 3285 (58.8%) underwent CR in hospital. Therefore, a total of 2306 patients (41.2%) were medically managed. Most MM patients (51.4%, n = 1186) did not undergo CAG during hospitalization (21.2% of total population), 451 (19.6% of MM, 8.1% of total population) lacked significant CAD, and 669 (29.0% of MM, 12.0% of total population) had significant CAD, but CR was not attempted (Figure 1).

Distribution of EPICOR NSTEACS patients according to initial revascularization strategy and clinical pathways leading to medical management. CABG, coronary artery bypass graft; CAD, coronary artery disease; CAG, coronary angiography; NSTEACS, non—ST-segment elevation acute coronary syndrome; PCI, percutaneous coronary intervention.
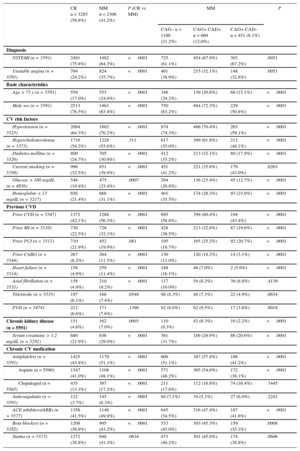
Patients who received MM were older and less likely to present with non—ST-segment elevation myocardial infarction, but more often had prior cardiovascular disease, comorbidities, and cardiovascular medications (Table 1). They also had more severe cardiac disease (Table 1). When characteristics were compared across the 3 predefined subgroups of MM patients, significant differences were found again, with a gradient from younger age and lower comorbidity and cardiovascular burden among CAG+ CAD– patients to older and sicker patients among CAG– patients. Significant regional differences were found in the rate of MM (data not shown).
Baseline Characteristics of Non—ST-segment Elevation Acute Coronary Syndrome Patients by Management Strategy
| CR n = 3285 (58.8%) | MM n = 2306 (41.2%) | P (CR vs MM) | MM | P | |||
|---|---|---|---|---|---|---|---|
| CAG– n = 1186 (21.2%) | CAG+ CAD+ n = 669 (12.0%) | CAG+ CAD– n = 451 (8.1%) | |||||
| Diagnosis | |||||||
| NSTEMI (n = 5591) | 2491 (75.8%) | 1482 (64.3%) | <.0001 | 725 (61.1%) | 454 (67.9%) | 303 (67.2%) | .0051 |
| Unstable angina (n = 5591) | 794 (24.2%) | 824 (35.7%) | <.0001 | 461 (38.9%) | 215 (32.1%) | 148 (32.8%) | .0051 |
| Basic characteristics | |||||||
| Age > 75 y (n = 5591) | 559 (17.0%) | 553 (24.0%) | <.0001 | 346 (29.2%) | 139 (20.8%) | 68 (15.1%) | <.0001 |
| Male sex (n = 5591) | 2513 (76.5%) | 1463 (63.4%) | <.0001 | 750 (63.2%) | 484 (72.3%) | 229 (50.8%) | <.0001 |
| CV risk factors | |||||||
| Hypertension (n = 5525) | 2084 (64.3%) | 1603 (70.2%) | <.0001 | 874 (74.3%) | 466 (70.4%) | 263 (59.1%) | <.0001 |
| Hypercholesterolemia (n = 5373) | 1716 (54.2%) | 1228 (55.6%) | .311 | 617 (55.0%) | 399 (61.8%) | 212 (48.1%) | <.0001 |
| Diabetes mellitus (n = 5526) | 800 (24.7%) | 705 (30.9%) | <.0001 | 412 (35.2%) | 213 (32.1%) | 80 (17.9%) | <.0001 |
| Current smoking (n = 5198) | 996 (32.5%) | 851 (39.9%) | <.0001 | 451 (41.2%) | 221 (35.6%) | 179 (43.0%) | .0263 |
| Glucose > 160 mg/dL (n = 4856) | 548 (19.4%) | 475 (23.4%) | .0007 | 294 (26.8%) | 136 (23.4%) | 45 (12.7%) | <.0001 |
| Hemoglobin < 13 mg/dL (n = 5217) | 656 (21.4%) | 668 (31.1%) | <.0001 | 401 (35.5%) | 174 (28.3%) | 93 (23.0%) | <.0001 |
| Previous CVD | |||||||
| Prior CVD (n = 5547) | 1372 (42.1%) | 1288 (56.3%) | <.0001 | 695 (58.8%) | 399 (60.4%) | 194 (43.4%) | <.0001 |
| Prior MI (n = 5510) | 730 (22.5%) | 728 (32.1%) | <.0001 | 428 (36.5%) | 213 (32.6%) | 87 (19.6%) | <.0001 |
| Prior PCI (n = 5511) | 710 (21.9%) | 452 (19.9%) | .081 | 195 (16.7%) | 165 (25.2%) | 92 (20.7%) | <.0001 |
| Prior CABG (n = 5544) | 267 (8.2%) | 264 (11.5%) | <.0001 | 130 (11.0%) | 120 (18.2%) | 14 (3.1%) | <.0001 |
| Heart failure (n = 5514) | 158 (4.9%) | 259 (11.4%) | <.0001 | 188 (16.1%) | 46 (7.0%) | 2 (5.6%) | <.0001 |
| Arial fibrillation (n = 5531) | 158 (4.9%) | 210 (9.2%) | <.0001 | 117 (10.0%) | 54 (8.2%) | 39 (8.8%) | .4139 |
| TIA/stroke (n = 5535) | 197 (6.1%) | 168 (7.4%) | .0548 | 98 (8.3%) | 48 (7.3%) | 22 (4.9%) | .0634 |
| PVD (n = 5474) | 212 (6.6%) | 171 (7.6%) | .1396 | 92 (8.0%) | 62 (9.5%) | 17 (3.8%) | .0018 |
| Chronic kidney disease (n = 5591) | 151 (4.6%) | 162 (7.0%) | .0003 | 110 (9.3%) | 42 (6.3%) | 10 (2.2%) | <.0001 |
| Serum creatinine > 1.2 mg/dL (n = 5291) | 680 (21.9%) | 636 (29.0%) | <.0001 | 361 (31.7%) | 189 (29.9%) | 86 (20.6%) | <.0001 |
| Chronic CV medication | |||||||
| Antiplatelets (n = 5591) | 1425 (43.4%) | 1179 (51.1%) | <.0001 | 606 (51.1%) | 387 (57.8%) | 186 (41.2%) | <.0001 |
| Aspirin (n = 5590) | 1347 (41.0%) | 1108 (48.1%) | <.0001 | 571 (48.2%) | 365 (54.6%) | 172 (38.1%) | <.0001 |
| Clopidogrel (n = 5585) | 435 (13.3%) | 397 (17.2%) | <.0001 | 211 (17.8%) | 112 (16.8%) | 74 (16.4%) | .7445 |
| Anticoagulants (n = 5591) | 122 (3.7%) | 145 (6.3%) | <.0001 | 84 (7.1%) | 34 (5.1%) | 27 (6.0%) | .2241 |
| ACE inhibitors/ARBs (n = 5577) | 1358 (41.5%) | 1148 (49.9%) | <.0001 | 645 (54.5%) | 316 (47.4%) | 187 (41.6%) | <.0001 |
| Beta-blockers (n = 5582) | 1208 (36.9%) | 995 (43.2%) | <.0001 | 533 (45.0%) | 303 (45.3%) | 159 (35.3%) | .0008 |
| Statins (n = 5573) | 1272 (38.8%) | 948 (41.3%) | .0634 | 473 (40.2%) | 301 (45.0%) | 174 (38.8%) | .0606 |
ACE, angiotensin-converting enzyme; ARB, angiotensin receptor blocker; CABG, coronary artery bypass graft; CAD, coronary artery disease; CAG, coronary angiography; CR, coronary revascularization; CVD, cardiovascular disease; MI, myocardial infarction; MM, medical management; NSTEMI, non—ST-segment elevation myocardial infarction; PCI, percutaneous coronary intervention; PVD, peripheral vascular disease; TIA, transient ischemic attack.
The most important independent predictor of undergoing CAG during the index hospitalization () was the presence of a catheterization laboratory in the hospital (odds ratio [OR], 46.8; 95% confidence interval [95%CI], 22.4-97.6). Non—ST-elevation acute myocardial infarction (OR = 1.72; 95%CI, 1.24-2.38) was associated with a higher probability of undergoing CAG compared with unstable angina as well as prior myocardial infarction (OR = 1.58; 95%CI, 1.07-2.32), while age > 75 years (OR = 0.38; 95%CI, 0.28-0.53), current smoking (OR = 0.67; 95%CI, 0.51-0.88), hemoglobin levels < 13g/dL (OR = 0.65; 95%CI, 0.48-0.78), prior myocardial infarction (OR = 0.56; 95%CI, 0.39-0.67), prior coronary artery bypass graft surgery (OR = 0.60; 95%CI, 0.38-0.94), prior heart failure (OR = 0.30; 95%CI, 0.19-0.49), and being on angiotensin-converting enzyme inhibitors at admission (OR = 0.70; 95%CI, 0.53-0.92) were associated with lower probabilities. Patients from Latin America (OR = 0.04; 95%CI, 0.02-0.11) and Eastern Europe (OR = 0.15; 95%CI, 0.06-0.35) had a lower probability of undergoing CAG than patients from Northern Europe.
Independent predictors of not undergoing CR () among patients who underwent CAG and had significant CAD were prior cardiovascular disease (OR = 0.53; 95%CI, 0.42-0.67), prior coronary artery bypass graft (OR = 0.45; 95%CI, 0.32-0.63), age > 75 years (OR = 0.73; 95%CI, 0.55-0.98), and serum creatinine > 1.2mg/dL (OR = 0.76; 95%CI, 0.58-0.99) were marginally associated with lower probabilities while male patients had a higher probability (OR = 1.34; 95%CI, 1.04-1.72). Patients from Latin America (OR = 0.29; 95%CI, 0.18-0.48) and Eastern Europe (OR = 0.50; 95%CI, 0.33-0.87) had a lower probability of undergoing revascularization after CAG than patients from Northern Europe. Admission to private hospitals was associated with an increased probability of being revascularized during hospitalization (OR = 2.19; 95%CI, 1.14-4.20).
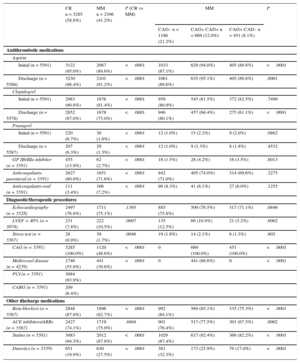
In-hospital Diagnostic and Therapeutic Procedures, and Medical Treatments by Management StrategyIn general, MM patients less frequently received diagnostic and therapeutic procedures during hospitalization than did CR patients (Table 2). Although all antithrombotic drugs and most cardiovascular preventative treatments were prescribed in most patients, MM patients were less likely to receive them in hospital. Among those who underwent CAG, multivessel disease was significantly more frequent in CR than in MM patients as a whole but not in the subgroup of MM patients with significant CAD. Interestingly, the results of CAG triggered small changes in antiplatelet drugs both in CR and MM patients, with the exception of clopidogrel, which was withdrawn in a substantial proportion of MM patients at discharge (Table 2).
Hospital Procedures and Hospital and Discharge Treatments by Management Strategy
| CR n = 3285 (58.8%) | MM n = 2306 (41.2%) | P (CR vs MM) | MM | P | |||
|---|---|---|---|---|---|---|---|
| CAG– n = 1186 (21.2%) | CAG+ CAD+ n = 669 (12.0%) | CAG+ CAD– n = 451 (8.1%) | |||||
| Antithrombotic medications | |||||||
| Aspirin | |||||||
| Initial (n = 5591) | 3122 (95.0%) | 2067 (89.6%) | <.0001 | 1033 (87.1%) | 629 (94.0%) | 405 (89.8%) | <.0001 |
| Discharge (n = 5586) | 3230 (98.4%) | 2101 (91.2%) | <.0001 | 1061 (89.6%) | 635 (95.1%) | 405 (89.8%) | .0001 |
| Clopidogrel | |||||||
| Initial (n = 5591) | 2983 (90.8%) | 1876 (81.4%) | <.0001 | 959 (80.9%) | 545 (81.5%) | 372 (82.5%) | .7499 |
| Discharge (n = 5578) | 2852 (87.0%) | 1678 (73.0%) | <.0001 | 946 (80.1%) | 457 (68.4%) | 275 (61.1%) | <.0001 |
| Prasugrel | |||||||
| Initial (n = 5591) | 220 (6.7%) | 36 (1.6%) | <.0001 | 12 (1.0%) | 15 (2.2%) | 9 (2.0%) | .0862 |
| Discharge (n = 5587) | 207 (6.3%) | 29 (1.3%) | <.0001 | 12 (1.0%) | 9 (1.3%) | 8 (1.8%) | .4532 |
| GP IIb/IIIa inhibitor (n = 5591) | 455 (13.9%) | 62 (2.7%) | <.0001 | 18 (1.5%) | 28 (4.2%) | 16 (3.5%) | .0013 |
| Anticoagulants-parenteral (n = 5591) | 2627 (80.0%) | 1651 (71.6%) | <.0001 | 842 (71.0%) | 495 (74.0%) | 314 (69.6%) | .2275 |
| Anticoagulants-oral (n = 5591) | 111 (3.4%) | 166 (7.2%) | <.0001 | 98 (8.3%) | 41 (6.1%) | 27 (6.0%) | .1255 |
| Diagnostic/therapeutic procedures | |||||||
| Echocardiography (n = 5528) | 2497 (76.8%) | 1711 (75.1%) | .1395 | 885 (75.8%) | 509 (76.5%) | 317 (71.1%) | .0846 |
| LVEF < 40% (n = 5074) | 231 (7.8%) | 222 (10.5%) | .0007 | 135 (12.5%) | 66 (10.4%) | 21 (5.2%) | .0002 |
| Stress test (n = 5567) | 28 (0.9%) | 39 (1.7%) | .0046 | 19 (1.6%) | 14 (2.1%) | 6 (1.3%) | .602 |
| CAG (n = 5591) | 3285 (100.0%) | 1120 (48.6%) | <.0001 | 0 | 669 (100.0%) | 451 (100.0%) | <.0001 |
| Multivessel disease (n = 4239) | 1746 (55.9%) | 441 (39.6%) | <.0001 | 0 | 441 (66.6%) | 0 | <.0001 |
| PCI (n = 5591) | 3084 (93.9%) | ||||||
| CABG (n = 5591) | 209 (6.4%) | ||||||
| Other discharge medications | |||||||
| Beta-blockers (n = 5567) | 2848 (87.0%) | 1896 (82.7%) | <.0001 | 992 (84.1%) | 569 (85.1%) | 335 (75.3%) | <.0001 |
| ACE inhibitors/ARBs (n = 5567) | 2427 (74.1%) | 1719 (75.0%) | .4804 | 901 (76.4%) | 517 (77.5%) | 301 (67.5%) | .0002 |
| Statins (n = 5561) | 3083 (94.3%) | 2012 (87.8%) | <.0001 | 1029 (87.4%) | 617 (92.4%) | 366 (82.2%) | <.0001 |
| Diuretics (n = 5559) | 651 (19.9%) | 630 (27.5%) | <.0001 | 381 (32.3%) | 173 (25.9%) | 76 (17.0%) | <.0001 |
ACE, angiotensin-converting enzyme; ARB, angiotensin receptor blocker; CABG, coronary artery bypass graft; CAD, coronary artery disease; CAG, coronary angiography; CR, coronary revascularization; GP, glycoprotein; LVEF, left ventricular ejection fraction; MM, medical management; PCI, percutaneous coronary intervention.
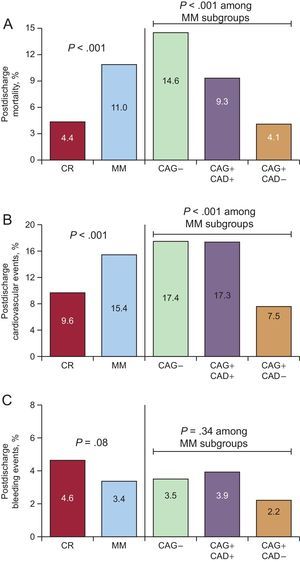
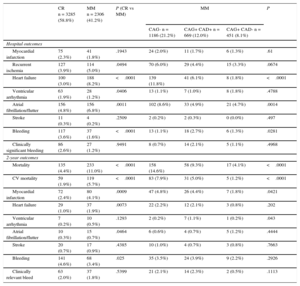
Patients who underwent MM had a higher incidence of in-hospital cardiovascular complications, mainly heart failure and atrial fibrillation, particularly among those who did not undergo CAG (Table 3). The 2-year postdischarge all-cause mortality rate was 7.0% in the whole cohort, with significant differences between CR and MM patients (4.4% vs 11%; P < .001) (Table 3, Figure 2A). A gradient in 2-year mortality was also found among MM patients, with patients who did not receive CAG showing the highest mortality (14.6%) and those without significant obstructive CAD the lowest (4.1%). Cardiovascular event rates at 2 years, including myocardial infarction, heart failure, arrhythmia, unstable angina, ischemic stroke, and transient ischemic attack, were also significantly higher in MM than in CR patients (15.4% vs 9.6%; P < .001), and were highest in those who did not receive CAG (17.4%) (Figure 2B). In contrast, bleeding events were numerically but not significantly lower in MM vs CR patients (3.4% vs 4.6%; P = .06) (Figure 2C). Among the MM subgroups, the difference in bleeding event rates was not significant but appeared lowest in those who underwent CAG and had no significant CAD. Using 70% stenosis as the cut-off point for CAD+ did not significantly change the results (data not shown). Compared with the results for the 50% cut-off point, there was a slight increase in the mortality rate in both the CAG+CAD+ and CAG+CAD– groups, as they were both composed of higher risk patients, with a small change in mortality gradient between the groups. On exclusion of the 190 patients who underwent revascularization after discharge (including 32 within the first month) from the analyses, no relevant differences were found in patterns of mortality or other event rates.
In-hospital and 2-year Outcomes in Non—ST-segment Elevation Acute Coronary Syndrome Patients by Management Strategy
| CR n = 3285 (58.8%) | MM n = 2306 (41.2%) | P (CR vs MM) | MM | P | |||
|---|---|---|---|---|---|---|---|
| CAG- n = 1186 (21.2%) | CAG+ CAD+ n = 669 (12.0%) | CAG+ CAD- n = 451 (8.1%) | |||||
| Hospital outcomes | |||||||
| Myocardial infarction | 75 (2.3%) | 41 (1.8%) | .1943 | 24 (2.0%) | 11 (1.7%) | 6 (1.3%) | .61 |
| Recurrent ischemia | 127 (3.9%) | 114 (5.0%) | .0494 | 70 (6.0%) | 29 (4.4%) | 15 (3.3%) | .0674 |
| Heart failure | 100 (3.0%) | 188 (8.2%) | <.0001 | 139 (11.8%) | 41 (6.1%) | 8 (1.8%) | <.0001 |
| Ventricular arrhythmia | 63 (1.9%) | 28 (1.2%) | .0406 | 13 (1.1%) | 7 (1.0%) | 8 (1.8%) | .4788 |
| Atrial fibrillation/flutter | 156 (4.8%) | 156 (6.8%) | .0011 | 102 (8.6%) | 33 (4.9%) | 21 (4.7%) | .0014 |
| Stroke | 11 (0.3%) | 4 (0.2%) | .2509 | 2 (0.2%) | 2 (0.3%) | 0 (0.0%) | .497 |
| Bleeding | 117 (3.6%) | 37 (1.6%) | <.0001 | 13 (1.1%) | 18 (2.7%) | 6 (1.3%) | .0281 |
| Clinically significant bleeding | 86 (2.6%) | 27 (1.2%) | .9491 | 8 (0.7%) | 14 (2.1%) | 5 (1.1%) | .4968 |
| 2-year outcomes | |||||||
| Mortality | 135 (4.4%) | 233 (11.0%) | <.0001 | 158 (14.6%) | 58 (9.3%) | 17 (4.1%) | <.0001 |
| CV mortality | 59 (1.9%) | 119 (5.7%) | <.0001 | 83 (7.9%) | 31 (5.0%) | 5 (1.2%) | <.0001 |
| Myocardial infarction | 72 (2.4%) | 80 (4.1%) | .0009 | 47 (4.8%) | 26 (4.4%) | 7 (1.8%) | .0421 |
| Heart failure | 29 (1.0%) | 37 (1.9%) | .0073 | 22 (2.2%) | 12 (2.1%) | 3 (0.8%) | .202 |
| Ventricular arrhythmia | 7 (0.2%) | 10 (0.5%) | .1293 | 2 (0.2%) | 7 (1.1%) | 1 (0.2%) | .043 |
| Atrial fibrillation/flutter | 10 (0.3%) | 15 (0.7%) | .0464 | 6 (0.6%) | 4 (0.7%) | 5 (1.2%) | .4444 |
| Stroke | 20 (0.7%) | 17 (0.9%) | .4385 | 10 (1.0%) | 4 (0.7%) | 3 (0.8%) | .7663 |
| Bleeding | 141 (4.6%) | 68 (3.4%) | .025 | 35 (3.5%) | 24 (3.9%) | 9 (2.2%) | .2926 |
| Clinically relevant bleed | 63 (2.0%) | 37 (1.8%) | .5399 | 21 (2.1%) | 14 (2.3%) | 2 (0.5%) | .1113 |
CAD, coronary artery disease; CAG, coronary angiography; CR, coronary revascularization; CV, cardiovascular; MM, medical management.

Postdischarge event rates at 2 years according to management strategy. A: All-cause mortality. B: Cardiovascular events. C: Bleeding events. Cardiovascular events included myocardial infarction, heart failure, arrhythmia, unstable angina, ischemic stroke, and transient ischemic attack. Bleeding events included all kinds of bleeds. CAD, coronary artery disease; CAG, coronary angiography; CR, coronary revascularization; MM, medical management.
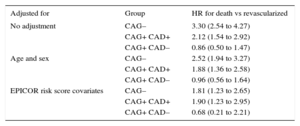
Lack of CAG was found to be an independent predictor of 2-year mortality, adjusted for age, sex, and postdischarge mortality predictors, as previously described in the EPICOR cohort18 (hazard ratio [HR] = 1.81; 95%CI, 1.23-2.65; P < .001). Among patients who underwent CAG, MM patients with significant CAD had an increased adjusted mortality risk (HR = 1.90; 95%CI, 1.23-2.95; P < .001), while those without significant CAD did not (HR = 0.68; 95%CI, 0.21-2.21; P < .001) (Table 4). Other predictors of 2-year mortality are shown in .
Hazard Ratios for 2-year All-cause Death in Subgroups of Medically Managed vs Revascularized NSTEACS Patients by Management Strategy. Model Adjusted for Hospital Type (Regional, non-University General, University General, Private) and Geographical Region, Using a Multilevel Model to Adjust for Clustering
| Adjusted for | Group | HR for death vs revascularized |
|---|---|---|
| No adjustment | CAG– | 3.30 (2.54 to 4.27) |
| CAG+ CAD+ | 2.12 (1.54 to 2.92) | |
| CAG+ CAD– | 0.86 (0.50 to 1.47) | |
| Age and sex | CAG– | 2.52 (1.94 to 3.27) |
| CAG+ CAD+ | 1.88 (1.36 to 2.58) | |
| CAG+ CAD– | 0.96 (0.56 to 1.64) | |
| EPICOR risk score covariates | CAG– | 1.81 (1.23 to 2.65) |
| CAG+ CAD+ | 1.90 (1.23 to 2.95) | |
| CAG+ CAD– | 0.68 (0.21 to 2.21) |
CAD, coronary artery disease; CAG, coronary angiography; HR, hazard ratio; NSTEACS, non—ST-segment elevated acute coronary syndrome.
The results of this large international cohort study can help us to understand the heterogeneity of patients with NSTEACS, the main clinical pathways leading to MM, and its influence on prognosis. Our observations also allow us to estimate postdischarge event rates in relation to these pathways in a large cohort of unselected patients surviving NSTEACS. This information can be particularly helpful for risk stratification, clinical follow-up planning, and designing future studies in this field.
Patients surviving acute coronary syndrome are at high risk of subsequent cardiovascular events, even if optimally treated.19 Despite recommendations by the main European guidelines,1,2 less than 60% of patients undergo CR during hospitalization for NSTEACS. This is clinically relevant given the abundance of data from randomized trials13,20,21 and observational studies,22 suggesting an improvement in mid- and long-term prognosis for patients with NSTEACS managed invasively. In our study, the most frequent clinical situation associated with MM is lack of CAG during hospitalization, which accounts for roughly half of MM cases. Our study is consistent with previous studies using similar analytical methods insofar as older and sicker patients are more often selected for MM while younger and lower risk patients consistently receive more aggressive treatment. This is also true among subgroups of MM patients, as those not undergoing CAG show the highest risk profile. Similar findings were reported in an analysis of the FAST-MI registry, in which MM patients with non—ST-segment elevation myocardial infarction who did not undergo CAG had a higher 5-year mortality rate than those who did, even compared with CAG+ patients with multivessel disease.23 Moreover, our findings are consistent with the risk paradox found in several national and international registries,23–27 with a gradient in age, cardiovascular burden, and comorbidities between revascularized patients, patients undergoing CAG but not CR and, finally, those not receiving CAG. Although selection bias may partially explain the higher risk observed in MM patients, CR remains independently associated with lower 2-year mortality risk in our population after adjustment for all factors associated with postdischarge mortality in a previously developed predictive model.18
While CAG per se is unlikely to provide any benefit, it has been suggested that patient selection (ie, whether or not to perform angiography) plays a crucial role.28 In the EPICOR study, NSTEACS patients who did not undergo CAG were more likely to be older, with unstable angina rather than non—ST-segment elevation myocardial infarction, and to have hypertension or diabetes. In the TRILOGY ACS trial, the most frequent reasons for not undergoing CAG were patient refusal, lack of on-site facilities, and either unsuitable coronary anatomy or other contraindications.10 Noncatheterized patients were also more likely to be older, female, and to have a diagnosis of unstable angina rather than non—ST-segment elevation myocardial infarction, and less previous coronary intervention. In a retrospective analysis of the TRILOGY ACS trial, NSTEACS patients who did not undergo angiography also had significantly poorer outcomes compared with those who did: at 30 months, cardiovascular death rates were 8.2% and 4.7%, respectively, with all-cause death rates of 9.6% and 5.8%.7 In EPICOR, as in other studies,29 lack of immediate access to coronary intervention facilities was one of the most important reasons for initial conservative management. This is true even though transfers between hospitals and the reasons for transfer were recorded in EPICOR.30
The regional differences in the probability of undergoing CAG and CR are worthy of mention. These are probably largely explained by differences in resources, insurance level and care access opportunities, procedural cost for patients, and reimbursement.
LimitationsThis study is based on registry data and is therefore subject to the limitations of observational studies, ie, potential bias and confounding. The role of patient preferences in the decision to undergo CAG and CR was not recorded, which may have had an additional influence on the outcomes that could not be measured. The analysis of hospital procedures alone excluded patients in which scheduled CAG or CR might have been performed. However, when we used wider time frames for CR–10 days (as in TRILOGY ACS) and 30 days–there were no significant changes in our results, confirming the consistency of our findings. As mentioned previously, although our multivariable analysis included a rigorous adjustment using a previously developed model for mortality prediction,18 unmeasured confounders, such as known CAD not amenable for CR, dementia, too sick for other medical reasons, or patient preferences, could have affected the apparent protective role of CAG and CR. In addition, clinical events during follow-up were not centrally adjudicated. Finally, although we attempted to show representative examples of real-life practice in each country, by careful selection of local centers, caution is warranted in generalizing the results.
CONCLUSIONSMedically managed patients with NSTEACS constitute a heterogeneous group according to the clinical pathways leading to nonuse of CAG or CR. Compared with CR patients, those who do not undergo CAG during hospitalization are older and present with greater comorbidity. They also have the highest adjusted mortality risk after discharge, followed by those not revascularized despite significant CAD. Therefore, the clinical pathways leading to MM are clinically relevant and should be taken into consideration in studies addressing this patient group, given the observed differences in baseline characteristics and clinical outcomes. Continuing efforts are needed to improve adherence to guideline recommendations, particularly for NSTEACS patients admitted to hospitals without a catheterization laboratory.
FUNDINGThe EPICOR study was funded by AstraZeneca. CNIC is supported by the Spanish Ministry of Economy and Competitiveness (MINECO) and the Pro-CNIC Foundation, and is a Severo Ochoa Center of Excellence (MINECO award SEV-2015-0505).
CONFLICTS OF INTERESTH. Bueno has received research funding from the Instituto de Salud Carlos III (PIE16/00021), Astra-Zeneca, BMS, Janssen and Novartis; consulting fees from Abbott, Astra-Zeneca, Bayer, BMS-Pfizer, Novartis; and speaking fees or support for attending scientific meetings from Astra-Zeneca, Bayer, BMS-Pfizer, Ferrer, Novartis, Servier and MEDSCAPE-the heart.org. S. Pocock has received research funding from AstraZeneca. J. Medina is an employee of AstraZeneca. N. Danchin has received research grants from Amgen, AstraZeneca, Bayer, Daiichi-Sankyo, Eli-Lilly, MSD and Sanofi, and consulting or speaking fees from Amgen, AstraZeneca, Bayer, BMS, Boehringer-Ingelheim, GSK, MSD-Schering Plough, Novartis, Pierre Fabre, Pfizer, Roche, Sanofi-Aventis, Servier and The Medicines Company. L. Annemans has received consulting and lecture fees from AstraZeneca. M. Licour is an employee of AstraZeneca. J. Gregson has received research funding from AstraZeneca. A.M. Vega is an employee of AstraZeneca. F. van de Werf has received consulting fees and research grants from Boehringer-Ingelheim and Merck, and consulting fees from Roche, Sanofi-Aventis, AstraZeneca and The Medicines Company.
- –
Despite guideline recommendations for an invasive strategy in most patients with NSTEACS, a large proportion of these patients are initially selected for MM.
- –
Different clinical pathways lead to the selection of MM in NSTEACS patients.
- –
NSTEACS patients who do not undergo CAG, and hence do not undergo CR, are at highest risk of cardiovascular morbidity and mortality in the long-term.
- –
MM is independently associated with a higher 2-year adjusted mortality risk compared with revascularization.
- –
The different clinical pathways leading to the selection of MM in NSTEACS patients have an important influence on patient outcomes.
- –
Therefore, the reasons for MM should be taken into consideration in future studies addressing this patient population.
.
Liz Anfield (Prime Medica Ltd, Knutsford, Cheshire, United Kingdom) provided medical writing support during manuscript development, funded by AstraZeneca. Responsibility for opinions, conclusions and interpretation of the data lies with the authors. Employees of AstraZeneca were permitted to read the first and final drafts of the manuscript and make suggestions on scientific and technical accuracy only. It was the authors’ decision whether to accept or reject any suggestions made by AstraZeneca. Responsibility for opinions, conclusions, and interpretation of the data lies with the authors.