

Intensive systolic blood pressure (SBP) control improved outcomes in the Strategy of Blood Pressure Intervention in the Elderly Hypertensive Patients (STEP) trial. Whether the serum uric acid concentration at baseline alters the benefits of intensive SBP control is unknown.
MethodsThe STEP trial was a randomized controlled trial that compared the effects of intensive (SBP target of 110 to<130mmHg) and standard (SBP target of 130 to <150mmHg) SBP control in Chinese patients aged 60 to 80 years with hypertension. The primary outcome was a composite of cardiovascular disease events. This post hoc analysis was performed to examine whether the effects of intensive SBP intervention differed by the baseline uric acid concentration using 2 models: restricted cubic spline curves and subgroup analyses, both based on the Fine-Gray subdistribution hazard model in the analysis of the primary outcome and secondary outcomes (excluding all-cause death). In the analysis of all-cause death, the Cox regression model was used. We also examined the change in the follow-up uric acid concentrations.
ResultsOverall, the risk of the primary outcome rose as the cumulative uric acid concentration increased in both the intensive and standard treatment groups. Patients with intensive treatment had a lower multivariable-adjusted subdistribution hazard ratio for the primary outcome, but with a wide overlap of 95%CI. Next, we stratified patients according to their baseline uric acid concentration (tertile 1 [T1], <303.0μmol/L; tertile 2 [T2], 303.0 to <375.8μmol/L; and tertile 3 [T3], ≥375.8μmol/L). Subgroup analyses using tertiles provided HRs and 95%CI in T1 (HR, 0.55; 95%CI, 0.36–0.86; P=.008), T2 (HR, 0.80; 95%CI, 0.56–1.14; P=.22) and T3 (HR, 0.86; 95%CI, 0.60–1.21; P=.39), with an interaction P value of .29. The results for most of the secondary outcomes followed the same trends.
ConclusionsThere was no evidence that the benefit of the intensive SBP control differed by baseline uric acid concentrations. This trial was registered at ClinicalTrial.gov (Identifier: NCT03015311).
Keywords
Hypertension is the foremost contributor to disability and premature mortality worldwide.1 Cannon et al.2 reported that 25% of patients with untreated hypertension had hyperuricemia, defined as a uric acid concentration of> 7.0mg/dL in men and ≥ 6.0mg/dL in women,3 and that the rate of hyperuricemia was extremely high in patients who were taking diuretics (50%) and those with malignant hypertension (> 75%). An elevated uric acid concentration has emerged as a potentially modifiable cardiovascular risk factor in patients with hypertension,4 with a 3- to 5-fold increased risk of cardiovascular events compared with patients who have hypertension with normal serum uric acid concentrations.5
Among elderly patients, asymptomatic hyperuricemia has been reported to be a strong risk factor for refractory hypertension.6 More importantly, among hospitalized elderly patients with hypertension, the presence of hyperuricemia is associated with the need for more antihypertensive drugs for blood pressure control, more diuretic use, and less blood pressure reduction in response to medical treatment.7 These findings suggest that an elevated serum uric acid concentration blunts the blood pressure response to antihypertensive therapy.
Recently, several large-scale clinical trials have supported the positive effects of intensive blood pressure control. For example, in the Strategy of Blood Pressure Intervention in the Elderly Hypertensive Patients (STEP) trial, intensive blood pressure control improved outcomes in elderly patients aged 60 to 80 years.8
Given the complex interactions between blood pressure and serum uric acid, the present study was performed to expand on previously reported findings by providing a more detailed analysis of primary and secondary outcomes according to baseline uric acid concentrations.
METHODSStudy population and interventionThe present study involved a post hoc analysis of the STEP trial. The methods and results for the primary outcome have been published elsewhere.8,9 In brief, the STEP trial was a prospective, multicenter, randomized controlled trial performed at 42 clinical centers throughout China. The main inclusion criteria were as follows: a) age of 60 to 80 years, b) a history of hypertension and treatment with antihypertensive medication or systolic blood pressure (SBP) of 140 to 190mmHg in 3 screening visits, and c) a record of the patient's baseline uric acid concentration. The main exclusion criterion was a history of ischemic or hemorrhagic stroke. The detailed inclusion and exclusion criteria were previously described in the study protocol.9 The patients were randomly assigned in a 1:1 ratio to receive 1 of 2 therapies: intensive treatment (target SBP of <130mmHg) or standard treatment (target SBP of <150mmHg).8
This study was a post hoc analysis of the STEP trial, which was approved by the ethics committees of Fu Wai Hospital and all collaborating centers, and all the enrolled patients provided written informed consent. Therefore, no further approval was required in the present study. Clinical trial registration number: NCT03015311.
Blood pressure and uric acid measurementsThe office blood pressure measurements were performed by trained personnel (physicians or nurses) using an office blood pressure monitor (OMRON Healthcare, United States). Before measurement, the participants rested quietly in a seated position for at least 5minutes, and their blood pressure was then measured 3 times at 1-minute intervals by trial staff (observed). Both the office blood pressure and laboratory data (including the uric acid concentration, tested in Beijing CIC Clinical Laboratory) were obtained in a standard manner during all baseline and follow-up clinic visits. Details regarding quality control have been provided in previous studies.9
Trial outcomesAs previously described in the study protocol,8,9 the primary outcome was a composite endpoint including death from cardiovascular causes, stroke, acute decompensated heart failure, coronary revascularization, acute coronary syndrome, and atrial fibrillation. The secondary outcomes were the components of the primary outcome and all-cause death.
Statistical analysisIn the restricted cubic spline analyses, primary outcome, and secondary outcomes (excluding all-cause death) were analyzed based on the Fine-Gray subdistribution hazard model. In the analysis of all-cause death, the Cox regression model was used. For death from all causes, we used cox.zph() to test the proportional hazards assumption for a Cox regression model. For other endpoints, we used the Fine-Gray subdistribution hazard model to build a dataset, then tested the proportional hazards assumption use cox.zph(). The associations between the uric acid concentration and all endpoints were evaluated on a continuous scale with restricted cubic spline curves. This is a multivariate analysis, including adjusted prognostically relevant variables (age, sex, body mass index, diastolic blood pressure, alanine aminotransferase, aspartate aminotransferase, urea, creatinine, triglycerides, high-density lipoprotein cholesterol, history of diabetes mellitus, estimated glomerular filtration rate).10
We included all participants with an available baseline uric acid concentration and stratified the them according to these concentrations (tertile 1 [T1], <303.0μmol/L; tertile 2 [T2], 303.0 to <375.8μmol/L; and tertile 3 [T3], ≥ 375.8μmol/L). For continuous variables, the mean±standard deviation (SD) were calculated; for categorical variables, the proportion was calculated in each category substratified by the uric acid concentration. The baseline characteristics for each stratum are depicted appropriately and were compared using the most suitable tests (such as analysis of variance, the chi-square test, and the Kruskal–Wallis test).
In the analyses of the primary outcome and secondary outcomes (excluding all-cause death), cumulative incidence was calculated for the 2 trial groups according to different strata using the Fine-Gray subdistribution hazard model and the results are presented as subdistribution hazard ratios.11 In the analysis of all-cause death, the Cox regression model was used and the results are presented as hazard ratios (HR). The intention-to-treat approach was used in the present analysis. Although multiple events were recorded in this study and a single patient could develop more than 1 event, only the first event of any type per patient was used in the analysis. Model 1 was adjusted for potential confounders, which were significantly different between the intensive treatment group and the standard treatment group. P values for interaction in the subgroup analysis, and subdistribution hazard ratios or HR with 95% confidence intervals (95%CI) were used to compare the intensive and standard SBP control within each tertile.
To test the trend of uric acid concentrations during the follow-up years, the mixed effect regression model was used by the function lme() of package nlme. In the fixed effect, the dependent variable was follow-up uric acid concentration. The interaction between follow-up years and treatment group provided the real differences between treatment groups. The autocorrelation among repeated measurements was accounted for in the random effect. The results of this analysis were translated into least square means (LS means). As a sensitivity analysis, the interactions between treatment with uric acid as continuous of endpoints were analyzed using Cox regression for all-cause mortality, and Fine & Gray regression for other primary and secondary outcomes. All analyses were performed with R software, version 3.6.3 (R Foundation for Statistical Computing, Austria). A 2-sided P value of <.05 was considered statistically significant.
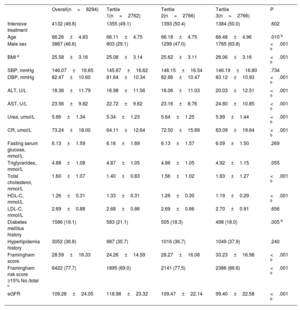
RESULTSBaseline characteristics in 3 stratifications of uric acid concentrationTable 1 summarizes the characteristics of the overall study population and each uric acid tertile. Patients were stratified into 3 tertiles (< 303.0μmol/L, 303.0 to <375.8μmol/L, and ≥ 375.8μmol/L) according to their baseline uric acid concentration. Overall, the mean±SD age of the sample at baseline was 66.26±4.83 years, the mean uric acid concentration at baseline was 347.26±89.15μmol/L, and nearly half (46.6%) of the patients were male. The mean body mass index was 25.58±3.16kg/m2, and the mean SBP was 146.07±16.65mmHg. Baseline characteristics were well balanced between the intensive and standard treatment groups in each tertile (table 2), which is consistent with the findings of our main study.8 This indicates that the inclusion of patients in the present study was representative.
Baseline demographics for the STEP participants and for those in the 3 uric acid stratifications
| Overall(n=8294) | Tertile 1(n=2762) | Tertile 2(n=2766) | Tertile 3(n=2766) | P | |
|---|---|---|---|---|---|
| Intensive treatment | 4132 (49.8) | 1355 (49.1) | 1393 (50.4) | 1384 (50.0) | .602 |
| Age | 66.26±4.83 | 66.11±4.75 | 66.18±4.75 | 66.48±4.96 | .010 b |
| Male sex | 3867 (46.6) | 803 (29.1) | 1299 (47.0) | 1765 (63.8) | <.001 b |
| BMI a | 25.58±3.16 | 25.08±3.14 | 25.62±3.11 | 26.06±3.16 | <.001 b |
| SBP, mmHg | 146.07±16.65 | 145.87±16.62 | 146.15±16.54 | 146.19±16.80 | .734 |
| DBP, mmHg | 82.47±10.60 | 81.64±10.34 | 82.66±10.47 | 83.12±10.93 | <.001 b |
| ALT, U/L | 18.36±11.79 | 16.98±11.56 | 18.06±11.03 | 20.03±12.51 | <.001 b |
| AST, U/L | 23.56±9.82 | 22.72±9.62 | 23.16±8.76 | 24.80±10.85 | <.001 b |
| Urea, umol/L | 5.66±1.34 | 5.34±1.23 | 5.64±1.25 | 5.99±1.44 | <.001 b |
| CR, umol/L | 73.24±18.00 | 64.11±12.64 | 72.50±15.69 | 83.09±19.64 | <.001 b |
| Fasting serum glucose, mmol/L | 6.13±1.59 | 6.16±1.69 | 6.13±1.57 | 6.09±1.50 | .269 |
| Triglycerides, mmol/L | 4.88±1.08 | 4.87±1.05 | 4.86±1.05 | 4.92±1.15 | .055 |
| Total cholesterol, mmol/L | 1.60±1.07 | 1.40±0.83 | 1.56±1.02 | 1.83±1.27 | <.001 b |
| HDL-C, mmol/L | 1.26±0.31 | 1.33±0.31 | 1.26±0.30 | 1.19±0.29 | <.001 b |
| LDL-C, mmol/L | 2.69±0.88 | 2.68±0.86 | 2.69±0.86 | 2.70±0.91 | .656 |
| Diabetes mellitus history | 1586 (19.1) | 583 (21.1) | 505 (18.3) | 498 (18.0) | .005 b |
| Hyperlipidemia history | 3052 (36.8) | 987 (35.7) | 1016 (36.7) | 1049 (37.9) | .240 |
| Framingham score | 28.59±16.33 | 24.26±14.59 | 28.27±16.08 | 33.23±16.98 | <.001 b |
| Framingham risk score ≥15% No./total c | 6422 (77.7) | 1895 (69.0) | 2141 (77.5) | 2386 (86.6) | <.001 b |
| eGFR | 109.28±24.05 | 118.98±23.32 | 109.47±22.14 | 99.40±22.58 | <.001 b |
ALT, alanine aminotransferase; AST, aspartate aminotransferase; BMI, body mass index; CR, creatinine; DBP, diastolic blood pressure; eGFR, estimated glomerular filtration rate; HDL-C, high-density lipoprotein cholesterol; LDL-C, low-density lipoprotein cholesterol; SBP, systolic blood pressure.
Values are expressed as No. (%) or mean±standard deviation. Percentages may not add up to 100 because of rounding.
To convert the values for fasting serum glucose to milligrams per deciliter, divide by 0.05551. To convert the values for cholesterol to milligrams per deciliter, divide by 0.02586. To convert the values for triglycerides to milligrams per deciliter, divide by 0.01129.
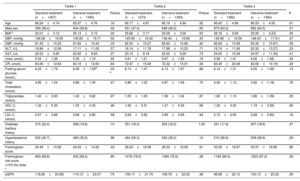
Baseline demographics for patients in the standard treatment group and the intensive treatment group based on 3 uric acid stratifications
| Tertile 1 | Tertile 2 | Tertile 3 | |||||||
|---|---|---|---|---|---|---|---|---|---|
| Standard treatment (n=1407) | Intensive treatment (n=1355) | Pvalue | Standard treatment (n=1373) | Intensive treatment (n=1393) | Pvalue | Standard treatment (n=1382) | Intensive treatment (n=1384) | P | |
| Age | 66.24±4.74 | 65.97±4.76 | .16 | 66.17±4.67 | 66.19±4.84 | .92 | 66.43±4.99 | 66.53±4.93 | .61 |
| Male sex | 399 (28.4) | 404 (29.8) | .42 | 651 (47.4) | 648 (46.5) | .66 | 873 (63.2) | 892 (64.5) | .51 |
| BMI a | 25.01±3.12 | 25.14±3.15 | .30 | 25.66±3.17 | 25.58±3.06 | .50 | 26.18±3.09 | 25.95±3.23) | .06 |
| SBP, mmHg | 146.08±16.55 | 145.65±16.71 | .50 | 145.90±16.42 | 146.40±16.66 | .43 | 145.96±16.59 | 146.43±17.01) | .47 |
| DBP, mmHg | 81.45±10.25 | 81.83±10.43 | .33 | 82.50±10.27 | 82.82±10.66 | .42 | 82.94±10.99 | 83.30±10.87) | .39 |
| ALT, U/L | 16.86±12.06 | 17.11±11.02 | .57 | 18.14±11.78 | 17.98±10.25 | .71 | 19.74±11.69 | 20.32±13.27) | .23 |
| AST, U/L | 22.52±9.60 | 22.92±9.63 | .27 | 23.10±8.18 | 23.22±9.29 | .73 | 24.63±10.38 | 24.97±11.30) | .41 |
| Urea, umol/L | 5.34±1.26 | 5.35±1.19 | .92 | 5.61±1.21 | 5.67±1.29 | .19 | 5.96±1.41 | 6.02±1.48) | .34 |
| CR, umol/L | 64.06±12.64 | 64.16±12.63 | .84 | 72.67±15.46 | 72.32±15.91 | .56 | 83.49±20.08 | 82.69±19.19) | .29 |
| Fasting serum glucose, mmol/L | 6.23±1.79 | 6.09±1.59d | .03 b | 6.13±1.47 | 6.13±1.67 | .88 | 6.14±1.51 | 6.05±1.49) | .13 |
| Total cholesterol, mmol/L | 4.85±1.04 | 4.88±1.05 | .47 | 4.86±1.02 | 4.87±1.09 | .75 | 4.93±1.12 | 4.92±1.18) | .76 |
| Triglycerides, mmol/L | 1.40±0.83 | 1.40±0.82 | .97 | 1.55±1.00 | 1.56±1.04 | .87 | 1.80±1.15 | 1.86±1.39) | .25 |
| HDL-C, mmol/L | 1.32±0.30 | 1.33±0.32 | .46 | 1.26±0.31 | 1.27±0.30 | .66 | 1.20±0.30 | 1.19±0.29) | .90 |
| LDL-C, mmol/L | 2.67±0.86 | 2.69±0.85 | .58 | 2.69±0.82 | 2.69±0.89 | .94 | 2.72±0.93 | 2.68±0.90) | .18 |
| Diabetes mellitus history | 315 (22.4) | 268 (19.8) | .10 | 251 (18.3) | 254 (18.2) | 1.00 | 241 (17.4) | 257 (18.6) | .47 |
| Hyperlipidemia history | 502 (35.7) | 485 (35.8) | .98 | 484 (35.3) | 532 (38.2) | .12 | 510 (36.9) | 539 (38.9) | .29 |
| Framingham score | 24.48±14.90 | 24.03±14.25 | .42 | 28.24±16.08 | 28.30±16.09 | .91 | 33.09±16.97 | 33.37±16.99 | .66 |
| Framingham risk score ≥15% No./total c | 963 (68.8) | 932 (69.2) | .85 | 1076 (78.5) | 1065 (76.6) | .26 | 1183 (86.0) | 1203 (87.2) | .38 |
| eGFR | 118.85±23.56) | 119.13±23.07 | .75 | 109.17±21.74 | 109.76±22.52 | .48 | 98.68±22.10 | 100.13±23.02 | .09 |
ALT, alanine aminotransferase; AST, aspartate aminotransferase; BMI, body mass index; CR, creatinine; DBP, diastolic blood pressure; eGFR, estimated glomerular filtration rate; HDL-C, high-density lipoprotein cholesterol; LDL-C, low-density lipoprotein cholesterol; SBP, systolic blood pressure.
The values are expressed as No. (%) or mean±standard deviation. Percentages may not add up to 100 because of rounding. To convert the values for fasting serum glucose to milligrams per deciliter, divide by 0.05551. To convert the values for cholesterol to milligrams per deciliter, divide by 0.02586. To convert the values for triglycerides to milligrams per deciliter, divide by 0.01129.
Some examined characteristics differed by uric acid tertile; for example, patients in T1 were younger, were more likely to be female, were more likely to have a history of diabetes mellitus, had a lower body mass index, baseline diastolic blood pressure, alanine aminotransferase concentration, aspartate aminotransferase concentration, urea concentration, creatinine concentration, triglyceride concentration, and Framingham Score, and had a higher estimated glomerular filtration rate (P <.05 for all) (table 1).
Further comparisons between the intensive and standard treatment groups were examined within each tertile. Except for fasting serum glucose concentration, all baseline characteristics were well balanced between the 2 trial groups by uric acid tertile (table 2).
Blood pressureThe overall trends in the different uric acid tertiles agreed well with the overall trends of each treatment group separately (). Additionally, the 2 treatment strategies in different uric acid tertiles led to a similarly rapid and sustained between-group difference in SBP (), which is similar to the findings of our previously published study.8
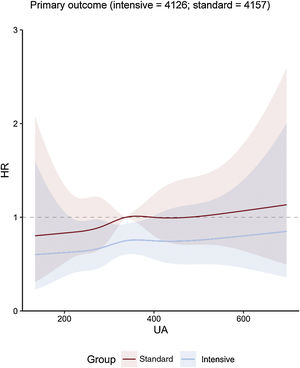
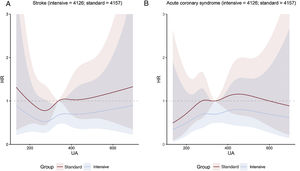
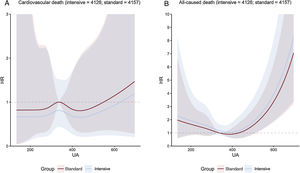
Uric acid concentration and clinical outcomesOverall, the risk of the primary outcome rose as the cumulative uric acid concentration increased. This association was found in both the intensive treatment group and the standard treatment group (figure 1). The line representing multivariable-adjusted subdistribution HR for the primary outcome of patients receiving intensive treatment continued under the counterpart of patients receiving standard treatment (figure 1). However, the figures showed a wide overlap of the confidence intervals. The multivariable-adjusted subdistribution HR for the secondary outcomes except all-cause death showed similar trend (figure 2 and figure 3). In addition, our results showed that uric acid (as continuous and as tertiles) met the proportionality assumption for all endpoints.

Central illustration. Cubic spline regression curves relating baseline uric acid concentrations as a continuous variable to the primary outcome. The figure shows HR with shadow 95% confidence intervals relating baseline uric acid concentrations to primary outcome under the Fine-Gray subdistribution hazard model in each SBP treatment arm, with baseline uric acid concentrations as predictor variables and covariable adjustment for age, sex, body mass index, DBP, ALT, AST, urea, creatinine, triglycerides, high-density lipoprotein cholesterol, history of diabetes mellitus, and estimated glomerular filtration rate. ALT, alanine aminotransferase; AST, aspartate aminotransferase; DBP, diastolic blood pressure; HR, hazard ratio; UA, uric acid.

A: cubic spline regression curves relating baseline uric acid concentrations as a continuous variable to stroke. The figure shows HR with shadow 95% confidence intervals relating baseline uric acid concentrations to the primary outcome under the Fine-Gray subdistribution hazard model in each SBP treatment arm, with baseline uric acid concentrations as predictor variables and covariable adjustment for age, sex, body mass index, DBP, ALT, AST, urea, creatinine, triglycerides, high-density lipoprotein cholesterol, history of diabetes mellitus, and estimated glomerular filtration rate. B: cubic spline regression curves relating baseline uric acid concentrations as a continuous variable to acute coronary syndrome. The figure shows HR with shadow 95% confidence intervals relating baseline uric acid concentrations to the primary outcome under the Fine-Gray subdistribution hazard model in each SBP treatment arm, with baseline uric acid concentrations as predictor variables and covariable adjustment for age, sex, body mass index, DBP, ALT, AST, urea, creatinine, triglycerides, high-density lipoprotein cholesterol, history of diabetes mellitus, and estimated glomerular filtration rate. ALT, alanine aminotransferase; AST, aspartate aminotransferase; DBP, diastolic blood pressure; HR, hazard ratio; UA, uric acid.

A: cubic spline regression curves relating baseline uric acid concentrations as a continuous variable to cardiovascular death. The figure shows HR with shadow 95% confidence intervals relating baseline uric acid concentrations to the primary outcome under the Fine-Gray subdistribution hazard model in each SBP treatment arm, with baseline uric acid concentrations as predictor variables and covariable adjustment for age, sex, body mass index, DBP, ALT, AST, urea, creatinine, triglycerides, high-density lipoprotein cholesterol, history of diabetes mellitus, and estimated glomerular filtration rate. B: cubic spline regression curves relating baseline uric acid concentrations as a continuous variable to all-caused death. The figure shows HR with shadow 95% confidence intervals relating baseline uric acid concentrations to the primary outcome under a Cox regression model in each SBP treatment arm, with baseline uric acid concentrations as predictor variables and covariable adjustment for age, sex, body mass index, DBP, ALT, AST, urea, creatinine, triglycerides, high-density lipoprotein cholesterol, history of diabetes mellitus, and estimated glomerular filtration rate. ALT, alanine aminotransferase; AST, aspartate aminotransferase; DBP, diastolic blood pressure; HR, hazard ratio; UA, uric acid.
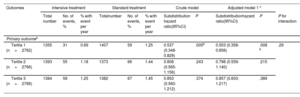
During the median follow-up period of 3.34 years, a total of 336 primary outcome events occurred in 144 of 4132 patients (3.5%; 1.0% per year) in the intensive treatment group and in 192 of 4162 patients (4.6%; 1.4% per year) in the standard treatment group, with a subdistribution HR of 0.74; 95%CI, 0.60-0.92; P=.007] (). Therefore, intensive treatment considerably reduced the incidence of primary outcome events when compared with standard treatment, with an absolute difference of 1.1 percentage points.
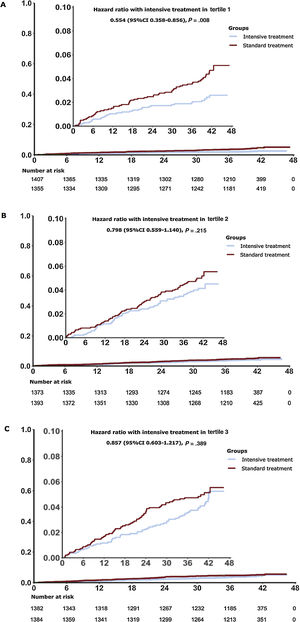
The incidence of primary outcome events was significantly lower in T1 of intensive SBP intervention when compared with standard treatment (subdistribution HR, 0.55; 95%CI, 0.36-0.86; P=.007) (table 3 and figure 4A). Additionally, no significant benefit was derived from intensive treatment in patients in T2 and T3 when compared with standard treatment (table 3 and figure 4B,C). The Interaction P value between SBP control and uric acid stratification was .29. The results for most of the secondary outcomes were similar to those for the primary outcomes in different tertiles ().
Hazard ratios for the primary outcomes by uric acid stratification
| Outcomes | Intensive treatment | Standard treatment | Crude model | Adjusted model 1 c | |||||||
|---|---|---|---|---|---|---|---|---|---|---|---|
| Total number | No. of events, % | % with event per year | Totalnumber | No. of events, % | % with event per year | Subdistribution hazard ratio(95%CI) | P | Subdistributionhazard ratio(95%CI) | P | P for interaction | |
| Primary outcomea | |||||||||||
| Tertile 1 (n=2762) | 1355 | 31 | 0.69 | 1407 | 59 | 1.25 | 0.537 (0.348-0.829) | .005b | 0.553 (0.358-0.856) | .008 b | .29 |
| Tertile 2 (n=2766) | 1393 | 55 | 1.18 | 1373 | 66 | 1.44 | 0.808 (0.565-1.156) | .243 | 0.798 (0.559-1.140) | .215 | |
| Tertile 3 (n=2766) | 1384 | 58 | 1.25 | 1382 | 67 | 1.45 | 0.853 (0.560-1.212) | .374 | 0.857 (0.603-1.217) | .389 | |
CI, confidence interval.
For the primary outcome except for death from any cause, the hazard ratios, 95% confidence intervals, and P value were calculated with the use of the Fine-Gray subdistribution hazard model for the competing risk of death.
, tertile 2 (B), tertile 3 (C) associated hazard ratios (HRs). The lines depict the intensive and standard arms. The primary outcome was a composite of stroke, acute coronary syndrome, acute decompensated heart failure, coronary revascularization, atrial fibrillation, or death from cardiovascular causes. The hazard ratio, 95% confidence interval (CI), and P value for the primary outcome were calculated with the use of the Fine-Gray subdistribution hazard model for the competing risk of death. The inset shows the same data on an enlarged y-axis.")
Cumulative incidence for the primary outcome by stratification of uric acid. Cumulative hazards over time are depicted for tertile 1 (A), tertile 2 (B), tertile 3 (C) associated hazard ratios (HRs). The lines depict the intensive and standard arms. The primary outcome was a composite of stroke, acute coronary syndrome, acute decompensated heart failure, coronary revascularization, atrial fibrillation, or death from cardiovascular causes. The hazard ratio, 95% confidence interval (CI), and P value for the primary outcome were calculated with the use of the Fine-Gray subdistribution hazard model for the competing risk of death. The inset shows the same data on an enlarged y-axis.
As a sensitivity analysis, the interaction between treatment with uric acid as a continuous variable revealed no significance ().
Uric acid concentrations during follow-upThe results of the mixed effect regression model were translated into LS means (table 4). In the standard group, the uric acid concentrations at baseline, first visit, second visit and third visit were 347μmol/L, 342μmol/L, 341μmol/L, and 333μmol/L. In the standard group, the follow-up uric acid concentrations were 348μmol/L, 344μmol/L, 345μmol/L, and 337μmol/L, respectively. The P values revealed no significant differences over time between the 2 treatment groups (table 4).
Predicted mean levels of uric acid during follow-up
| Uric acid (umol/L) | standard (n=4162) | intensive (n=4132) | P | ||
|---|---|---|---|---|---|
| Year | LS means | 95%CI | LS means | 95%CI | |
| Baseline | 347 | (344-350) | 348 | (345-350) | .761 |
| Second | 342 | (338-345) | 344 | (341-348) | .256 |
| Third | 341 | (338-344) | 345 | (342-348) | .103 |
| Fourth | 333 | (330-336) | 337 | (334-340) | .0741 |
LS means, least square means; CI, confidence interval.
From a mixed effect regression model (least square means).
The results of the present study indicate that the effects of intensive SBP control on the primary outcome were not influenced by baseline uric acid concentrations either in cubic spline regression analyses or in tertile analyses.
Recently, many studies have revealed the association between uric acid and hypertension. High uric acid concentrations may contribute to a higher risk of hypertension, refractory, uncontrolled hypertension, and more aggressive drug treatment. A recent systematic review and meta-analysis revealed that a 1.0-mg/dL increase in the uric acid concentration is associated with a 13% increased risk of incident hypertension (95%CI, 1.06-1.20).12 Asymptomatic hyperuricemia was also reported to be a strong risk factor for refractory hypertension in elderly patients.6 Among patients with a mean age of 59.2 years treated with antihypertensive drugs, serum uric acid concentration was significantly associated with uncontrolled blood pressure even after adjustment for age, body mass index, and the estimated glomerular filtration rate.13 Another study also showed that an elevated uric acid concentration impaired the efficacy of antihypertensive therapy in elderly patients with hypertension as reflected by the need for more antihypertensive drugs, more diuretic use, and blunted blood pressure responses.7
The potential mechanisms underlying how an elevated uric acid concentration may induce hypertension and reduce the protective effects of intensive treatment involve excessive renin-angiotensin-aldosterone system activation,14,15 oxidative stress,14–17 inflammation,18–21 and insulin resistance.22–25 Thus, based on evidence obtained from basic mechanism research, it is reasonable to hypothesize that uric acid-lowering therapy could be a therapeutic approach for hypertension. Some previous randomized controlled trials showed that reducing uric acid substantially decreased blood pressure in adolescents26,27 and adults with chronic refractory gout,28 whereas other randomized controlled trials29,30 revealed no significant blood pressure reduction. These inconsistent results may be explained by differences in the methodology coupled with the effect of changes in kidney function on serum uric acid concentrations. For example, although reduction of uric acid did not lower ambulatory blood pressure in the overall population of adults with hyperuricemia and hypertension, there was a significant reduction in blood pressure in the prespecified subgroup of patients with normal kidney function.29 Most Mendelian studies31,32 did not support the association between blood pressure and uric acid. However, Mendelian studies have some limitations because they only involve gene-dependent associations, and although hyperuricemia has an important genetic component, it is primarily caused by lifestyle habits and diet.33 In elderly patients, the effects of lowering uric acid concentrations on blood pressure control remain unclear. The Scientific Workshop of the National Kidney Foundation reported that the role of serum uric acid concentrations in hypertension remains to be determined and requires further investigation in large-scale trials.34
However, previous studies mainly focused on whether serum uric acid concentrations influence the occurrence or prognosis of hypertension. The evidence on whether baseline serum uric acid concentration blunts the benefits of intensive SBP control remains unknown. Our study used 2 models to detect the influence of uric acid concentration on the effects of SBP innervation. First, the results of spline analysis showed a wide overlap of the confidence intervals. Second, in subgroup analysis, interaction P value between treatment and uric acid stratification for primary outcome was nonsignificant. Moreover, in the sensitivity analysis, the interaction between treatment with uric acid as a continuous variable also revealed no significance. All these findings suggest that the effects of intensive SBP control were not influenced by baseline uric acid concentrations.
In the STEP trial, the patients began treatment with olmesartan medoxomil (an angiotensin receptor blocker) tablets (20mg, once daily) or amlodipine besylate (a calcium channel blocker) tablets (5-10mg, once daily) as an initial therapy not including hydrochlorothiazide.8 Olmesartan does not significantly increase uric acid concentrations,35,36 and antihypertensive therapy with the dihydropyridine calcium channel blocker amlodipine (5-10mg) is associated with a reduced serum uric acid concentration.37 In previous studies, however, thiazide therapy caused a 13% increase in plasma uric acid concentrations.38 Although hydrochlorothiazide was not administered as initial therapy in the STEP trial, the intensive treatment group received a larger number of agents and was more likely to receive a combination of diuretics than the standard arm.39 Thus, it is clinically significant to consider whether intensive blood pressure control elevates uric acid concentrations. The mixed effect regression model was used to test changes in follow-up uric acid concentrations according to the interaction between follow-up years and treatment groups. The results revealed no significant differences in uric acid concentrations over time between the 2 treatment groups (table 4).
LimitationsThe main limitation of this study is that much of the reported variation in HR between the subgroups was caused by chance and that, in the absence of a statistically significant interaction, the best estimate of the effect of the intervention was given by the study-wide effect estimate, including all patients. In addition, the post hoc analysis of randomized controlled trials is subject to potential confounding factors. In this study, this disadvantage presented as large overlap of confidence intervals both in cubic spline regression analyses and tertile analyses.
CONCLUSIONSOur study revealed no difference in the benefit of intensive SBP control in patients with different baseline uric acid concentrations. The datasets used and/or analyzed during the current study are available from the corresponding author on reasonable request.
- •
Previous studies have revealed the association between uric acid and hypertension. High uric acid concentrations may contribute to a higher risk of hypertension, refractory, uncontrolled hypertension, and more aggressive drug therapy. Elevated uric acid concentrations impaired the efficacy of antihypertensive therapy in elderly patients with hypertension, as reflected by the need for more antihypertensive drugs, greater diuretic use, and blunted blood pressure responses. This information indicates that uric acid concentrations may influence the benefits of intensive SBP control.
- •
Our study revealed that no difference was observed in the benefit of intensive SBP control in patients with different baseline uric acid concentrations. We tested this conclusion using 2 models, including cubic spline regression analyses and tertile analyses. In addition, although the intensive treatment group received a larger number of agents and was more likely to received combined diuretics than the standard arm, no significant differences were found in uric acid concentrations over time between the 2 treatment groups.
This work was supported by CAMS Innovation Fund for Medical Sciences (CIFMS, 2021-I2M-1-007), National High Level Hospital Clinical Research Funding (2022-GSP-GG-5, 2022-GSP-PT-12), National Natural Science Foundation of China (Project ID. 81825002), and Beijing Outstanding Young Scientist Program (Project ID, BJJWZYJH0120191002302), Beijing Municipal Science & Technology Commission (Project ID, Z191100006619106, Z201100005620006), Key project of Science and Technology Innovation Project of China Academy of Chinese Medical Sciences (Project ID: CI2021A00920).
AUTHORS’ CONTRIBUTIONSX. Wang and J. Tan made substantial contributions to the conception and design of the study, data collection and analysis, and manuscript drafting and served as the equally contributing first authors of the manuscript. J. Cai and W. Zhang made substantial contributions to the study design, intellectual direction, and revision of the drafting of the manuscript. S. Zhang made substantial contributions to revision of the drafting of the manuscript. All authors read and approved the final manuscript.
CONFLICTS OF INTERESTSThe authors declare that there is no conflict of interest regarding the publication of this paper.
Supplementary data associated with this article can be found in the online version, at https://doi.org/10.1016/j.rec.2023.01.003