Hyperglycemia at admission seems to identify a subgroup of patients with acute coronary syndromes with poorer outcome. The aim of this study was to evaluate the impact of the glycemic variation during hospitalization in long-term mortality in nondiabetic patients.
MethodsRetrospective study of 2043 consecutive patients without known diabetes mellitus admitted for acute coronary syndrome in a single coronary care unit from May 2007 through August 2013. The population was divided in quartiles regarding glycemia at admission (≤ 90 mg/dL, n = 374; 90-140 mg/dL, n = 1307; 141-180 mg/dL, n = 230; ≥ 181mg/dL, n = 111) and the mortality rate quantified for patients with glycemic variation above/below the mean for their respective quartile. The median follow-up was about 1200 days.
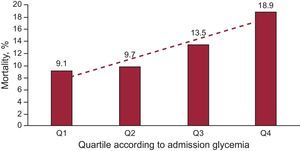
ResultsThe all-cause mortality during follow-up was significantly and successively higher in the upper quartiles (9.1%, 9.7%, 13.5% and 18.9%; P = .007). Multivariate regression analysis showed that hyperglycemia at admission (≥ 181mg/dL) was a strong independent predictor of mortality during follow-up (hazard ratio = 1.74; 95% confidence interval, 1.07-2.8; P = .027). In the fourth quartile (≥ 181mg/dL), the mortality is higher in patients with higher variations of glycemia (37.5% vs 8.5%; P < .001).
ConclusionsHyperglycemia at admission is a predictor of all-cause mortality in our population. The mortality is higher in patients with higher glycemic variations. More studies are needed to confirm these data.
Keywords
The mortality and morbidity of acute coronary syndrome (ACS) remains high despite all development and investment in prevention, diagnosis, and treatment. Hyperglycemia at admission is a known predictor of a worse outcome in diabetic and nondiabetic patients1,2 and the role of an intensive glycemic control in the setting of ACS has been discussed. The most recent European guidelines on ST-segment elevation myocardial infarction3 suggest a “strict, but not too strict” glucose control to avoid hypoglycemia (blood glycemia ≤ 198 mg/dL [≤ 11mmol/L]) and the 2013 American College of Cardiology Foundation/American Heart Association4 guidelines suggest the maintenance of blood glucose levels < 180mg/dL (≤ 10mol/L), both independently of a previous diagnosis of diabetes mellitus.
In nondiabetic patients, several studies have demonstrated that stress hyperglycemia has a negative predictive value regarding mortality and morbidity.2,5–10 According to the work of Capes and coworkers, patients with glucose concentrations between 110 mg/dL and 143mg/dL had a 3.9-fold higher risk of death compared to patients with lower glucose concentrations. Glucose values between 144 mg/dL and 180mg/dL were associated with a 3-fold higher risk of heart failure or cardiogenic shock.8 Besides the hyperglycemia at admission, the failure of glucose levels to decrease in the first 24h after ACS, a higher first fasting glucose measurement, and glycemic variation also seems to predict higher mortality in nondiabetic patients.11–13
The aim of this study was to evaluate the impact of glycemic variation during hospitalization on long-term mortality in nondiabetic patients, assuming active control of glycemia ≥ 180mg/dL and aiming for normoglycemia (90-140mg/dL).
METHODSPatient Population and ProtocolRetrospective study of 2043 consecutive patients without known diabetes mellitus admitted for ACS in a single coronary care unit from May 2007 through August 2013. Patients > 18 years with any type of ACS were included. Patients previously diagnosed with diabetes mellitus were excluded, as well as all patients medicated with antidiabetic oral agents or insulin. Readmissions to the same coronary care unit were not considered for statistic analysis. In-hospital deaths were excluded (3.9% of the initial population of nondiabetics admitted for ACS).
The diagnosis of ACS was based on clinical, electrocardiographic and analytical criteria, according to available guidelines at the time of hospital admission. Twenty-one patients (1% of total population) were lost to follow-up.
The population was divided in quartiles regarding glycemia at admission (quartile 1 [Q1], ≤ 90, n=374; quartile 2 [Q2], 90-140, n=1307; quartile 3 [Q3], 141-180, n=230; quartile 4 [Q4], ≥ 181, n=111). The glycemic variation was calculated for each patient from the glycemia at admission and the minimum value of glycemia during hospitalization. The mean (mg/dL) of the glycemic variations for each quartile was calculated (Q1, 4mg/dL; Q2, 21mg/dL; Q3, 58mg/dl; Q4, 130mg/dL) and patient mortality was classified according to glycemic variation below or above the mean for their respective quartile: Q1, 216/158; Q2, 722/585; Q3, 93/137, and Q4, 71/40, respectively.
Data Collection and EndpointClinical, analytical, and demographic data were retrospectively extracted using dedicated software used in the coronary care unit. Since data is systematically registered for every patient, there were no missing data for the analyzed parameters. The oral glucose tolerance test was performed on day 3 or 4 after admission. To standardize glucose determinations, only venous plasma measurements were considered.
Primary endpoint was all-cause mortality rate of patients above/below the mean of glycemia variation within their quartile (based on glycemia at admission).
Statistical AnalysisContinuous data were normally distributed as evaluated with the Shapiro-Wilk test, and therefore is presented as mean (standard deviation). Dichotomous variables are presented as percentages. Comparison of data between groups was made using one-way analysis of variance for continuous data, and chi-square (or Fisher exact test, as appropriate) for dichotomous data.
All variables with a significant P-value ≤ .10 for all-cause mortality were tested using a multivariate Cox-regression test, with all the variables in the final model reaching a P-value < .05. Relevant variables with significant between-groups differences in univariate analysis (age, type of ACS, heart rate, admission Killip class III/IV, glycemia at admission ≥ 181mg/dL, left ventricular ejection fraction, maximum troponin, minimum hemoglobin, and prior use of acetylsalicylic acid, beta-blockers and statins) were also included in the model to adjust the final analysis for all possible confounders. Survival curves were constructed by the Kaplan-Meier method and were compared using the log rank test.
All analysis was performed with SPSS for Windows, version 20.0 (SPSS Inc.; Chicago, Illinois, United States). A 2-sided P-value ≤ .05 was considered statistically significant. The median follow-up was about 1200 days.
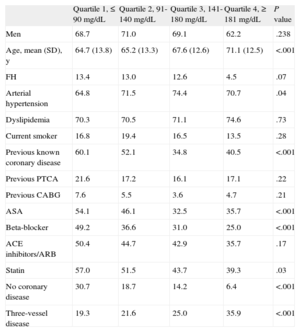
RESULTSThe baseline characteristics of the population are presented in Table 1. In our population, mean glycemia level at admission was 83.3 (6.5) mg/dL in Q1, 109.9 (13.2) mg/dL in Q2, 155.6 (10.5) mg/dL in Q3 and 236.5 (66.6) mg/dL in Q4 (P < .001). The minimum fasting glycemia during hospitalization was 79.2 (7.1) mg/dL in Q1, 89.4 (11.4) mg/dL in Q2, 97.3 (18.4) mg/dL in Q3 and 106.4 (29.2) mg/dL in Q4 (P < .001). By quartile, patients were admitted with the following diagnoses: unstable angina (46.6%, 26.9%, 17%, and 9.4%, respectively; P < .001), ST-segment elevation myocardial infarction (40.2%, 40.7%, 41.8%, and 35.8%; no significant difference) and non—ST-segment elevation acute myocardial infarction (12.1%, 30.7%, 48.9%, and 46.2%; P < .001). Distribution by sex was similar between groups but the age was higher in the higher quartiles.
Baseline Characteristics of the Study Population
| Quartile 1, ≤ 90 mg/dL | Quartile 2, 91-140 mg/dL | Quartile 3, 141-180 mg/dL | Quartile 4, ≥ 181 mg/dL | P value | |
| Men | 68.7 | 71.0 | 69.1 | 62.2 | .238 |
| Age, mean (SD), y | 64.7 (13.8) | 65.2 (13.3) | 67.6 (12.6) | 71.1 (12.5) | <.001 |
| FH | 13.4 | 13.0 | 12.6 | 4.5 | .07 |
| Arterial hypertension | 64.8 | 71.5 | 74.4 | 70.7 | .04 |
| Dyslipidemia | 70.3 | 70.5 | 71.1 | 74.6 | .73 |
| Current smoker | 16.8 | 19.4 | 16.5 | 13.5 | .28 |
| Previous known coronary disease | 60.1 | 52.1 | 34.8 | 40.5 | <.001 |
| Previous PTCA | 21.6 | 17.2 | 16.1 | 17.1 | .22 |
| Previous CABG | 7.6 | 5.5 | 3.6 | 4.7 | .21 |
| ASA | 54.1 | 46.1 | 32.5 | 35.7 | <.001 |
| Beta-blocker | 49.2 | 36.6 | 31.0 | 25.0 | <.001 |
| ACE inhibitors/ARB | 50.4 | 44.7 | 42.9 | 35.7 | .17 |
| Statin | 57.0 | 51.5 | 43.7 | 39.3 | .03 |
| No coronary disease | 30.7 | 18.7 | 14.2 | 6.4 | <.001 |
| Three-vessel disease | 19.3 | 21.6 | 25.0 | 35.9 | <.001 |
ACE, angiotensin-converting enzyme; ARB, angiotensin receptor blockers; ASA, acetylsalicylic acid; CABG, coronary artery bypass graft; FH, family history; PTCA, percutaneous transluminal coronary angioplasty; SD, standard deviation.
Data are expressed as percentages or mean (standard deviation).
The length of hospitalization (days) was higher in the higher quartiles (3.7 [2.4], 4.2 [2.7], 5.0 [3.0], 5.6 [4.2], P < .001). Regarding clinical parameters, the heart rate (beats/min) was significantly different between groups, with Q3 and Q4 having higher values (71.6 [13.9], 74.3 [14.4], 78.5 [20.5], and 81.7 [20.4], respectively; P < .001) as well as admission Killip class III/IV (0.5%, 1.5%, 8.3%, and 9.2%, respectively; P < .001). The prevalence of cardiovascular risk factors was similar between groups except for previous known coronary artery disease, which was more frequent in lower quartiles, and arterial hypertension, which was more prevalent in Q3 (64.8%, 71.5%, 74.4%, and 70.4%, respectively) despite higher rates of prior medication with statins, acetylsalicylic acid, and beta-blockers in the lower quartiles (Table 1).
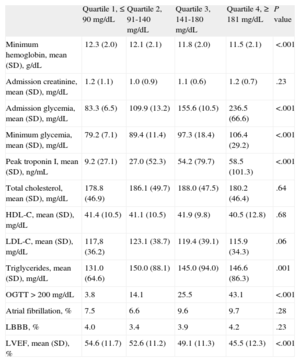
Regarding admission electrocardiography, the prevalence of atrial fibrillation and de novo left bundle branch block was similar between groups. Creatinine at admission, total cholesterol, high-density lipoprotein cholesterol and low-density lipoprotein cholesterol were similar between groups. The minimum hemoglobin was lower in the higher quartiles (12.3 [2.0], 12.1 [2.1], 11.8 [2.0] g/dL, and 11.5 [2.1] g/dL, respectively) and the peak troponin I was higher in higher quartiles (9.2 [27.1] ng/mL, 27.0 [52.3] ng/mL, 54.2 [79.7] ng/mL, and 58.5 [101.3] ng/mL). The oral glucose tolerance test allowed the diagnosis of diabetes mellitus in 43.1% of Q4 patients, 25.5% of Q3 patients, 14.1% of Q2 patients, and 3.8% of Q1 patients (Table 2). Normal coronary angiography was more frequent in the lower quartiles and three-vessel disease was more frequent in higher quartiles (Table 1).
Laboratory and Imaging Characteristics
| Quartile 1, ≤ 90 mg/dL | Quartile 2, 91-140 mg/dL | Quartile 3, 141-180 mg/dL | Quartile 4, ≥ 181 mg/dL | P value | |
| Minimum hemoglobin, mean (SD), g/dL | 12.3 (2.0) | 12.1 (2.1) | 11.8 (2.0) | 11.5 (2.1) | <.001 |
| Admission creatinine, mean (SD), mg/dL | 1.2 (1.1) | 1.0 (0.9) | 1.1 (0.6) | 1.2 (0.7) | .23 |
| Admission glycemia, mean (SD), mg/dL | 83.3 (6.5) | 109.9 (13.2) | 155.6 (10.5) | 236.5 (66.6) | <.001 |
| Minimum glycemia, mean (SD), mg/dL | 79.2 (7.1) | 89.4 (11.4) | 97.3 (18.4) | 106.4 (29.2) | <.001 |
| Peak troponin I, mean (SD), ng/mL | 9.2 (27.1) | 27.0 (52.3) | 54.2 (79.7) | 58.5 (101.3) | <.001 |
| Total cholesterol, mean (SD), mg/dL | 178.8 (46.9) | 186.1 (49.7) | 188.0 (47.5) | 180.2 (46.4) | .64 |
| HDL-C, mean (SD), mg/dL | 41.4 (10.5) | 41.1 (10.5) | 41.9 (9.8) | 40.5 (12.8) | .68 |
| LDL-C, mean (SD), mg/dL | 117,8 (36.2) | 123.1 (38.7) | 119.4 (39.1) | 115.9 (34.3) | .06 |
| Triglycerides, mean (SD), mg/dL | 131.0 (64.6) | 150.0 (88.1) | 145.0 (94.0) | 146.6 (86.3) | .001 |
| OGTT > 200 mg/dL | 3.8 | 14.1 | 25.5 | 43.1 | <.001 |
| Atrial fibrillation, % | 7.5 | 6.6 | 9.6 | 9.7 | .28 |
| LBBB, % | 4.0 | 3.4 | 3.9 | 4.2 | .23 |
| LVEF, mean (SD), % | 54.6 (11.7) | 52.6 (11.2) | 49.1 (11.3) | 45.5 (12.3) | <.001 |
HDL-C, high-density lipoprotein cholesterol; LDL-C, low-density lipoprotein cholesterol; LBBB, left bundle branch block; LVEF, left ventricular ejection fraction; OGTT, oral glucose tolerance test; SD, standard deviation.
Data are expressed as percentages or mean (standard deviation).
The left ventricular ejection fraction, evaluated by echocardiography, was worse in patients with higher glycemia at admission (54.6 [11.7] mg/dL, 52.6 [11.2] mg/dL, 49.1 [11.3] mg/dL, and 45.5 [12.3] mg/dL, respectively). These patients were admitted more often with a Killip class III/IV (0.5%, 1.5%, 8.3%, and 9.2%, respectively).
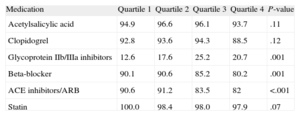
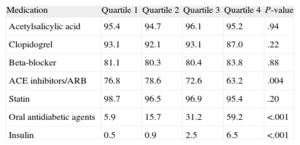
During hospitalization, the higher quartiles were less medicated with beta-blockers and angiotensin-converting enzyme inhibitor/angiotensin II Receptor blockers and more medicated with glycoproteins IIb/IIIa inhibitors (Table 3). After discharge, angiotensin-converting enzyme inhibitor/angiotensin receptor blockers were more often prescribed in the lower quartiles. Oral antidiabetic agents were prescribed for 5.9%, 15.7%, 31.2%, and 59.2% of patients, respectively, and insulin in 0.5%, 0.9%, 2.5%, and 6.5%, respectively (Table 4).
Medication During Hospitalization
| Medication | Quartile 1 | Quartile 2 | Quartile 3 | Quartile 4 | P-value |
| Acetylsalicylic acid | 94.9 | 96.6 | 96.1 | 93.7 | .11 |
| Clopidogrel | 92.8 | 93.6 | 94.3 | 88.5 | .12 |
| Glycoprotein IIb/IIIa inhibitors | 12.6 | 17.6 | 25.2 | 20.7 | .001 |
| Beta-blocker | 90.1 | 90.6 | 85.2 | 80.2 | .001 |
| ACE inhibitors/ARB | 90.6 | 91.2 | 83.5 | 82 | <.001 |
| Statin | 100.0 | 98.4 | 98.0 | 97.9 | .07 |
ACE, angiotensin-converting enzyme; ARB, angiotensin receptor blockers.
Data are expressed as percentages.
Medication After Discharge
| Medication | Quartile 1 | Quartile 2 | Quartile 3 | Quartile 4 | P-value |
| Acetylsalicylic acid | 95.4 | 94.7 | 96.1 | 95.2 | .94 |
| Clopidogrel | 93.1 | 92.1 | 93.1 | 87.0 | .22 |
| Beta-blocker | 81.1 | 80.3 | 80.4 | 83.8 | .88 |
| ACE inhibitors/ARB | 76.8 | 78.6 | 72.6 | 63.2 | .004 |
| Statin | 98.7 | 96.5 | 96.9 | 95.4 | .20 |
| Oral antidiabetic agents | 5.9 | 15.7 | 31.2 | 59.2 | <.001 |
| Insulin | 0.5 | 0.9 | 2.5 | 6.5 | <.001 |
ACE, angiotensin-converting enzyme; ARB, angiotensin receptor blockers.
Data are expressed as percentages.
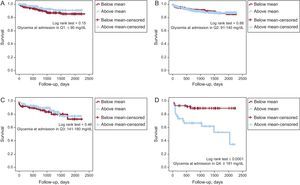
The all-cause mortality at the follow-up was significantly and successively higher in the higher quartiles (9.1%, 9.7%, 13.5%, and 18.9%, P=.007) (Figure 1). Despite increasing mortality in higher quartiles, there are no significant differences between consecutive groups (Q1/Q2, P=.7; Q2/Q3, P=.08; Q3/Q4, P=0.2). However, when Q4 was compared with Q1 + Q2 + Q3 (the quartiles without hyperglycemia), the mortality rate was 23.3% vs 11.2% (P=.003), respectively. After adjusting the mortality according to the mean glycemic variation for each quartile, in the there were no significant differences between groups in the 3 lower quartiles (Figure 2). However, in Q1 there was a trend toward greater mortality in the subgroup with lower variation (11.6% vs 6.3%, P=.112). In Q4, mortality was greater in those patients with higher variations of glycemia (37.5% vs 8.5%, P < .001).
. Q1, quartile 1; Q2, quartile 2; Q3, quartile 3; Q4, quartile 4.")

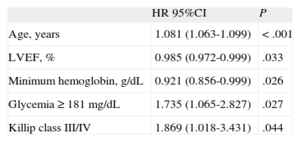
Multivariate analysis showed that hyperglycemia at admission (≥ 181mg/dL) was a strong independent predictor of mortality during follow-up (hazard ratio=1.74; 95% confidence interval [95%CI], 1.07-2.8; P=.027), as were age, left ventricular ejection fraction, minimum hemoglobin, and Killip class III/IV (Table 5).
Multivariate Analysis
| HR 95%CI | P | |
| Age, years | 1.081 (1.063-1.099) | < .001 |
| LVEF, % | 0.985 (0.972-0.999) | .033 |
| Minimum hemoglobin, g/dL | 0.921 (0.856-0.999) | .026 |
| Glycemia ≥ 181 mg/dL | 1.735 (1.065-2.827) | .027 |
| Killip class III/IV | 1.869 (1.018-3.431) | .044 |
95%CI, 95% confidence interval; HR, hazard ratio; LVEF, left ventricular ejection fraction.
Results adjusted for age, type of acute coronary syndrome, heart rate, admission Killip class III/IV, admission glycemia ≥ 181mg/dL, left ventricular ejection fraction, maximum troponin, minimum hemoglobin, and prior use of acetylsalicylic acid, beta-blockers, and statins.
Quartiles were defined according to values considered normoglycemia (90-140mg/dL) and the need to treat as a value above > 180 mg/dL (the last quartile was defined according to Capes et al8). In our population of nondiabetic patients, about 17% (Q3 and Q4) had hyperglycemia at admission and 15% were newly diagnosed with diabetes mellitus. The Q4 patients were treated according to the existing insulin protocol in this coronary care unit, aiming to achieve normoglycemia and to avoid hypoglycemia.
Despite the same prevalence of almost all cardiovascular risk factors in all groups, Q1 patients were more medicated with acetylsalicylic acid, statins, and beta-blockers. This can be explained by the higher presence of known coronary artery disease (secondary prevention).
The patients in higher quartiles were older, more were admitted in Killip class III/IV, and they had higher heart rates, apparently larger infarct size (as demonstrated by higher peak troponin I), lower left ventricular ejection fraction, and lower minimum hemoglobin. All these findings are related to the fact that the lower quartiles had more patients with unstable angina (despite similar ST-segment elevation myocardial infarction prevalence between groups), which seems to demonstrate that higher quartiles had sicker patients. However, after adjusting all variables, glycemia ≥ 181mg/dL remained an important predictor of all-cause mortality at long-term follow-up (hazard ratio=1.7; 95%CI, 1.07-2.83; P=.027), which is in accordance with literature from the prethrombolytic era and the present, despite all advances in invasive and pharmacological therapy.5–14
Our population consisted of patients without a known diagnosis of diabetes mellitus, some of them newly diagnosed patients in whom the ACS was the first manifestation of their disease (15%). Some of these previously untreated diabetic patients could have a more advanced glucose dysmetabolism, a marker of worse prognosis; others could have impaired glucose regulation, also a known risk factor for new cardiovascular events and death.15,16 The hyperglycemia may be a stress response to acute illness (which is associated with poor outcomes not only in the setting of ACS, but also in stroke or respiratory infection)17,18 and not represent any previously undiagnosed abnormal glucose tolerance.
At present, it is not clear whether hyperglycemia itself is a direct cause of poor outcome or is a marker of a more severe disease. However, several effects of this dysmetabolism that interferes in the cardiovascular system have been studied in recent years. It was demonstrated that hyperglycemia could increase the size of the infarct, inducing cardiac myocyte death through apoptosis or exaggerating the ischemia-reperfusion cellular injury, and reduce coronary collateral blood flow. It also has been associated with higher systolic and diastolic blood pressure, increased oxidative stress and catecholamine levels, impaired endothelial function, and activation of the coagulation pathway.19
Thus, hyperglycemia in the acute setting of an ACS identifies a subgroup of patients with a poorer outcome at long-term follow-up who need a correct attempt at treatment. This finding complies with the literature. It is contrary to what is observed in the population of diabetic patients, where a metabolic preconditioning mechanism seems to neutralize this hyperglycemia effect.13
When we formed subgroups according to the glycemic variation (above or below mean within their quartile) we observed no significant differences in the normoglycemic groups despite a trend to a higher mortality rate in patients with lower glycemic variability in Q1 (Figure 2). In Q4, the mortality is higher in patients with higher glycemic variability (above the mean) (Figure 2D). This important finding tells us to be cautious in the treatment of the ACS patient with more severe hyperglycemia, avoiding not only hypoglycemia but also large drops in glucose levels. The acute and rapid decrease in glucose values could be related to poorer outcomes, and glucose monitoring should be done very meticulously.
LimitationsThis is a retrospective study based on a single-center database. The assessment of post-discharge death was made by review of medical records and telephone interview with relatives, which contributed to the low rate of patients lost to follow-up (1%).
The primary endpoint was all-cause mortality because a significant number of patients died out of hospital and the causes of death could not be assessed with precision. Some of the items of the clinical history and previous risk factors were based on the patient report (not always fully reliable); their prevalence may be underestimated. Despite all of these aspects, we think the results can be extrapolated for other ACS populations because our demographic and clinical data are in line with those reported in most published ACS registries.
CONCLUSIONSHyperglycemia at admission is a strong independent predictor of all-cause mortality at long-term follow-up in nondiabetic patients. The higher glycemic variability in patients with glucose ≥ 181mg/dL at admission can be deleterious and should be avoided. More studies are needed in this field to better delineate a treatment strategy.
CONFLICTS OF INTERESTNone declared