


ISSN: 1885-5857 Impact factor 2024 4.9
Vol. 77. Num. 9.
Pages 750-758 (September 2024)

Original article
Carbohydrate antigen 125-guided pre-TAVI medical optimization: impact on quality of life and clinical outcomes

Optimización médica pre-TAVI guiado por el antígeno carbohidrato 125: impacto en la calidad de vida y resultados clínicos

Sergio García-BlasabcVicente PerniasdJessika González D’GregorioeAgustín Fernández-CisnalabcClara BonanadabcfClara SastregErnesto ValeroabcGema MiñanaabcfGeorgiana ZahariabcJulio NúñezabcfJuan Sanchisabcf
https://doi.org/10.1016/j.rec.2024.01.002

Options

Supplementary data
Imagen extra
Rev Esp Cardiol. 2024;77:750-8
Abstract
Introduction and objectives

Carbohydrate antigen 125 (CA125), a biomarker associated with fluid overload, has proven useful in managing diuretic therapy in heart failure. We aimed to evaluate the impact of diuretic optimization guided by CA125 before transcatheter aortic valve implantation (TAVI) on outcomes.

Methods

This prospective interventional study enrolled patients scheduled for TAVI, in whom baseline CA125 was measured 2 weeks before TAVI. Patients with CA125 ≥ 20 U/mL underwent diuretic up-titration before TAVI. Three groups were included: group I) baseline CA125 <20 U/mL; IIa) CA125 ≥ 20 U/mL that decreased after treatment, and IIb) CA125 ≥ 20 U/mL that did not decrease. The primary outcome was changes in the Kansas City Cardiomyopathy Questionnaire at 3 and 12 months. The secondary endpoint was clinical events.

Results

The study included 184 patients (115 group I, 46 IIa, and 23 IIb). Groups I and IIa exhibited early and sustained improvements in the Kansas City Cardiomyopathy Questionnaire (group I: 18.9 points [95%CI, 15.7-22.1; P <.001] at 90 days, and 18.1 [95%CI, 14.9-21.4, P <.001] at 1 year; group IIa: 21.1 points [95%CI, 15.4-26.7; P <.001] and 19.5 [95%CI, 13.9-25.1; P <.001] respectively). In contrast, in group IIb there was no significant improvement at 90 days (P=.12), with improvement being significant only at 1 year (17.8 points, 95%CI, 5.9-29.6; P=.003). Over a median follow-up of 20.7 months, there were 63 (27.83%) deaths or heart failure admissions. Multivariate analysis showed a lower risk of events in group I vs IIb (HR, 0.28; 95%CI, 0.14-0.58; P <.001), and IIa vs IIb (HR, 0.24; 95%CI, 0.11-0.55; P <.001).

Conclusions

Patients with persistently high CA125 despite diuretic therapy pre-TAVI showed slower functional recovery and poorer clinical outcomes after TAVI.

Keywords

Aortic valve stenosis
Transcatheter aortic valve implantation
Biomarkers
INTRODUCTION

Transcatheter aortic valve implantation (TAVI) has become a first-line therapy for severe aortic stenosis in patients aged ≥ 75 years.1 Despite the widespread use of this technique, there is still a need for strategies to help in patient selection and risk stratification. Circulating biomarkers have emerged as potentially valuable tools for improving risk stratification and patient selection. Natriuretic peptides have been evaluated for this purpose with conflicting results.2–4

Circulating levels of carbohydrate antigen 125 (CA125) have shown clinical usefulness in heart failure (HF).5 Plasma CA125 concentrations correlate with clinical, hemodynamic, and echocardiographic parameters related to disease severity and fluid overload.5,6 As a marker of fluid overload, higher levels of CA125 identify patients with greater extravascular congestion.7 In acute HF, high levels of this glycoprotein are associated with a higher risk of mortality and readmission.5,8 Changes in this biomarker after the first months following HF decompensation are also associated with prognosis.8–10 Additionally, 2 randomized clinical trials have shown that this biomarker seems helpful in tailoring the intensity of diuretic therapy in patients after an episode of acute HF.11,12

CA125 is upregulated in a significant percentage of patients with symptomatic aortic stenosis, which is associated with the severity of symptoms and risk of adverse outcomes.13 Moreover, it has been suggested that higher baseline and follow-up levels are independently associated with adverse clinical outcomes after TAVI.14–16 We hypothesized persistently elevated CA125 levels despite pre-TAVI diuretic up-titration would identify patients with a poor prognosis. Conversely, we also hypothesized that a reduction in CA125 after optimization would improve clinical results.

The aim of the present study was to evaluate whether pre-TAVI medical optimization guided by CA125 levels influences TAVI clinical outcomes.

METHODSDesign and study population

This is an open-label interventional single-center study of patients with severe aortic stenosis scheduled to undergo TAVI. Exclusion criteria were patients’ refusal to participate and critical clinical status requiring an emergent procedure. After inclusion in the protocol, the patients were scheduled to undergo TAVI in the following 2 weeks. The study was approved by the local Clinical Research Ethics Committee. Written informed consent was obtained from all included patients and was adequately archived.

Study procedures

Two weeks before the procedure, CA125 levels were determined to divide the cohort in 2 subgroups: CA125 <20 U/mL (group I) and ≥ 20 U/mL (group II). This threshold was derived from a previous observational study that identified 18.4 UI/mL as the best cutoff level to predict death or HF readmission at 1 year of follow-up after TAVI16. Group I patients were treated according to usual clinical practice. In group II, the diuretic dose was titrated based on CA125 levels: CA125 ≥ 20 but ≤ 35 U/mL, addition of 40mg of furosemide qid; CA125 ≥ 35 but ≤ 80 U/mL, an increase of 80mg the daily dose of furosemide, and thiazides may be considered; CA125 ≥ 80 U/mL, intravenous administration of furosemide was recommended (120mg per day or 2.5 times the daily oral dose). It was recommended to maintain the adjusted oral dose until the procedure. CA125 levels were measured again immediately before TAVI.

TAVI was performed according to usual clinical practice, as well as patient management during admission. Treatment after discharge was left at the physician's discretion.

Study groups

The cohort was divided into 3 groups based on CA125 levels. Group I were patients with baseline CA125 <20 U/mL. Group II comprises patients with baseline CA125 ≥ 20 U/mL, and it was further divided according to the changes in CA125 after the 2-week intensification of diuretic treatment in group IIa if CA125 levels decreased, and group IIb if not.

Variables

Clinical data were collected, including demographics, symptoms, signs, comorbidities, Society of Thoracic Surgeons (STS) Short-Term Risk Score,17 Euroscore,18 frailty (assessed by Fried19 and clinical frailty scale20), blood test results, electrocardiogram, echocardiographic findings, and medical treatment. Quality of life (QoL) was assessed by the Kansas City Cardiomyopathy Questionnaire (KCCQ).21

Endpoints

The primary endpoint was the change in QoL at 90 days and 1 year after TAVI. This endpoint was described in 3 ways:

  • a)

    Changes from baseline as a continuous variable.

  • b)

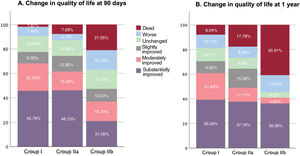
    As an ordinal variable, categorized based on a previously established threshold for clinically relevant change22,23: dead; worse (decrease from baseline of 5 points); unchanged (change between 5 and 5 points); slightly improved (increase between 5 and 10 points); moderately improved (increase between 10 and 20 points); and substantially improved (increase 20 points). This definition was included merely for descriptive purposes.

  • c)

    Composite of death and changes in QoL: we defined poor outcome if the patient died or if KCCQ was <45 or decreased (worsening) by ≥ 10 points. This definition was based on a previous study work of the PARTNER trial.24

The secondary endpoint was time to the composite of death or readmission due to HF at maximum follow-up.

Statistical analysis

Baseline patient characteristics are reported for continuous variables as mean±standard deviation or median [interquartile range], and as frequencies (percentages) for categorical variables. All variables were described both in the entire sample and in each study group. Differences between CA125 groups were evaluated with the Fisher exact test for qualitative variables and with the Kruskal-Wallis, Wilcoxon, or ANOVA tests for quantitative variables.

A linear mixed regression model was used for the analysis of the primary endpoint as a continuous variable, for comparisons within and between groups at 90 days and 1 year. All analyses of continuous endpoints included the baseline value of the endpoint as a covariate (mixed model within the framework of ANCOVA). Linear mixed regression model results are presented as least square means with 95% confidence intervals (95%CIs) and P values. Covariates included into the final linear mixed regression models were baseline KCCQ values and the following widely recognized prognostic variables in this context: STS score, Fried score, baseline N-terminal pro-B-type natriuretic peptide (NT-proBNP) levels, left ventricular ejection fraction, mean aortic gradient, and furosemide dose. Multivariate logistic regression analysis was applied for the dichotomous variable combining KCCQ and death and included the following covariates: STS score, Fried score, baseline NT-proBNP levels, left ventricular ejection fraction, mean aortic gradient and furosemide dose. For the secondary combined endpoint (death or HF readmission), a Cox regression model was performed including widely recognized prognostic variables and variables that showed statistically significant association in the univariate analysis, using the stepwise backward procedure. The covariates included in the final Cox model were age, New York Heart Association functional class, atrial fibrillation, previous pacemaker, right bundle branch block, Fried score, STS score, baseline KCCQ, baseline hemoglobin, NT-proBNP and CA125 levels, glomerular filtration rate, mean aortic gradient, previous coronary revascularization, left ventricular ejection fraction, and treatment with mineralocorticoid receptor antagonists. All analyses were performed with STATA 15.1 (Stata Statistical Software, Release 15 [2017]; StataCorp LP, College Station, United States).

Sample size estimation was based on previous studies that found significant differences in health status indices at 1 month after TAVI analyzing 200 patients.22,25 According to a previous study, we estimated that close to 50% of the population would have CA125 ≥ 20 U/mL.14

RESULTS

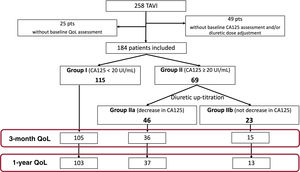
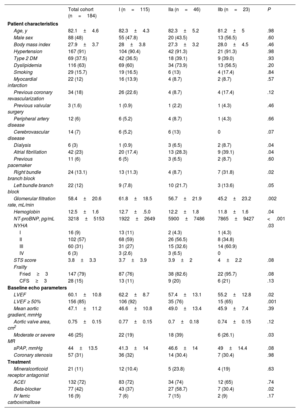
From May 2018 to June 2021, 184 patients were included from a total of 258 TAVI performed in this period (figure 1). Baseline characteristics are summarized in table 1. Furosemide daily dose in patients with baseline CA12520 U/mL was titrated following protocol recommendations, resulting in a change from 21.75mg±19.15 before inclusion to 63.5mg±38.3mg; there were no significant differences in diuretic dose between groups IIa and IIb (70mg±32.9 and 63.4mg±41.2 respectively; P=.58). After a median of 13 [IQR, 8.5] days, with no significant differences between groups (P=.187), CA125 levels were re-evaluated immediately before the TAVI procedure, with a median decrease of 6 [IQR, 18] U/mL from 40 U/mL to 33 U/mL, P=.005, representing a 18% reduction [IQR, 34]. Based on both the baseline and preprocedural CA125 levels, patients were categorized into 3 distinct groups. Group I consisted of 115 patients with baseline CA125 <20 U/mL. Group II was divided into 2 subcategories: Group IIa with 46 patients who had baseline CA125 levels20 U/mL and demonstrated a decrease following diuretic treatment, and group IIb with 23 patients who had baseline CA125 levels20 U/mL but showed no subsequent decrease. Table 2 shows baseline and preprocedural CA125 levels in each group; of note, no statistical difference was found in baseline CA125 levels between groups IIa and IIb. Procedural data are summarized in table 1 of the supplementary data. NT-proBNP changes are shown in table 2 of the supplementary data.

Figure 1.

Flow Chart. CA125, carbohydrate antigen 125; QoL, quality of life; TAVI, transcatheter aortic valve implantation.

(0.22MB).
Table 1.

Baseline characteristics

  Total cohort (n=184)  I (n=115)  IIa (n=46)  IIb (n=23)  P 
Patient characteristics
Age, y  82.1±4.6  82.3±4.3  82.3±5.2  81.2±.98 
Male sex  88 (48)  55 (47.8)  20 (43.5)  13 (56.5)  .60 
Body mass index  27.9±3.7  28±3.8  27.3±3.2  28.0±4.5  .46 
Hypertension  167 (91)  104 (90.4)  42 (91.3)  21 (91.3)  .98 
Type 2 DM  69 (37.5)  42 (36.5)  18 (39.1)  9 (39.0)  .93 
Dyslipidemia  116 (63)  69 (60)  34 (73.9)  13 (56.5)  .20 
Smoking  29 (15.7)  19 (16.5)  6 (13)  4 (17.4)  .84 
Myocardial infarction  22 (12)  16 (13.9)  4 (8.7)  2 (8.7)  .57 
Previous coronary revascularization  34 (18)  26 (22.6)  4 (8.7)  4 (17.4)  .12 
Previous valvular surgery  3 (1.6)  1 (0.9)  1 (2.2)  1 (4.3)  .46 
Peripheral artery disease  12 (6)  6 (5.2)  4 (8.7)  1 (4.3)  .66 
Cerebrovascular disease  14 (7)  6 (5.2)  6 (13)  .07 
Dialysis  6 (3)  1 (0.9)  3 (6.5)  2 (8.7)  .04 
Atrial fibrillation  42 (23)  20 (17.4)  13 (28.3)  9 (39.1)  .04 
Previous pacemaker  11 (6)  6 (5)  3 (6.5)  2 (8.7)  .60 
Right bundle branch block  24 (13.1)  13 (11.3)  4 (8.7)  7 (31.8)  .02 
Left bundle branch block  22 (12)  9 (7.8)  10 (21.7)  3 (13.6)  .05 
Glomerular filtration rate, mL/min  58.4±20.6  61.8±18.5  56.7±21.9  45.2±23.2  .002 
Hemoglobin  12.5±1.6  12.7±.5.0  12.2±1.8  11.8±1.6  .04 
NT-proBNP, pg/mL  3218±5153  1922±2649  5900±7486  7865±9427  <.001 
NYHA          .03 
16 (9)  13 (11)  2 (4.3)  1 (4.3)   
II  102 (57)  68 (59)  26 (56.5)  8 (34.8)   
III  60 (31)  31 (27)  15 (32.6)  14 (60.9)   
IV  6 (3)  3 (2.6)  3 (6.5)   
STS score  3.8±3.3  3.7±3.9  3.9±4±2.2  .08 
Frailty           
Fried147 (79)  87 (76)  38 (82.6)  22 (95.7)  .08 
CFS28 (15)  13 (11)  9 (20)  6 (21)  .13 
Baseline echo parameters
LVEF  60.1±10.8  62.2±8.7  57.4±13.1  55.2±12.8  .02 
LVEF ≥ 50%  156 (85)  106 (92)  35 (76)  15 (65)  .001 
Mean aortic gradient, mmHg  47.1±11.2  46.6±10.8  49.0±13.4  45.9±7.4  .39 
Aortic valve area, cm2  0.75±0.15  0.77±0.15  0.7±0.18  0.74±0.15  .12 
Moderate or severe MR  46 (25)  22 (19)  18 (39)  6 (26.1)  .03 
sPAP, mmHg  44±13.5  41.3±14  46.6±14  49±14.4  .08 
Coronary stenosis  57 (31)  36 (32)  14 (30.4)  7 (30.4)  .98 
Treatment
Mineralcorticoid receptor antagonist  21 (11)  12 (10.4)  5 (23.8)  4 (19)  .63 
ACEI  132 (72)  83 (72)  34 (74)  12 (65)  .74 
Beta-blocker  77 (42)  43 (37)  27 (58.7)  7 (30.4)  .02 
IV ferric carboximaltose  16 (9)  7 (6)  7 (15)  2 (9)  .17 

ACEI, angiotensin converting enzyme inhibitor; DM, diabetes mellitus; CFS, Clinical Frailty Scale; IV, intravenous; LVEF, left ventricular ejection fraction; MR, mitral regurgitation; NT-proBNP, N-terminal pro-B-type natriuretic peptide; NYHA, New York Heart Association; sPAP, systolic pulmonary artery pressure; STS, Society of Thoracic Surgeons.

Quantitative variables are expressed as mean±standard deviation and qualitative variables as No. (%). P values express global comparisons.

Table 2.

Changes in CA125 levels (U/mL)

Group  Baseline CA125  Pre-TAVI CA125  Absolute Change  % Change  P  3 m F-U  1 y F-U 
11 [6]  9 [7]  −1 [2]  −10% [21.4]  .007  10 [7]  10 [7] 
IIa  31.5 [56]  23 [32]  −11 [15]  −26.5% [25]  <.001  19 [20]  16.5 [14] 
IIb  51 [77]  84 [107]  18 [38]  22% [64]  <.001  30 [68]  26.5 [57] 

CA125, carbohydrate antigen 125; TAVI, transcatheter aortic valve implantation.

Values are expressed as median [interquartile range].

Quality of life change according to CA125 group

The baseline QoL measurements were statistically different across the 3 study groups, with better QoL in those belonging to group I and worse QoL in group IIb (group I median KCCQ 51 [IQR, 29], group IIa 45 [IQR, 27] and group IIb 43 [IQR, 18]; P=.029).

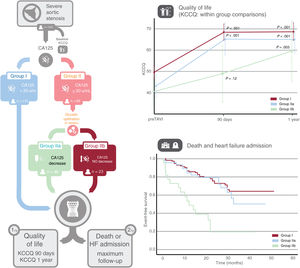
After TAVI, patients in groups I and IIa experienced early and sustained improvements in KCCQ compared with its baseline values. Specifically, in group I, a median gain of 18.9 points was observed at 90 days (95%CI, 15.7-22.1; P <.001), which was maintained at 1 year with an increase of 18.1 points (95%CI, 14.9-21.4; P <.001). In group IIa, an elevation by a median of 21.1 points was noted at 90 days (95%CI, 15.4-26.7; P <.001), and this trend persisted at 1 year, registering a median increase of 19.5 points (95%CI, 13.9-25.1; P <.001) (figure 2). In contrast, patients in group IIb did not experience a significant improvement in KCCQ at 90 days (increase of 8.9 points, 95%CI, −2.3-20.1; P=.12); however, a notable improvement was observed at the 1-year evaluation, with an increase in KCCQ score to 17.8 points relative to baseline (95%CI, 5.9-29.6; P=.003) (figure 2).

Figure 2.

Central illustration. Study overview and findings. The left panel outlines the study protocol, interventions, and groups. The upper right displays quality of life changes (KCCQ) in CA125 groups at baseline, 90 days, and 1 year, with P values indicating intragroup baseline comparisons. Group definitions are as follows: group I: baseline CA125 <20 U/mL; IIa: baseline CA125 ≥ 20 U/mL with significant diuretic therapy improvement; IIb: baseline CA125 ≥ 20 U/mL without significant improvement posttherapy. The lower right shows Kaplan-Meier curves for mortality and heart failure admissions during follow-up. CA125, carbohydrate antigen 125; HF, heart failure; KCCQ, Kansas City Cardiomyopathy Questionnaire.

(0.42MB).

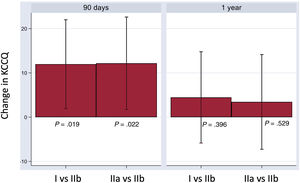
At 90 days, between-group comparisons showed higher KCCQ in group I (11.9 points; 95%CI, 1.9-22; P=.019) and group IIa (12.1 points; 95%CI, 1.7-22.6; P=.022) compared with group IIb. However, between-group differences were no longer significant at 1 year (I vs IIb: 4.4; 95%CI, -5.8-14.8; P=.396, and IIa vs IIb: 3.44; 95%CI, −7.2-14.1; P=.529) (figure 3). Figure 4 illustrates changes in QoL categorized as an ordinal variable.

Figure 3.

Comparative analysis of variation in KCCQ scores at 90 days and 1 year. Each bar delineates the differential change in KCCQ between group I and group IIb, as well as between group IIa and group IIb. Corresponding P values are specified for each comparison. The left panel represents the evaluation at the 90-day mark, while the right panel corresponds to 1-year assessment. KCCQ, Kansas City Cardiomyopathy Questionnaire.

(0.14MB).
Figure 4.

Quality of life change as an ordinal variable, categorized into the following groups: dead; worse (decrease from baseline of 5 points in the KCCQ); unchanged (change between 5 and 5 points); slightly improved (increase between 5 and 10 points); moderately improved (increase between 10 and 20 points); and substantially improved (increase 20 points). A: at the 90-day evaluation. B: At the 1-year evaluation. KCCQ, Kansas City Cardiomyopathy Questionnaire.

(0.21MB).
Poor response: death or poor quality of life

In group I, 18.7% of patients were categorized as having a poor outcome after 90 days, and this percentage increased to 25% after 1 year. In group IIa, these proportions were higher, with 33.3% at 90 days and 40% at 1 year. The highest proportions were seen in group IIb, with 63.2% having a poor outcome at 90 days, and 54.5% after 1 year. In the multivariate analysis, and compared with patients in group IIb, both group I and group IIa independently exhibited a lower likelihood of a poor outcome (defined as either mortality or failure to achieve a significant improvement in QoL) (group I vs group IIb; odds ratio [OR], 0.12; 95%CI, 0.03-0.42; P=.001; group IIa vs group IIb; OR, 0.27; 95%CI, 0.08-0.94; P=.040) at 90 days. At 1 year, similar results were found for group I vs group IIb (OR, 0.28; 95%CI, 0.09-0.83; P=.022), while comparison between groups IIa and IIb were not statistically significant (OR, 0.46; 95%CI, 0.15-1.48; P=.196).

Death or admission for heart failure at follow-up

Follow-up was performed in 183 patients (99.4%) at a median of 20.7 months and 63 (34.2%) deaths or admissions for HF were ascertained. The incidence rate was 0.14 per person year in group I, 0.18 in group IIa, and 0.62 in IIb (P <.001). The Kaplan-Meier curves illustrating this endpoint are displayed in figure 2, which reveals a significant difference in event occurrence among the different groups (P <.001). Table 3 of the supplementary data shows the result of the univariate analysis. The multivariate analysis supported the independent association of CA125 groups with death or readmission for HF, specifically the lower risk of events in group I compared with group IIb (hazard ratio [HR], 0.20; 95%CI, 0.10-0.38; P <.001) and group IIa compared with IIb (HR, 0.25; 95%CI, 0.12-0.52; P <.001), whereas no differences were encountered between groups I and IIa (HR, 0.81; 95%CI, 0.44-1.49; P=.49). Other variables independently associated with the combined endpoint were age, previous coronary revascularization, New York Heart Association, and treatment with mineralocorticoid receptor antagonists (table 3).

Table 3.

Multivariate model for death or readmission

Death or readmission
  HR  95%CI  P 
Age  1.07  1.02-1.13  .01 
Previous coronary revascularization  2.26  1.28-3.97  .005 
NYHA functional class  2.04  1.39-3.00  <.001 
MRA  2.68  1.36-5.23  .004 
Group I vs Group IIb  0.20  0.10-0.38  <.001 
Group IIa vs Group IIb  0.25  0.12-0.52  <.001 

95%CI, 95% confidence interval; HR, hazard ratio; MRA, mineralocorticoid receptor antagonists; NYHA, New York Heart Association.

DISCUSSION

The present study represents a step further in risk stratification, and optimal management of patients with symptomatic aortic stenosis referred for TAVI. The novelty of this research lies in demonstrating that a CA125-diuretic guided strategy may be useful for optimizing the TAVI results in terms of QoL and adverse clinical events. Patients with CA125 levels below 20 U/mL (no overt fluid overload) and those with levels above 20 U/mL that decreased following diuretic up-titration displayed (adequate decongestion) showed a similar pattern of early and sustained increase in KCCQ scores. In contrast, patients with CA125 levels above 20 U/mL that did not decrease after enhanced diuretic therapy exhibited no significant improvement in KCCQ scores at the 90-day follow-up, although survivors within this group demonstrated a significant improvement in QoL at the end of 1 year. Regarding clinical events, nonresponders showed a higher incidence of the combined event of death and HF admission.

Risk stratification in candidates for TAVI has been an issue of the utmost interest since the beginning of this technique when only high-risk patients were considered for this procedure and futility was a major concern.26 The widespread use of TAVI throughout the risk spectrum has increased even further the need for tools for this purpose to optimize results and resources. Multiple scores have been proposed, but there is no clear gold-standard or validated thresholds to guide therapeutic decisions.27–30 Biomarkers may help in this process, as they offer an objective and reproducible evaluation of patient status and are widely available.

CA125 has emerged as a useful biomarker in acute HF by showing a close relationship with the severity of fluid overload and prognosis.6,8–10,31,32 CA125 plasma levels are also elevated in a significant percentage of patients with symptomatic aortic stenosis and they have shown a correlation with symptoms and prognosis.13–16 In a series of 363 TAVI patients, Rheude et al.16 found that both CA125 and NT-proBNP are related to death and readmission at 1 year of follow-up after the procedure, but the predictive capacity of the former was superior when combined. In that article, the optimal threshold to predict clinical events was 18.4 U/mL. Based on these data, we used a similar cutoff (20 U/mL) for the design of our study. The novelty of the present work is the prospective design and the evaluation of the response to diuretic therapy. We found that not only baseline levels but also changes after diuretic treatment are useful to determine the probability of clinical benefit after TAVI.

Some data suggest that patients with severe aortic stenosis treated with diuretics have a worse prognosis.30,33 However, in the present study, only nonresponders (ie, those with no decrease in CA125 levels despite diuretic up-titration) were less prone to clinical improvement in QoL and clinical events. Of note, the impact of CA125 response was independent of left ventricular function, mitral disease, atrial fibrillation and systolic pulmonary pressure, which are all determinants for aortic stenosis cardiac damage staging, as well as STS score frailty (assessed by Fried) and other relevant comorbidities.34,35 Importantly, patients in group IIb who survived 1 year after TAVI significantly increased their KCCQ score and there were no longer statistically significant differences with the other groups. This observation suggests that within this high-risk group, certain individuals could potentially benefit from TAVI in terms of QoL, albeit at a more gradual pace of improvement. Conversely, patients presenting with initially elevated CA125 levels that dropped following diuretic intensification exhibited comparable outcomes to those patients with low baseline levels, suggesting a high probability of clinical benefit after TAVI.

Recent data support the potential role of CA125 levels for treatment titration in HF. The CHANCE-HF trial randomized 380 patients discharged for acute HF with persistent high CA125 levels to a biomarker-guided strategy (aimed to reduce CA125 to ≤ 35 U/mL) vs standard of care.11 The CA125 strategy resulted in a significant reduction in the primary combined endpoint (death or readmission for HF), mainly driven by a reduction in HF readmissions. Another randomized trial showed that a CA125-guided diuretic strategy was associated with a significant improvement in glomerular filtration rate at 72hours in patients with acute HF and renal dysfunction.12 The results of our study support the use of CA125-guided therapy in TAVI patients. Adding CA125 assessment in the clinical pathway before and after TAVI may be helpful in 3 ways: up-titrating diuretic therapy before the procedure in patients with high baseline CA125 levels, including CA125 response to diuretics as a part of a multimodal assessment for clinical futility, and performing a close clinical follow-up after TAVI in nonresponders.

Our results raise the dilemma of futility of TAVI in patients with higher levels of CA125 that do not decrease after diuretic up-titration. Although this subgroup represents a minority (12.5% of our sample), it is characterized by an exceedingly adverse prognosis. However, the potential benefits of TAVI should not be entirely dismissed without thorough assessment. Patients unresponsive to therapy may require either a more prolonged or intensified diuretic regimen prior to TAVI, and/or may need to sustain high-dose diuretic treatment or other HF medications postprocedure. It is doubtful that a longer diuretic treatment before the procedure could be warranted because delays in the intervention are related to fatal events. Therefore, a strategy based on continued intensive treatment and close follow-up after TAVI in this subgroup of patients seems more reasonable. Further investigation is warranted to evaluate the clinical benefit of this approach.

Limitations

This study has some limitations. This is a single-center study with a limited number of patients without a control group. A different diuretic adjustment might have achieved a higher decrease in CA125 levels; however, the diuretic dose was tripled in the baseline CA125> 20 U/mL group, and a longer treatment duration would have led to excessive delays in TAVI. Finally, with the present data, we cannot unravel the mechanism behind these findings. We speculate that high CA125 without optimal short-term diuretic response identifies patients with more advanced HF with potential involvement of right-sided HF, a clinical situation in which the effectiveness of TAVI may be more uncertain.

CONCLUSIONS

CA125 assessment may be helpful for risk stratification and guiding diuretic therapy before TAVI. Our results suggest that diuretic optimization in patients with CA125 ≥ 20 U/mL with subsequent CA125 reduction may identify patients with favorable outcomes early after TAVI. Conversely, those without CA125 reduction after diuretic intensification may belong to a higher risk group, susceptible to adverse outcomes after TAVI. Whether CA125 may help guide the timing of TAVI or identify futility requires larger controlled studies.

FUNDING

This work was supported by grants from Spain's Ministry of Science and Innovation through the Carlos III Health Institute and FEDER founds: FIS18/01138; Exp. JR/21/00041; CIBER-CV 16/11/00420, Madrid, Spain.

ETHICAL CONSIDERATIONS

The study was approved by the Clinical Research Ethics Committee of the University Hospital Clinic in Valencia. Written informed consent was obtained from all included patients and was adequately archived. Sex was included in statistical analysis.

STATEMENT ON THE USE OF ARTIFICIAL INTELLIGENCE

None.

AUTHORS’ CONTRIBUTIONS

Study concept and design: J. Sanchis and J. Núñez. Analysis and interpretation of data: S. García-Blas, J. Núñez, J. Sanchis, C. Bonanad, A. Fernández-Cisnal. Drafting of the manuscript: S. García-Blas, A. Fernández-Cisnal, J. Núñez, V. Pernias. Critical review of the manuscript for important intellectual content: J. González D’Gregorio, C. Sastre, C. Bonanad, E. Valero, G. Miñana, G. Zaharia, J. Núñez, J. Sanchis.

CONFLICTS OF INTEREST

J. Sanchis is editor-in-chief of Rev Esp Cardiol. The journal's editorial procedure to ensure impartial handling of the manuscript has been followed.

The remaining authors report that they have no relationships with industry relevant to the contents of this article to disclose.

WHAT IS KNOWN ABOUT THE TOPIC?

Strategies for TAVI risk stratification and optimization are still an unmet clinical need. Biomarkers may be helpful for this purpose. CA125 levels are related to congestion and have been associated with worse outcomes after TAVI.

WHAT DOES THIS STUDY ADD?

The response of up-titration of diuretic therapy guided by CA125 levels in patients scheduled for TAVI is associated with outcomes after the procedure. Patients with low baseline CA125 levels and those with levels above 20 U/mL that decreased after diuretic intensification showed an early and sustained improvement in quality of life. Patients with CA125 levels> 20 U/mL which remained high despite diuretic therapy had more unfavorable outcomes in terms of quality of life and clinical events (death or HF admissions).

APPENDIX
SUPPLEMENTARY DATA

Supplementary data associated with this article can be found in the online version available at https://doi.org/10.1016/j.rec.2024.01.002

References
[1]
A. Vahanian, F. Beyersdorf, F. Praz, et al.
2021 ESC/EACTS Guidelines for the management of valvular heart disease: Developed by the Task Force for the management of valvular heart disease of the European Society of Cardiology (ESC) and the European Association for Cardio-Thoracic Surgery (EACTS).
Eur Heart J., (2022), 43 pp. 561-632
[2]
R. Pfister, T. Wahlers, F.M. Baer, M. Scherner, J. Strauch, E. Erdmann.
Utility of NT-pro-BNP in patients undergoing transapical aortic valve replacement.
Clin Res Cardiol., (2010), 99 pp. 301-307
[3]
J. Kefer, C. Beauloye, P. Astarci, et al.
Usefulness of B-type natriuretic peptide to predict outcome of patients treated by transcatheter aortic valve implantation.
Am J Cardiol., (2010), 106 pp. 1782-1786
[4]
K. Spargias, S. Polymeros, A. Dimopoulos, et al.
The predictive value and evolution of N-terminal pro-B-type natriuretic peptide levels following transcutaneous aortic valve implantation.
J Interv Cardiol., (2011), 24 pp. 462-469
[5]
J. Núñez, R. de la Espriella, G. Miñana, et al.
Antigen carbohydrate 125 as a biomarker in heart failure: a narrative review.
Eur J Heart Fail., (2021), 23 pp. 1445-1457
[6]
A. D’Aloia, P. Faggiano, G. Aurigemma, et al.
Serum levels of carbohydrate antigen 125 in patients with chronic heart failure: relation to clinical severity, hemodynamic and Doppler echocardiographic abnormalities, and short-term prognosis.
J Am Coll Cardiol., (2003), 41 pp. 1805-1811
[7]
G. Miñana, R. de la Espriella, A. Mollar, et al.
Factors associated with plasma antigen carbohydrate 125 and amino-terminal pro-B-type natriuretic peptide concentrations in acute heart failure.
Eur Heart J Acute Cardiovasc Care., (2020), 9 pp. 437-447
[8]
J. Núñez, E. Núñez, J. Sanchis, et al.
Antigen carbohydrate 125 and brain natriuretic peptide serial measurements for risk stratification following an episode of acute heart failure.
Int J Cardiol., (2012), 159 pp. 21-28
[9]
J. Núñez, E. Núñez, A. Bayés-Genís, et al.
Long-term serial kinetics of N-terminal pro B-type natriuretic peptide and carbohydrate antigen 125 for mortality risk prediction following acute heart failure.
Eur Heart J Acute Cardiovasc Care., (2017), 6 pp. 685-696
[10]
J. Núñez, A. Bayés-Genís, E. Revuelta-López, et al.
Optimal carbohydrate antigen 125 cutpoint for identifying low-risk patients after admission for acute heart failure.
Rev Esp Cardiol., (2022), 75 pp. 316-324
[11]
J. Núñez, P. Llàcer, V. Bertomeu-González, et al.
Carbohydrate Antigen-125-Guided Therapy in Acute Heart Failure: CHANCE-HF: A Randomized Study.
JACC Heart Fail., (2016), 4 pp. 833-843
[12]
J. Núñez, P. Llàcer, S. García-Blas, et al.
CA125-Guided Diuretic Treatment Versus Usual Care in Patients With Acute Heart Failure and Renal Dysfunction.
Am J Med., (2020), 133 pp. 370-380
[13]
F. Antonini-Canterin, B.A. Popescu, A.C. Popescu, et al.
Heart failure in patients with aortic stenosis: clinical and prognostic significance of carbohydrate antigen 125 and brain natriuretic peptide measurement.
Int J Cardiol., (2008), 128 pp. 406-412
[14]
O. Husser, J. Núñez, E. Núñez, et al.
Tumor marker carbohydrate antigen 125 predicts adverse outcome after transcatheter aortic valve implantation.
JACC Cardiovasc Interv., (2013), 6 pp. 487-496
[15]
O. Husser, J. Núñez, C. Burgdorf, et al.
Improvement in Risk Stratification in Transcatheter Aortic Valve Implantation Using a Combination of the Tumor Marker CA125 and the Logistic EuroSCORE.
Rev Esp Cardiol., (2017), 70 pp. 186-193
[16]
T. Rheude, C. Pellegrini, H. Schmid, et al.
Comparison of Carbohydrate Antigen 125 and N-Terminal Pro-Brain Natriuretic Peptide for Risk Prediction After Transcatheter Aortic Valve Implantation.
Am J Cardiol., (2018), 121 pp. 461-468
[17]
D.M. Shahian, J.P. Jacobs, V. Badhwar, et al.
The Society of Thoracic Surgeons 2018 Adult Cardiac Surgery Risk Models: Part 1—Background, Design Considerations, and Model Development.
Ann Thorac Surg., (2018), 105 pp. 1411-1418
[18]
S.A.M. Nashef, F. Roques, L.D. Sharples, et al.
EuroSCORE II. Eur J Cardiothorac Surg, (2012), 41 pp. 734-745
[19]
L.P. Fried, C.M. Tangen, J. Walston, et al.
Frailty in older adults: evidence for a phenotype.
J Gerontol A Biol Sci Med Sci., (2001), 56 pp. M146-M156
[20]
K. Rockwood, X. Song, C. MacKnight, et al.
A global clinical measure of fitness and frailty in elderly people.
CMAJ., (2005), 173 pp. 489-495
[21]
C.P. Green, C.B. Porter, D.R. Bresnahan, J.A. Spertus.
Development and evaluation of the Kansas City Cardiomyopathy Questionnaire: a new health status measure for heart failure.
J Am Coll Cardiol., (2000), 35 pp. 1245-1255
[22]
M.R. Reynolds, E.A. Magnuson, K. Wang, et al.
Health-Related Quality of Life After Transcatheter or Surgical Aortic Valve Replacement in High-Risk Patients With Severe Aortic Stenosis.
J Am Coll Cardiol., (2012), 60 pp. 548-558
[23]
J. Spertus, E. Peterson, M.W. Conard, et al.
Monitoring clinical changes in patients with heart failure: a comparison of methods.
Am Heart J., (2005), 150 pp. 707-715
[24]
S.V. Arnold, J.A. Spertus, Y. Lei, et al.
How to Define a Poor Outcome After Transcatheter Aortic Valve Replacement.
Circ Cardiovasc Qual Outcomes., (2013), 6 pp. 591-597
[25]
S.V. Arnold, J. Afilalo, J.A. Spertus, et al.
Prediction of Poor Outcome After Transcatheter Aortic Valve Replacement.
J Am Coll Cardiol., (2016), 68 pp. 1868-1877
[26]
R. Puri, B. Iung, D.J. Cohen, J. Rodés-Cabau.
TAVI or No TAVI: identifying patients unlikely to benefit from transcatheter aortic valve implantation.
Eur Heart J., (2016), 37 pp. 2217-2225
[27]
P. Lantelme, H. Eltchaninoff, M. Rabilloud, et al.
Development of a Risk Score Based on Aortic Calcification to Predict 1-Year Mortality After Transcatheter Aortic Valve Replacement.
JACC Cardiovasc Imaging., (2019), 12 pp. 123-132
[28]
P. Lantelme, T. Lacour, A. Bisson, et al.
Futility Risk Model for Predicting Outcome After Transcatheter Aortic Valve Implantation.
Am J Cardiol., (2020), 130 pp. 100-107
[29]
O. Zusman, R. Kornowski, G. Witberg, et al.
Transcatheter Aortic Valve Implantation Futility Risk Model Development and Validation Among Treated Patients With Aortic Stenosis.
Am J Cardiol., (2017), 120 pp. 2241-2246
[30]
O. Zusman, M.I. Barbash, V. Guetta, et al.
Predicting the risk of late futile outcome after transcatheter aortic valve implantation.
Catheter Cardiovasc Interv., (2020), 96 pp. E695-E702
[31]
J. Núñez, G. Miñana, E. Núñez, F.J. Chorro, V. Bodí, J. Sanchis.
Clinical utility of antigen carbohydrate 125 in heart failure.
Heart Fail Rev., (2014), 19 pp. 575-584
[32]
J. Núñez, J. Sanchis, V. Bodí, et al.
Improvement in risk stratification with the combination of the tumour marker antigen carbohydrate 125 and brain natriuretic peptide in patients with acute heart failure.
Eur Heart J., (2010), 31 pp. 1752-1763
[33]
E.P. Cantey, K.Y. Chang, J.E.A. Blair, et al.
Impact of Loop Diuretic Use on Outcomes Following Transcatheter Aortic Valve Implantation.
Am J Cardiol., (2020), 131 pp. 67-73
[34]
P. Généreux, P. Pibarot, B. Redfors, et al.
Staging classification of aortic stenosis based on the extent of cardiac damage.
Eur Heart J., (2017), 38 pp. 3351-3358
[35]
P. Généreux, P. Pibarot, B. Redfors, et al.
Evolution and Prognostic Impact of Cardiac Damage After Aortic Valve Replacement.
J Am Coll Cardiol., (2022), 80 pp. 783-800
Copyright © 2024. Sociedad Española de Cardiología