Several clinical risk scores have been developed to identify patients at high risk of all-cause mortality despite implantation of an implantable cardioverter-defibrillator. We aimed to examine and compare the predictive capacity of 4 simple scoring systems (MADIT-II, FADES, PACE and SHOCKED) for predicting mortality after defibrillator implantation for primary prevention of sudden cardiac death in a Mediterranean country.
MethodsA multicenter retrospective study was performed in 15 Spanish hospitals. Consecutive patients referred for defibrillator implantation between January 2010 and December 2011 were included.
ResultsA total of 916 patients with ischemic and nonischemic heart disease were included (mean age, 62 ± 11 years, 81.4% male). Over 33.4 ± 12.9 months, 113 (12.3%) patients died (cardiovascular origin in 86 [9.4%] patients). At 12, 24, 36, and 48 months, mortality rates were 4.5%, 7.6%, 10.8%, and 12.3% respectively. All the risk scores showed a stepwise increase in the risk of death throughout the scoring system of each of the scores and all 4 scores identified patients at greater risk of mortality. The scores were significantly associated with all-cause mortality throughout the follow-up period. PACE displayed the lowest c-index value regardless of whether the population had heart disease of ischemic (c-statistic = 0.61) or nonischemic origin (c-statistic = 0.61), whereas MADIT-II (c-statistic = 0.67 and 0.65 in ischemic and nonischemic cardiomyopathy, respectively), SHOCKED (c-statistic = 0.68 and 0.66, respectively), and FADES (c-statistic = 0.66 and 0.60) provided similar c-statistic values (P ≥ .09).
ConclusionsIn this nontrial-based cohort of Mediterranean patients, the 4 evaluated risk scores showed a significant stepwise increase in the risk of death. Among the currently available risk scores, MADIT-II, FADES, and SHOCKED provide slightly better performance than PACE.
Keywords
Prevention of sudden cardiac death with an implantable cardioverter-defibrillator (ICD) improves survival in well-selected patients.1–3 Nowadays, the main indication for ICD implantation as well as ICD replacement is primary prevention.4,5 However, most patients who receive an ICD never undergo appropriate therapies from their device and remain at risk for complications, including inappropriate shocks and infections.5–7 Furthermore, patients with advanced comorbidities who receive ICDs may die of causes other than ventricular arrhythmia such as strokes, acute coronary syndromes, malignancy, or progressive heart failure (HF). Consequently, various clinical risk scores (RS) have been developed to identify patients who are at high risk of all-cause mortality despite ICD implantation and who are therefore very unlikely to benefit from ICD implantation. Some of the more widely known clinical scales include the MADIT-II,6 SHOCKED,8 FADES,9 and PACE scores.10 Nevertheless, these scales have never been compared in the same cohort let alone in a Mediterranean country, where outcomes have been reported to be different with a lower rate of mortality.11 Thus, there is currently an area of uncertainty regarding the clinical utility and reliability of the available risk models for predicting all-cause mortality in everyday patients implanted with an ICD for primary prevention of sudden cardiac death.
In the present multicenter retrospective nontrial-based study, we aimed to examine and compare the predictive capacity of 4 simple scoring systems to predict mortality after ICD implantation for primary prevention in a large cohort of consecutive patients.
METHODSThis multicenter retrospective study was performed in 15 centers in Spain. Although the design was retrospective, all professionals had collected the patients’ data prospectively. These data included demographic data, clinical information, procedure data, complications related to the procedure, and the subsequent follow-up. Information from each center was collected on a standardized form (an Access database was specifically designed for this purpose). All the variables were defined a priori. Appendix 1 of the supplementary material displays the definitions that were sent to the participants. To avoid bias, participants were asked to include all the consecutive patients referred for a primary prevention (ICD implantation from January 1, 2010 to December 31, 2011). Eligible patients were those who underwent an ICD implantation according to the current recommendations (Appendix 1 of the supplementary material) for ischemic and nonischemic cardiomyopathy.12
Exclusion criteria included patients with percutaneous coronary intervention or coronary artery bypass grafting within 3 months of ICD implantation, myocardial infarction within 40 days of ICD implantation, and those lacking data on vital status during follow-up (specifically, the percentage of patients lost during the follow-up was 1.4%). We also excluded patients with a history of hypertrophic cardiomyopathy, channelopathies, arrhythmogenic right ventricular dysplasia, and congenital heart disease.
Endpoint Definition and Follow-upThe primary endpoint for the present study was all-cause mortality during follow-up. The follow-up time for each individual patient ran from ICD implantation until either the date of death or the date of the last available follow-up. Data on vital status during follow-up was retrieved from local records or the primary health care records available in each center, and in some cases by contacting the patients by telephone.
Data on cause-specific mortality was also collected and classified into cardiovascular and noncardiovascular origin. Cardiovascular death was defined as sudden death or a death attributed to myocardial infarction, stroke, refractory HF, cerebrovascular accidents, burst aneurysms, or vasculorenal diseases (kidney failure in the absence of glomerulopathy or other parenchymatic alterations). Other causes of death were considered of noncardiovascular origin.
Sudden death was defined as the sudden, unexpected death of a patient who until then had been considered stable. Sudden deaths could be either witnessed (with or without documentation of arrhythmia) or unwitnessed (if the patient had been seen within the 24hours preceding death but had shown no premonitory HF, myocardial infarction, or other clear cause of death). Refractory HF was defined as death with decompensated HF that failed to respond to treatment in the absence of any other cause of death. Acute myocardial infarction was defined as an infarct that caused electrical or mechanical complications leading to early death.
Statistical AnalysisData are presented as mean ± standard deviation for quantitative data and as frequencies and percentages for qualitative data.
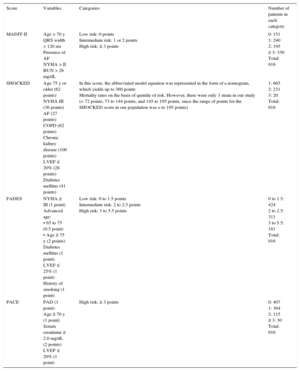
The 4 RSs were calculated for each patient from the corresponding scores for the prognostic variables they include (Table 1). The components of each of the 4 RSs studied were recorded at hospital admission for ICD implantation.
Individual Prognostic Variables Involve the Four Risk Scores Studied and the Number of Patients Belonging to Each Category in the Present Study
| Score | Variables | Categories | Number of patients in each category |
|---|---|---|---|
| MADIT-II | Age > 70 y QRS width > 120 ms Presence of AF NYHA > II BUN > 26 mg/dL | Low risk: 0 points Intermediate risk: 1 or 2 points High risk: ≥ 3 points | 0: 151 1: 240 2: 195 ≥ 3: 330 Total: 916 |
| SHOCKED | Age 75 y or older (62 points) NYHA III (36 points) AF (27 points) COPD (62 points) Chronic kidney disease (100 points) LVEF ≤ 20% (28 points) Diabetes mellitus (41 points) | In this score, the abbreviated model equation was represented in the form of a nomogram, which yields up to 360 points Mortality rates on the basis of quintile of risk. However, there were only 3 strata in our study (< 72 points; 73 to 144 points, and 145 to 195 points, since the range of points for the SHOCKED score in our population was o to 195 points) | 1: 665 2: 231 3: 20 Total: 916 |
| FADES | NYHA ≥ III (1 point) Advanced age: • 65 to 75 (0.5 point) • Age ≥ 75 y (2 points) Diabetes mellitus (1 point) LVEF ≤ 25% (1 point) History of smoking (1 point) | Low risk: 0 to 1.5 points Intermediate risk: 2 to 2.5 points High risk: 3 to 5.5 points | 0 to 1.5: 424 2 to 2.5: 311 3 to 5.5: 181 Total: 916 |
| PACE | PAD (1 point) Age ≥ 70 y (1 point) Serum creatinine ≥ 2.0 mg/dL (2 points) LVEF ≤ 20% (1 point) | High risk: ≥ 3 points | 0: 407 1: 364 2: 115 ≥ 3: 30 Total: 916 |
AF, atrial fibrillation; BUN, blood urea nitrogen; COPD, chronic obstructive pulmonary disease; LVEF, left ventricular ejection fraction; NYHA, New York Heart Association; PAD, peripheral arterial disease.
Risk categories for each score were established based on previously published studies.6,8–10 Thus, the MADIT-II score was categorized into 4 groups: 0, 1, 2 and ≥ 3 points. The FADES score was categorized into 3 risk groups: 0.0 to 1.5 points, 2.0 to 2.5 points, and ≥ 3.0 points. Similarly, the PACE score was divided into 5 categories; 0, 1, 2, 3 or ≥ 4 points. Finally, although the SHOCKED classification system was originally based on quintiles of risk (0 to 360 points),8 there were only 3 strata in our study (< 72 points, 73 to 144 points, and 145 to 195 points; the range of points for the SHOCKED score in our study was 0 to 195 points).
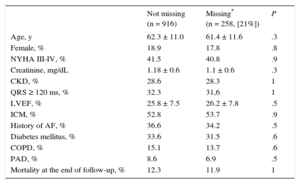
To assess the impact of missing data, we conducted a missing value analysis using Little's MCAR test to determine whether values were missing completely at random.
Kaplan-Meier curves were plotted to assess the survival of patients according to their death risk estimated by the RSs under study. Log rank tests were used to compare the survival distributions of the samples.
Cox proportional hazard regression models were used to model long-term mortality as a function of the RSs. The category of reference in each of the 4 scores corresponded to that with the lowest score (0 for MADIT-II and PACE, < 1.5 for FADES, and < 73 points for SHOCKED). Good prediction was determined by discrimination and calibration (performance measures). The Grønnesby and Borgan goodness-of-fit test13 was used to calculate a chi-square value (calibration describes how closely the predicted probabilities agree numerically with the actual outcomes). This test is based on martingale residuals. The idea of this test is to divide the observations into groups based on their estimated RSs and compare the observed and the model-based expected number of events within RS groups. A model is well calibrated when predicted and observed values are in accordance with any reasonable grouping under observation (no significant differences [P-value > .05; the higher the P-value, the better the calibration] in Grønnesby and Borgan's goodness-of-fit test).
Discrimination is the ability of the model to correctly classify patients into high vs low risk. To assess this, we computed the c-statistic from the Cox models. The c-statistic values computed from the Cox models were compared using the Hanley-McNeil method.14
All comparisons were 2 sided. A P value < .05 was considered statistically significant. Analyses were performed using SPSS statistical software v. 19 plus STATA 13.0.
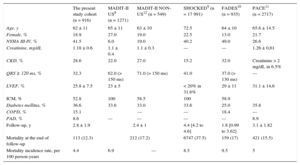
RESULTSOverall, 916 patients with ischemic and nonischemic heart disease underwent ICD implantation for primary prevention. The baseline characteristics of the population are summarized in Table 2. In our cohort, most of the patients (mean age, 62.3 ± 11.0 years) were male (81.4%), and mean left ventricular ejection fraction (LVEF) was 25.8 ± 7.5. Beta-blockers were used by 86.7% of the patients and angiotensin converting-enzyme inhibitors or angiotensin receptor blockers by 89.4%. In 6 patients (0.65%), data on vital status during follow-up was retrieved by telephone contact; in the remaining patients, information was retrieved from local records. Risk scores could not be calculated in 258 (21%) patients (out of the total sample; n = 1174) due to missing variables. These patients were therefore excluded from the main analyses. Little's test confirmed that those values were missing completely at random (Table 3).
Baseline Characteristics of the Present Study Population and of the Risk Score-derived Cohorts Under Study
| The present study cohort (n = 916) | MADIT-II US8 (n = 1271) | MADIT-II NON-US12 (n = 549) | SHOCKED9 (n = 17 991) | FADES10 (n = 935) | PACE11 (n = 2717) | |
|---|---|---|---|---|---|---|
| Age, y | 62 ± 11 | 65 ± 11 | 63 ± 10 | 72.5 | 64 ± 10 | 65.6 ± 14.5 |
| Female, % | 18.9 | 27.0 | 19.0 | 22.5 | 13.0 | 21.7 |
| NYHA III-IV, % | 41.5 | 6.0 | 19.0 | 40.2 | 49.0 | 26.6 |
| Creatinine, mg/dL | 1.18 ± 0.6 | 1.1 ± 0.4 | 1.1 ± 0.3 | --- | --- | 1.26 ± 0,61 |
| CKD, % | 28.6 | 22.0 | 27.0 | 15.2 | 32.0 | Creatinine > 2 mg/dL in 6.5% |
| QRS ≥ 120 ms, % | 32.3 | 62.0 (> 150 ms) | 71.0 (> 150 ms) | 41.0 | 37.0 (> 130 ms) | --- |
| LVEF, % | 25.8 ± 7.5 | 23 ± 5 | < 20% in 31.6% | 29 ± 11 | 31.1 ± 14,6 | |
| ICM, % | 52.8 | 100 | 58.5 | 100 | 58.9 | |
| Diabetes mellitus, % | 36.6 | 33.6 | 33.0 | 33.6 | 25.0 | 35.8 |
| COPD, % | 15.1 | --- | --- | 18.4 | --- | |
| PAD, % | 8.6 | --- | --- | --- | --- | 8.9 |
| Follow-up, y | 2.8 ± 1.9 | 2.4 ± 1 | 4.4 [4.2 to 4.6] | 1.8 [0.99 to 3.62] | 3.1 ± 1.82 | |
| Mortality at the end of follow-up | 113 (12.3) | 212 (17.2) | 6747 (37.5) | 159 (17) | 421 (15.5) | |
| Mortality incidence rate, per 100 person-years | 4.4 | 6.9 | --- | 8.5 | 9.5 | 5 |
CKD, chronic kidney disease; COPD, chronic obstructive pulmonary disease; ICM, ischemic cardiomyopathy; LVEF, left ventricular ejection fraction; NYHA, New York Heart Association; PAD: peripheral arterial disease.
Unless otherwise indicated, data are expressed as No. (%), mean ± standard deviation or median [interquartile range].
Differences in Baseline and Admission Data Between the Population With and Without Missing Data
| Not missing (n = 916) | Missing* (n = 258, [21%]) | P | |
|---|---|---|---|
| Age, y | 62.3 ± 11.0 | 61.4 ± 11.6 | .3 |
| Female, % | 18.9 | 17.8 | .8 |
| NYHA III-IV, % | 41.5 | 40.8 | .9 |
| Creatinine, mg/dL | 1.18 ± 0.6 | 1.1 ± 0.6 | .3 |
| CKD, % | 28.6 | 28.3 | 1 |
| QRS ≥ 120 ms, % | 32.3 | 31,6 | 1 |
| LVEF, % | 25.8 ± 7.5 | 26.2 ± 7.8 | .5 |
| ICM, % | 52.8 | 53.7 | .9 |
| History of AF, % | 36.6 | 34.2 | .5 |
| Diabetes mellitus, % | 33.6 | 31.5 | .6 |
| COPD, % | 15.1 | 13.7 | .6 |
| PAD, % | 8.6 | 6.9 | .5 |
| Mortality at the end of follow-up, % | 12.3 | 11.9 | 1 |
AF, atrial fibrillation; CKD, chronic kidney disease; COPD, chronic obstructive pulmonary disease; ICM, ischemic cardiomyopathy; LVEF, left ventricular ejection fraction; NYHA, New York Heart Association; PAD, peripheral arterial disease.
In addition, baseline differences among the distinct populations (the present cohort, the MADIT-II United States and non-United States populations, the SHOCKED, FADES and PACE populations) are also shown in Table 2. Briefly, our sample was the youngest out of the 5 series but had the second highest number of patients in New York Heart Association functional class III-IV after the FADES population. The same occurred with the rate of chronic kidney disease. Finally, it had the second largest number of patients with a history of atrial fibrillation and diabetes mellitus.
During the 33.4 ± 12.9 months of follow-up, 113 (12.3%) patients died and mortality was of cardiovascular cause in 86 (9.4%) patients. At 12, 24, 36, and 48 months, mortality rates were 4.5%, 7.6%, 10.8%, and 12.3%, respectively.
A total of 247 (27%) patients had appropriate intervention of the ICD due to at least 1 episode of ventricular tachycardia or ventricular fibrillation (antitachycardia pacing in 101 patients, high-energy shock in 71 patients, and antitachycardia pacing plus high-energy shock in the remaining 86 patients). A total of 104 (8.85%) patients received inappropriate ICD shocks mainly due to atrial arrhythmias (n = 80; 76.9%).
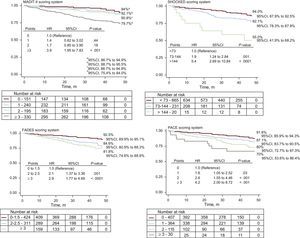
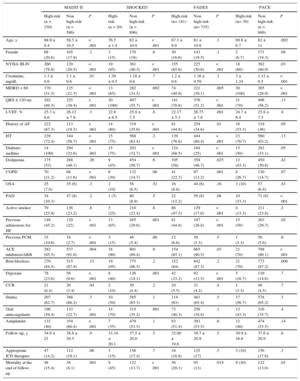
The mean MADIT-II, SHOCKED, PACE and FADES scores were 1.96 ± 1.3 points, 54.8 ± 41.3 points, 0.76 ± 0.8 points, and 1.8 ± 1.0 points, respectively. All the RSs showed a stepwise increase in the risk of death throughout the scoring system of each of the 4 scores under study (Figure). Moreover, as also shown in Figure, the 4 RSs satisfactorily discriminated those patients belonging to the high-risk categories and all except MADIT-II identified those categorized as intermediate risk. The demographic characteristics and outcomes in high-risk patients vs non high-risk patients according to the 4 RSs are shown in Table 4.

Demographics Characteristics and Outcomes in High-risk Patients vs Non High-risk Patients According to the Four Risk Scores Evaluated
| MADIT-II | SHOCKED | FADES | PACE | |||||||||
|---|---|---|---|---|---|---|---|---|---|---|---|---|
| High-risk (n = 330) | Non high-risk (n = 586) | P | High-risk (n = 20) | Non high-risk (n = 896) | P | High-risk (n= 181) | Non high-risk (n= 735) | P | High-risk (n= 30) | Non high-risk (n = 886) | P | |
| Age, y | 68.9 ± 8.4 | 58.5 ± 10.5 | < .001 | 76.5 ± 1.4 | 62 ± 10.9 | < .001 | 67.3 ± 9.9 | 61 ± 10.9 | .3 | 69.8 ± 6.7 | 62 ± 11 | .002 |
| Female | 68 (20.6) | 105 (17.9) | .3 | 3 (15) | 170 (19) | .6 | 30 (16.6) | 143 (19.5) | .3 | 2 (6.7) | 171 (19.3) | .08 |
| NYHA III-IV | 260 (78.8) | 120 (20.5) | < .001 | 19 (95) | 361 (40.3) | < .001 | 155 (85.6) | 225 (30.6) | < .001 | 18 (60) | 362 (40.9) | .03 |
| Creatinine, mg/dL | 1.3 ± 0.6 | 1.1 ± 0.6 | .01 | 1.39 ± 0.5 | 1.18 ± 0.6 | .7 | 1.2 ± 0.6 | 1.16 ± 0.59 | .3 | 3 ± 1.24 | 1.12 ± 0.5 | < .001 |
| MDRD < 60 | 170 (51.5) | 125 (21.3) | < .001 | 13 (65) | 282 (31.5) | .002 | 74 (40.9) | 221 (30.1) | .005 | 30 (100) | 265 (29.9) | < .001 |
| QRS ≥ 120 ms | 292 (89.3) | 225 (38.4) | < .001 | 20 (100) | 497 (55.7) | < .001 | 141 (78.8) | 376 (51.2) | < .001 | 21 (70) | 496 (56.2) | .13 |
| LVEF, % | 25.3 ± 6.6 | 26.12 ± 7.9 | .3 | 22.8 ± 6.5 | 25.9 ± 7.5 | .8 | 22.17 ± 5.3 | 26.75 ± 7.6 | .001 | 24.7 ± 6.4 | 25.8 ± 7.5 | .8 |
| History of AF | 222 (67.3) | 113 (19.3) | < .001 | 14 (80) | 319 (35.6) | < .001 | 81 (44.8) | 254 (34.6) | .01 | 16 (53.3) | 319 (36) | .05 |
| HT | 239 (72.4) | 344 (58.7) | < .001 | 15 (75) | 568 (63.4) | .2 | 139 (76.8) | 444 (60.4) | < .001 | 23 (76.7) | 560 (63.2) | .13 |
| Diabetes mellitus | 14 (100) | 294 (32.6) | < .001 | 15 (75) | 293 (32.7) | < .001 | 124 (68.5) | 184 (25) | < .001 | 15 (50) | 293 (33.1) | .05 |
| Dislipemia | 175 (53) | 288 (49.1) | .26 | 9 (45) | 454 (50.7) | .6 | 105 (58) | 358 (48.7) | .025 | 13 (43.3) | 450 (50.8) | .42 |
| COPD | 70 (21.2) | 68 (11.6) | < .001 | 6 (30) | 132 (14.7) | .06 | 41 (22.7) | 97 (13.2) | .001 | 8 (26.7) | 130 (14.7) | .07 |
| OSA | 25 (7.6) | 35 (6) | .3 | 2 (10) | 58 (6.5) | .52 | 16 (8.8) | 44 (6) | .16 | 3 (10) | 57 (6.4) | .43 |
| PAD | 34 (10.3) | 47 (8) | .2 | 1 (5) | 80 (8.9) | .5 | 22 (12.2) | 59 (8) | .08 | 10 (33.3) | 71 (8) | < .001 |
| Active smoker | 79 (23.9) | 136 (23.2) | .8 | 5 (25) | 210 (23.4) | .8 | 86 (47.5) | 129 (17.6) | < .001 | 4 (13.3) | 211 (23.8) | .2 |
| Previous admissions for HF | 149 (45.2) | 129 (22) | < .001 | 13 (65) | 265 (29.6) | .001 | 81 (44.8) | 197 (26.8) | < .001 | 15 (50) | 263 (29.7) | .02 |
| Previous PCM | 35 (10.6) | 16 (2.7) | < .001 | 3 (15) | 48 (5.4) | .06 | 12 (6.6) | 39 (5.3) | .5 | 1 (3.3) | 50 (5.6) | .6 |
| ACE inhibitors/ARB | 282 (85.5) | 537 (91.6) | .004 | 18 (90) | 801 (89.4) | .9 | 154 (85.1) | 665 (90.5) | .03 | 21 (70) | 798 (90.1) | < .001 |
| Beta-blockers | 279 (84.5) | 515 (87.9) | .15 | 19 (95) | 775 (86.5) | .2 | 152 (84) | 642 (87.3) | .2 | 21 (70) | 773 (87.2) | .006 |
| Digoxine | 78 (23.6) | 56 (9.6) | < .001 | 8 (40) | 126 (14.1) | .001 | 42 (23.2) | 92 (12.5) | < .001 | 5 (16.7) | 129 (14.6) | .7 |
| CCB | 21 (6.4) | 20 (3.4) | .04 | 2 (10) | 39 (4.4) | .2 | 10 (5.5) | 31 (4.2) | .4 | 1 (3.3) | 40 (4.5) | .7 |
| Statins | 207 (62.7) | 388 (66.2) | .3 | 10 (50) | 585 (65.3) | .1 | 114 (63) | 481 (65.4) | .5 | 17 (56.7) | 578 (65.2) | .3 |
| Oral anticoagulants | 196 (59.4) | 133 (22.7) | < .001 | 14 (70) | 315 (35.2) | .001 | 73 (40.3) | 256 (34.8) | .1 | 13 (43.3) | 316 (35.7) | .4 |
| Antiplatelet | 132 (40) | 354 (60.4) | < .001 | 7 (35) | 479 (53.5) | .1 | 93 (51.4) | 393 (53.5) | .6 | 12 (40) | 474 (53.5) | .14 |
| Follow-up, y | 34.9 ± 21 | 38.8 ± 20.5 | .9 | 33.34 ± 20.1 | 37.5 ± 20.8 | .5 | 32.09 ± 19.6 | 38.7 ± 20.9 | .5 | 30.9 ± 16.8 | 37.6 ± 20.9 | .6 |
| Appropriate ICD therapies | 47 (14.2) | 112 (19.1) | .06 | 3 (15) | 156 (17.4) | .7 | 34 (18.8) | 125 (17) | .5 | 3 (10) | 156 (17.6) | .3 |
| Mortality at the end of follow-up | 48 (15.4) | 38 (8.1) | .001 | 9 (45) | 122 (13.7) | < .001 | 36 (20.1) | 95 (13) | .014 | 9 (30) | 122 (13.8) | .01 |
ACE, angiotensin-converting enzyme; AF, atrial fibrillation; ARB, angiotensin receptor blockers; CCB, calcium channel blockers; COPD, chronic obstructive pulmonary disease; HF, heart failure; HT, hypertension; ICD, implantable cardioverter defibrillator; LVEF, left ventricle ejection fraction; MDRD, modification of diet in renal disease; NYHA: New York Heart Association; OSA, obstructive sleep apnea; PAD, peripheral arterial disease; PCM, pacemaker.
Data are expressed as No. (%) or mean ± standard deviation.
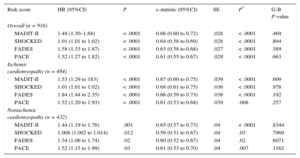
All the RSs, as continuous variables, were significantly associated with all-cause mortality throughout follow-up period (Table 5). The discriminatory abilities of the 4 scores are represented in Table 5. All of them exhibited a modest c-index value, but performed better than chance at predicting death. The PACE score displayed the lowest c-index value (0.611) regardless of whether the population had ischemic (c-index = 0.61) or nonischemic heart disease (c-index = 0.61), whereas MADIT-II (c-index = 0.66 overall; c-index = 0,67 and 0.65 in ischemic in nonischemic respectively), SHOCKED (c-index = 0.64 overall; c-index = 0.68 and c-index = 0.59), and FADES (c-index = 0.63 overall; c-index = 0.66 and c-index = 0.60) provided a similar c-index (P ≥ .09), without regard to whether the population had ischemic or nonischemic heart disease.
Discrimination and Calibration Capacity of Each of the Four Risk Scores Under Study
| Risk score | HR (95%CI) | P | c-statistic (95%CI) | SE | P* | G-B P-value |
|---|---|---|---|---|---|---|
| Overall (n = 916) | ||||||
| MADIT-II | 1.48 (1.30–1.68) | < .0001 | 0.66 (0.60 to 0.72) | .028 | < .0001 | .469 |
| SHOCKED | 1.01 (1.01 to 1.02) | < .0001 | 0.64 (0.58 to 0.69) | .028 | < .0001 | .894 |
| FADES | 1.58 (1.33 to 1.87) | < .0001 | 0.63 (0.58 to 0.68) | .027 | < .0001 | .389 |
| PACE | 1.52 (1.27 to 1.82) | < .0001 | 0.61 (0.55 to 0.67) | .029 | < .0001 | .663 |
| Ischemic cardiomyopathy (n = 484) | ||||||
| MADIT-II | 1.53 (1.29 to 183) | < .0001 | 0.67 (0.60 to 0.75) | .039 | < .0001 | .609 |
| SHOCKED | 1.01 (1.01 to 1.02) | < .0001 | 0.68 (0.61 to 0.75) | .036 | < .0001 | .978 |
| FADES | 1.84 (1.44 to 2.35) | < .0001 | 0.66 (0.59 to 0.73) | .036 | < .0001 | .192 |
| PACE | 1.52 (1.20 to 1.93) | < .0001 | 0.61 (0.53 to 0.68) | .039 | .008 | .257 |
| Nonischemic cardiomyopathy (n = 432) | ||||||
| MADIT-II | 1.44 (1.19 to 1.76) | .001 | 0.65 (0.57 to 0.73) | .04 | < .0001 | .8344 |
| SHOCKED | 1.008 (1.002 to 1.014) | .012 | 0.59 (0.51 to 0.67) | .04 | .03 | .7969 |
| FADES | 1.34 (1.06 to 1.74) | .02 | 0.60 (0.52 to 0.67) | .04 | .02 | .6071 |
| PACE | 1.52 (1.15 to 1.99) | .03 | 0.61 (0.53 to 0.70) | .04 | .007 | .1162 |
95%CI, 95% confidence interval; G-B, Grønnesby and Borgan test; HR, hazard ratio; SE, standardized error;
P-values of all the Hanly-McNeil tests undertaken were ≥ 0.16 for the comparison of each pair-wise of c-statistics.
The calibration of all the scores was acceptable as all the P value of the undertaking Grønnesby and Borgan test were ≥ .19.
DISCUSSIONIn this large, nontrial-based cohort of Mediterranean patients with ICD for primary prevention of sudden cardiac death, the clinical RSs generated from post hoc analysis of the MADIT-II,6 SHOCKED,8 FADES9 and PACE10 trials showed a significant stepwise increase in the risk of death throughout their scoring system. Moreover, the 4 RSs acceptably identified the high-risk group (of all-cause death) throughout the follow-up period as seen by the significant association between the scores and mortality in terms of hazard ratio. Additionally, the MADIT-II, FADES, and SHOCKED scores showed an acceptable discriminatory ability in terms of c-statistic values, the MADIT-II being the best score in patients both patients with or without ischemic myocardiopathy, whereas the PACE score exhibited a slightly poorer discriminatory ability in both groups. The estimated probability of dying during follow-up was well calibrated in this cohort.
To the best of our knowledge, this is the first study comparing different contemporary RSs for predicting all-cause mortality in patients undergoing ICD for a primary prevention indication. Few studies to date have tested the external validity of the MADIT-II score in an independent dataset of patients.15,16 However, up until now, no study has compared these 4 RS models in a vis-to-vis fashion in order to identify the most accurate score system for refining risk prediction in the setting of ICD implantation.
Motivation of the Present StudyMost randomized clinical trials have demonstrated an ICD-associated mortality reduction in patients with impaired LVEF.15–18 Additionally, there have been multiple attempts to refine risk stratification for optimal use of ICD therapy based on clinical algorithms. Nevertheless, comparison between these different models has never been performed in the same cohort. Moreover, they have never been validated in a Mediterranean country, where previous studies have shown regional differences. In fact, in the MADIT-II trial, “non-United States patients” displayed significant differences in baseline characteristics from “United States-patients”, including a higher frequency of left bundle branch block, a more advanced HF functional class > 3 months prior to enrolment, and larger baseline cardiac volumes.11 Moreover, during follow-up, subgroup analysis showed a more pronounced effect of ICD with cardiac resynchronization therapy among women in the United States group, including a significant 71% (P = .02) reduction in the risk of death, whereas ICD with cardiac resynchronization therapy therapy was associated with a significant clinical benefit in men only in the non-United States group. Importantly, the Mediterranean diet, highly prevalent in the Spanish population if compared with the United States population, has been shown to reduce not only cardiovascular risk factors but also the incidence of stroke,19 which could lead to different outcomes when compared with the United States population.
Survival Rate in High-risk PatientsAs we postulated, the mortality incidence rate (per 100 person-years) in the present Mediterranean cohort is the lowest out of the several populations herein evaluated (Table 3). Moreover, differences were also found with regard to the mortality rate between the so-called high-risk categories (Table 4). In the MADIT-II6 study, patients belonging to the very high-risk category had a 2-year all-cause mortality rate of 50%. In our sample, patients who met the criterion for classification as high risk according to this model showed a 2-year all-cause mortality of 20%. In the SHOCKED model, the 20% of patients in the highest risk group had a 2-year mortality of almost 40%. The same was found in our group of patients classified as high risk according to this model (40%). In the original FADES study, for the previously defined risk groups, the cumulative incidence of death without prior ICD therapy was 16% after 3 years, and around 25% in the high risk category compared with the 46% found in our patients with 3 points of the proposed algorithm. Finally, the PACE model reported a 1-year all-cause mortality of 16.5% in their very high risk categories, which matched the 16.6% found here for those patients with ≥ 3 points.
Discriminatory AbilityThe 4 RS models successfully identified patients with higher mortality in a nontrial-based, primary-prevention ICD cohort, with the better c-index for predicting death in the overall population of 0.66 (95% confidence interval [95%CI], 0.60-0.72) corresponding to the MADIT-II score (c-index = 0.64; 95%CI, 0.58-0.69). In our sample, when analyzing the survival curves according to the punctuation system derived from the MADIT-II, SHOCKED and FADES scores, it can be inferred that the survival curves of each of the risk groups diverged promptly, pointing to a good prediction capacity of each of these systems in the classified patients according to the baseline death risk. However, the SHOCKED score system better identified the death risk in those patients who were already classified as high risk (hazard ratio = 5.4; 95%CI, 2.69-10.84; P < .0001) (Figure) and MADIT-II was the poorest of the 4 RSs in categorizing the subgroup of patients at intermediate risk.
Overall, the reason why the MADIT-II, SHOCKED and FADES scores outperformed the PACE score could be explained by the composition and the weighting of the individual variables included in each of the aforementioned RSs. The latter scheme is composed of 4 clinical variables, 3 of them (age, renal function and LVEF) are included in the other 3 algorithms, but it incorporates a fourth variable (peripheral arterial disease) not taken into account in the previous schemes. Another difference could arise from the age cutoff selected. Whereas PACE differentiates exclusively between patients aged ≥ 70 years, the SHOCKED and the FADES models discriminate between intervals (Table 1).
Clinical RelevanceThese findings have important implications for health care systems and patients. They offer quantitative tools and are user-friendly when assessing mortality risk in a broader spectrum of patients with acceptable discriminatory abilities. They provide a practical and easy method for the determination of patient-specific survival probabilities at the bedside. It should be noted that although these 4 RSs somehow differ in the population studied and in the validation methods, they share the same endpoint and so far they have not been examined in an independent dataset of patients. Additionally, this study provides the rates of events in a contemporary sample of patients from a Mediterranean country.
Therefore, it is our opinion that the present study offers additional information when counselling patients who are eligible for primary prevention ICDs, that is, the decision to implant an ICD in patients with multiple comorbidities should be balanced against the considerable risk of death derived, among other sources, from the comorbidities reflected in the scores discussed herein. Nevertheless, some differences in mortality rates were found in our study and the MADIT-II population, which is why, although it may offer guidance in individual high-risk cases, the decision to implant an ICD or not should not be based solely on it. Barsheshet et al18 suggested that patients categorized as high risk (per the MADIT-II RS) might not receive a survival benefit from ICD implantation. However, based on the results of the present study, patient exclusion based exclusively on a high score is not categorically generalizable.
LimitationsImportantly, the aim of our study was to assess the risk for all-cause mortality in patients undergoing primary prevention ICD implantation. Although this was not a randomized clinical trial with a placebo group for comparison, this analysis included a very large number of patients, which allowed us to closely analyze a larger number of clinical factors in predicting poor survival early after ICD implantation.
Several limitations in this study deserve comment. First, its retrospective design increased the risk for bias and confounding. However, consecutive patients who underwent primary prevention ICD implantation at our centers were included and device follow-up was performed according to a uniform protocol.
In our study, we found no statistically significant differences in the c-statistic values between the studied RS, which may be attributed to the relatively small sample size, lack of homogeneity and/or limited number of episodes recorded during follow-up. Hence, these conclusions should be interpreted as a hypothesis and will deserve further evaluation in large clinical studies.
The MADIT-II and FADES RSs were developed to stratify mortality risk in postmyocardial infarction patients. Although our results were validated in both subgroups, caution should be exercised when applying these RSs to patients with ICD with nonischemic cardiomyopathy. Importantly, as mentioned above, patients with a history of hypertrophic cardiomyopathy, channelopathies and arrhythmogenic right ventricular dysplasia were excluded from our analysis and therefore these results should not be generalized to those subgroups.
Also importantly, these scores were constructed to predict mortality and not ICD therapies, the most important competing risk for a beneficial effect of device therapy. Likewise, ICD therapies are probably not triggered by factors used in the scores studied here but by the underlying cardiomyopathy (ie, scar, potential of ischemia).
We included only variables measured at the time of ICD implantation and, as a consequence, have not accounted for risk factors that could have developed over time; however, the goal of risk assessment has been to assess prognosis on the basis of baseline parameters.
Finally, RSs could not be calculated in 258 patients from our initial cohort because of the absence of data at the time of implantation. Nonetheless, although this fact could theoretically result in selection bias, missing data analysis has shown that values were missing completely at random.
CONCLUSIONSIn this large, nontrial-based cohort of Mediterranean patients with primary prevention ICD implantation, the 4 RSs evaluated showed a significant stepwise increase in the risk of death. Moreover, among the currently available RS for predicting all-cause death, the MADIT-II, FADES, and SHOCKED scores provide slightly better performance than the PACE score.
CONFLICTS OF INTERESTE. Abu-Assi and M.A. Arias are Associate Editors of Revista Española de Cardiología.
– Most ICD recipients are subjected to the risks and complications of ICD implantation without ever requiring appropriate therapy for ventricular arrhythmias. Consequently, clinical risk scores have been developed for the identification of patients at very low risk of ICD intervention or, on the contrary, very high risk of all-cause mortality who are therefore very unlikely to benefit from ICD implantation. Systematic comparison between scores is lacking, and to date, only the MADIT score has been validated in an external cohort.
WHAT DOES THIS STUDY ADD?– A vis-a-vis comparison between the 4 main risk scores was performed in an external cohort of patients. All scores yielded an acceptable discriminatory capability and correlated well with the incidence of mortality. For the first time, a Mediterranean cohort has been evaluated for this outcome and it exhibited the lowest mortality incidence of all the populations included. Subsequently, patient exclusion based on high scores is not completely generalizable, but may offer guidance in individual high-risk patients.
This work would not have been possible without the invaluable contributions of the physicians who took part in the study presented here. The large number of participants does not permit individual acknowledgments that we would like to give and that the participants well deserve. Finally, the authors acknowledge Dr. Jan Steffel for his assistance with reviewing and revising the present manuscript.
Luis González-Torres (Hospital Universitario Virgen Macarena, Seville); José Antonio Iglesias-Bravo (Hospital Fundación Jiménez Díaz, Madrid); Hugo Arguedas-Jiménez (Clínica Universidad de Navarra, Pamplona); Cristina González-Cambeiro and José Ramón González-Juanatey (Hospital Universitario Santiago de Compostela, Santiago de Compostela); Jesús Jiménez-López and Oscar Salvador-Montañés (Hospital Virgen de la Salud, Toledo); José Moreno-Arribas (Hospital Universitario San Juan, Sant Joan d’Alacant, Alicante); Agustín Fernández-Cisnal and Luis Tercedor-Sánchez (Hospital Virgen de las Nieves, Granada); Juan José Olalla Antolín (Hospital Marqués de Valdecilla, Santander); Ricardo Ruiz-Granell (Hospital Clínico Universitario de Valencia, Valencia); Larraitz-Gaztañaga and José Ormaetxe (Hospital Universitario de Basurto, Bilbao); Pilar Cabanas-Grandío and Enrique García (Hospital Universitario de Vigo, Vigo); José Olagüe de Ros (Hospital Universitario La Fe, Valencia) and Alonso Pedrote-Martínez (Hospital Virgen del Rocío, Seville).