Keywords
INTRODUCTION
As much as two thirds of over the 40 000 deaths caused by ischemic heart disease in Spain every year, occur before the patient reaches the hospital.1 Optimal primary prevention could prevent some of these deaths, since it would lower the incidence of ischemic heart disease which has stabilized over the past 15 years.2,3 Estimations of chronic diseases projected for the year 2020 indicate that ischemic heart disease will continue to be the first cause of death in developed countries, and the third cause in underdeveloped countries.4 In this context, all efforts aimed at improving prevention of coronary heart disease are justified.
Estimating the probability of developing a coronary event based on individual risk factors is a valuable tool for attaining this target. Coronary disease prevention based on total risk evaluation allows for a better decision-making than any other approach to isolated components.5 Risk factors do not show a homogeneous distribution and their effects are not identical in all populations.6-9 Particularly, paradoxical situations have been described in Southern Europe, where a low incidence of ischemic heart disease and of its associated mortality holds within a context of high prevalence of risk factors or saturated fats consumption.10-11
The Framingham cohort has contributed to clarify the causes of ischemic heart disease and other cardiovascular diseases.12 Its results have allowed to develop mathematical functions for measuring the individual risk of coronary events under existing risk factors.13-15 Coronary risk calculation based on the Framingham study is the procedure recommended nowadays.5,16-18 In Spain, predictive models with population data have not been developed yet. There is also evidence that Framingham equation overestimates coronary risk in some of the populations.3,19-23
As population cohort studies are unavailable, some techniques were proposed to calibrate the Framingham coronary hazard function adjusted to local prevalence of cardiovascular risk factors and coronary event incidence.19 A calibrated function for our environment was created with this approach. The good concordance between hard coronary events predicted (symptomatic AMI, fatal or non-fatal) with this calibration and the actual number was confirmed by the myocardial infarction population registry of Girona REGICOR (Registre Gironí del Cor).3,24
The aim of this study is to present tables of total coronary risk estimation for the following 10 years based on a calibrated Framingham function adapted to the Spanish population.
PATIENTS AND METHOD
The classical Framingham function includes all fatal or non-fatal coronary events, such as angina14,15 and asymptomatic Q-wave AMI detected by electrocardiography.25 There is also an adjusted equation for hard coronary events: symptomatic AMI, fatal or non fatal.3,19
The Framingham equation calibration for hard coronary events,19 the way it overestimates these events, and the advantages of calibration in our environment have already been described in detail.3 The Framingham function estimates the risk of coronary events to 10 years by comparison of risk of an evaluated individual with the population averages. Calculation is based on median age and risk factor prevalence considered for that population. The population average rate of events to 10 years is also included. In Spain, none of the results match those of the Framingham cohort. In the calibrated Framingham function, the average comparison element is replaced by a local element. To make this possible, a reliable estimation of local risk factor prevalence, as well as the local coronary event incidence rate considered, and the original equation coefficients, are needed. Calculation of the calibrated function is described in detail in the Appendix.
Tables with the general model of all the Framingham coronary events were calculated using the equation published in 1998 by Wilson et al,14 that follows the described calibration method.3,19 Wilson´s function included cHDL and degrees of hypertension based on systolic (SD) and diastolic (DBP) blood pressure. In our case, we used the risk factor prevalence and population data included in the REGICOR study.3,10 The hard event incidence rates were obtained from the REGICOR population registry.10 Since 1988, this registry investigates all suspected AMI cases in 6 districts of Girona, with a 35 to 74 year old population of around 200 000 inhabitants. As angina and silent AMI incidence rates for Girona are unknown, a Framingham similar proportion was assumed, and the hard event rate was proportionally increased. The following ratio was used:
H0(t)/FramAll / H0(t)/FramHard
where t is the follow-up time, 10 years in our case; H0(t)/FramAll is the coronary event rate including Framingham angina and silent AMI, and H0(t)/FramHard is the rate of symptomatic AMI, fatal or non-fatal. This quotient value is 1.400 for males and 1.910 for females. The hard event rate in males of Girona in the REGICOR registry (3.5%) is multiplied by 1.400 to obtain an estimated total coronary event rate (4.9%). This allows calculation of the following rate of population without events:
100-4.9%=95.1%
A similar procedure is used in females: the hard event rate (1.1%) is multiplied by its quotient (1.910) to obtain the estimated total coronary event rate (2.2%). The rate of female population without events is as follows:
100-2.2%=97.8%
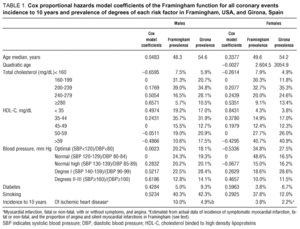
The tables are calculated for average HDL-C in 35 to 74 year old males (47.5 mg/dL) of Girona. As in most guidelines,5,16,17 there is a coded color for hazard intensities in the risk factor combinations for diabetic and non-diabetic males and females separately. A hazard value, rounded to the higher nearest integer, appears in every combination checkbox of the risk factor degrees described in Table 1.
RESULTS
The risk factor distributions for Girona and Framingham are shown in Table 1. Some categories of male and female risk factors are different in both distributions, and coronary event incidence rates also differ as for gender and between both regions.
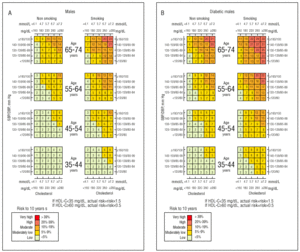
Figure 1A shows a table of risk factor combinations of AMI, fatal or non-fatal, fatal AMI with or without symptoms, and angina in males. Figure 1B corresponds to diabetic males. Figure 2A illustrates risk in females and Figure 2B corresponds to diabetic females.
Fig. 1. A: Risk of myocardial infarction, fatal or non-fatal, with or without symptoms, or angina, in non-diabetic males with different risk factor combinations and HDL-C 35-59 mg/dL. B: Risk in diabetic males. SBP indicates systolic blood pressure; DBP, diastolic blood pressure.
Fig. 2. A: Risk of AMI, fatal or non-fatal, with or without symptoms, or angina, in non-diabetic females with different risk factor combinations and HDL-C 35-59 mg/dL. B: Risk in diabetic females. SBP indicates systolic blood pressure; DBP, diastolic blood pressure.
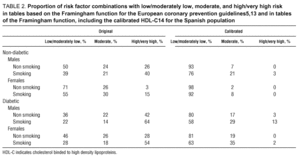
The resulting risk for HDL-C<35 mg/dL is approximately 50% higher than risk observed on the tables, whereas risk for HDL-C>59 mg/dL is approximately 50% lower. The risk factor combinations proportion that establishes a severe or very severe ischemic heart disease hazard (i.e., 19% risk to ten years) in the calibrated tables is 13 times less than in the original tables (Table 2). The proportion of factor combinations that lead from moderate to very high risk is 2.7 times lower. This result is very noticeable in non-diabetic males and females.
DISCUSSION
Some tables of total coronary risk, calibrated by including risk factor prevalence and estimated event rates in our environment, are presented for use in the Spanish population. The table values produce globally a percentage of risk factor combinations (checkboxes) with a moderate to very high total hazard that is 2.7 times less than in the original tables. In general, the resulting hazard for risk factor combinations is much lower.
Difficulties in extrapolating the Framingham function to certain low incidence regions have been described occasionally in the general population3,18-23,26,27 and in diabetics,28 although it matches reality in many parts of the world.29,30 The European coronary disease prevention guidelines expressly recommend that efforts are directed to adapt predictive functions to local requirements.5 This study follows such recommendation by applying a proven calibration method.3,19 Several approximations have been also used to adapt the equations.3,22 In the future, any other adaptations should include estimation of the maximum number of coronary events, and even of cardiovascular events. Anyway, predicting exclusively fatal or hard events,31 now that ischemic heart disease mortality is falling and acute coronary syndromes are treated earlier with less complications , would render a biased and confusing vision in clinical practice.
The only cohort study with over 20 years follow-up, including a masculine working population only, demonstrated that observed coronary events depending on the degree of exposure to risk factors were less than expected when the study was initiated in 1968.32 Corrections obtained in our study match this finding, although according to the Manresa study it is not possible to measure the difference between values observed and values expected due to risk factor prevalence when follow-up started.32
The authors of the Seven Countries and other previous studies, observed that smoking, systolic blood pressure, age and body mass index were the most important predictive variables for ischemic heart disease mortality to 6 years in Southern Europe (largest standarized coefficient in model), whereas cholesterol was not associated significantly with any coronary event risk.6,8
Coronary risk calculation allows to establish the prevention targets for each patient individually. The effect of demonstrating a lower estimation, as is the aim of this study, could influence decision-making in pharmacological management of hypercholesterolemia.33-35 The current coronary heart disease prevention guidelines indicate that pharmacological treatment should be initiated in patients with a minimum 20% age risk to 10 years or projected to 60 years, if after management with life style measures during 6 months, total cholesterol is not below 190 mg/dL, and LDL-C is not below 115 mg/dL,5 or 130 mg/dL in the Spanish recommendations.36 Pharmacological treatment for hypertension depends on the same degree of risk. Nevertheless, the following points explain why the present calibration should not be used as a justification for reducing the pharmacological treatment of hypertension: a) negative clinical consequences of hypertension are many (stroke, mainly), for a near 50% attributable risk)37, and b) hypertension rates in Spain are highly unknown and scarcely controlled, as has been confirmed repeatedly.10,38
Study characteristics and limitations
AMI incidence in Girona appears in the IBERICA (Investigación y Búsqueda Específica y Registro de Isquemia Coronaria Aguda) study39 as 15% below the Spanish average. External validation (applicability) of the function for other regions of Spain cannot be accepted without the necessary precautions.
The youngest 25 to 34 years old group has been eliminated from the tables, although it appears in the classical Framingham tables as the 30 years class center. This age group presents a very small number of AMI cases in our country, and accordingly, the estimators were unreliable. Risk in 65 to 74 year old females for all the risk factor combinations is practically identical than in 55 to 64 year old females. This result was obtained because the quadratic factor includes the hazards function for females, and could have a physiopathological explanation, given the higher life expectancy of women, and that ischemic heart disease increases after menopause, at around 55 years of age. The result is possibly affected by properties of the age variable coefficient for females, that was originally estimated for regions with high incidence of ischemic heart disease (Framingham). The difference between both age groups could be smaller in our environment.
The proposed correction, based on HDL-C plasma levels, simplifies the potential use of the tables. A checkbox will show a 50% increased risk if plasma levels are under 35 mg/dL, or half the risk if levels are above 59 mg/dL. The risk for individuals with 35 to 59 mg/dL plasma levels is indicated on each risk factor combination checkbox. At levels near 35 mg/dL, the risk is slightly higher (around 2%) and slightly lower at levels near 59 mg/dL (also 2%). The possibility of including the HDL-C effect in risk estimations is useful but only approximate. Nevertheless, many cases confirmed that deviations from the proposed rule rarely exceeded 3% in patients with levels below 35 mg/dL and above 60 mg/dL.
The main advantage of the Framingham equation published in 199814 is using its arterial hypertension criteria adaptation to the present criteria of the World Health Organization, categorized in 5 groups (optimal, normal, normal high, stage I and II to IV)40 and based on SBP and DBP values. To this regard, ischemic heart disease risks with optimal and normal blood pressure show practically no differences, as illustrated in the tables.
The tables presented are based on a calibration not validated with the population base procedure, as with hard events,3 or using any prospective procedure. The calibration procedure validity is reasonably guaranteed in itself.3,19
Our population data cannot confirm that silent AMI and angina proportions, over total coronary event incidence, are similar for Girona and Framingham. Any approximations should be conservative, as a higher proportion in Girona than in Framingham is improbable.
A limitation of these predictive functions is not including some risk factors recently described (particularly, C-reactive protein, but also homocisteine, (a) lipoprotein, Chlamydia pneumoniae antibodies or Cytomegalovirus, fibrinogen and other coagulation factors and inflammation markers).27 Another limitation is not including any risk factor control variables, such as antihypertensive therapy or treatment of hypercholesterolemia.
The calibrated Framingham function for our environment can be a reasonably valid tool for estimating more precisely the total coronary risk in primary prevention. It should be used with an appropriate validation, not hindering any progress in elaborating specific functions for Spain using representative population cohorts with a sufficiently long follow-up period.
ACKNOWLEDGMENT
This project was funded with the 99/226 grant of the Commission for Cultural, Educational and Scientific Exchange between the United States of America and Spain, and with the Fondo de Investigación Sanitaria FIS 93/0568, FIS 96/0026-01 and FIS 94/0539 grants. This project was partially funded with the CIRIT/2001 SGR 00408 grant of the Generalitat de Cataluña. R. Elosua was granted financial assistance by the Fullbright Program-Generalitat de Cataluña.
APPENDIX
Utilization of the predictive function is based on event probability calculation with the Cox proportional hazards method:
PXi(t)=1Sxi(t)=1e-[ H0(t)·e(Σ(ßixi)Σ(ßixm))]=1e-[In(S0(t))·e(Σ(ßixi)Σ(ßixm))]=1S0(t) e(Σ[ßixi[Σ[ßixm])
where Px i (t) is the coronary event probability in t time (10 years, in this case) for a patient with a group of risk factors xi, in an environment with an existing H0(t) baseline event cumulative rate during t time, and with a free of coronary events S0(t) baseline probability during t time; where Σ(ßi xm) is an average risk linear function of the group of xm values for each degree of every risk in the population; and Σ(ß ;i xi) is the linear function calculated with the group of xi values that represents each risk factor value in individua ls. In both linear functions, ßi are the Cox proportional hazards function coeffic ients for each degree of every risk considered, S#Xi(t) is the probability of no coronary events in a patient with a group of risk factors xi and the same conditions described; and e is the base of natural logarithms.
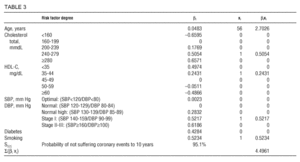
The estimation consists in calculating the Σ(ßi xi) summatory by replacing ßi with the model coefficients shown in Table 1, and xi with values of each risk factor of the patient, using «1» if the factor degree is present or «0» for the remaining degrees. As for age, xi is replaced by years of age, and diabetes and smoking are replaced by 0 or 1, depending on their presence or not.
For example, the value for a 56 year old non-diabetic smoking male with total cholesterol 256 mg/dL HDL-C 37 mg/dL, SBP of 146 mm Hg and DBP of 92 mm Hg, should be calculated as described in Table 3.
In the equation described above, H0(t) should be calculated as:
H0(t) = In(S0(t))
where S0(t) is the free of events probability (expressed from 0 to 1) in males of our environment during t time=10 years
H0(t) = ln(0,951) = 0,050
The difference between patient risk and average risk in the population of reference (Girona, in our case), is obtained subtracting the Σ(ßi xm) summatory corresponding to average in males (3.489) from the Σ(ßi xi) summatory corresponding to the patient (4.496):
PXi(t)=1Sxi(t)=1e-[In(0,951)· e(4,496-3,489)]=1-e[0,050·e0,986]=1 e-[0,050·2,681]=0,128=12,8%
The probability of developing a coronary event in our environment during the next 10 years for a male characterized as mentions above is 12.8%, very similar to the probability annotated in the corresponding checkbox of the risk tables presented (12%).
Correspondence: Dr. J. Marrugat.
Unitat de Lípids i Epidemiologia Cardiovascular. Institut Municipal
d'Investigació Mèdica (IMIM).
C/ Dr. Aiguader, 80. 08003 Barcelona. España.
E-mail: jmarrugat@imim.es
Received 30 December 2002.
Accepted for publication 17 January 2003.


