
Lipid control is insufficient in patients with coronary heart disease but this situation may be improving with the implementation of the latest clinical practice guidelines. The aim of this study was to analyze whether target values of low-density lipoprotein cholesterol are achieved and to identify associated factors and physicians’ attitudes to deficient control.
MethodsWe conducted a national, multicenter, prospective, observational study of 1103 patients with stable coronary heart disease, analyzing lipid values and a broad set of clinical variables. The statistical analysis involved a binary logistic regression model using backward stepwise elimination.
ResultsLow-density lipoprotein cholesterol was < 70 mg/dL in only 26% of patients, even though 95.3% were receiving cholesterol-lowering agents, 45% of which were high-intensity therapies. Independent predictors of low-density lipoprotein cholesterol < 70 mg/dL were diabetes mellitus, wholegrain bread, shorter history of dyslipidemia, and, especially, high-intensity cholesterol-lowering therapies. Physicians increased therapy in only 26% of poorly controlled patients. The main predictor of increased therapy was low-intensity baseline therapy (odds ratio=5.05; 95% confidence interval, 3.3-9.2). A more proactive approach was observed in older physicians (P=.019) and longer physician practice (P=.02).
ConclusionsDespite the new guidelines, only 26% of patients with coronary heart disease have adequate lipid control. In 70% of patients, physicians continue the same therapy, even though high-intensity cholesterol-lowering therapies are a key factor in good control.
Keywords
The degree of lipid control has been the subject of heated debate in the medical community in recent years and is the source of differences between the recommendations in the European Guidelines on cardiovasvular (CV) disease prevention in clinical practice1 and the ACC/AHA guideline on the treatment of blood cholesterol.2 The European guidelines recommend a low-density lipoprotein cholesterol (LDL-C) target of < 70mg/dL for patients at very high risk and the American guideline simply recommend the use of high-intensity statin therapy. Considerable evidence in the literature shows that intensive lowering of LDL-C provides benefit in these patients.3–6
Several authors have reported that these ambitious targets were not being achieved in Spain.7–9 However, this situation could have changed with the new guidelines and knowledge, as suggested by the results of the IMPROVE-IT trial, which report lower LDL-C values with the addition of ezetimibe.10
The aims of the REPAR (Spanish Register for Lipid Control in Patients at Very High Risk) Study were to evaluate to what extent target LDL-C levels are achieved in patients at very high CV risk in Spain, to identify associated factors, measures taken by treating physicians when their patients are off target, and variability of such measures by autonomous community.
METHODSThe study had a national, multicenter, prospective, observational design. The protocol was approved by the ethics committee of Unitat d’Avaluació, Suport i Prevenció at Hospital Clínic, Barcelona. All patients gave their written informed consent.
Study Population and Sample SizeInclusion criteria were patients aged ≥ 18 years recruited consecutively at cardiology clinics, at very high CV risk based on the European Society of Cardiology11 defined as any one of the following: a) documented CV disease and at least 6 months since the last CV event; b) type 2 diabetes mellitus or type 1 diabetes mellitus with target organ damage; c) moderate to severe chronic kidney disease, or d) risk score > 10%. Another criterion was blood test results in the 3 months prior to recruitment. Patients were excluded if they had cancer or other disease that could confound study results.
We calculated the sample size from a previous study,8 in which 31.3% of high-risk patients achieved therapeutic targets. Using a binomial distribution, we estimated a sample size of 1360 patients, with ± 2.5% accuracy, to identify the percentage of patients at very high CV risk who achieve the therapeutic targets for LDL-C, with a 95% confidence interval (95%CI). Assuming that 2.5% of patients would not be evaluable, we therefore needed to recruit 1395 patients.
Study SupervisionA total of 140 cardiologists were selected randomly from all the Spanish autonomous communities (Appendix). Each cardiologist was responsible for recruiting 10 consecutive patients. The recruitment period was from November 6, 2013 to July 31, 2014. The investigators collected study data in an electronic case report form. The data from the case report forms were entered in a database with internal consistency rules and ranges to ensure data quality, and data cleaning was performed.
VariablesWe grouped patients by intensity of lipid-lowering therapy2: a) low-intensity (no treatment or daily dose of simvastatin 10 mg, pravastatin 10 to 20 mg, lovastatin 20 mg, fluvastatin 20 to 40 mg, pitavastatin 1 mg or ezetimibe 10 mg alone); b) moderate-intensity (atorvastatin 10-20 mg or rosuvastatin 5-10 mg, simvastatin 20-40 mg, pravastatin 40-80 mg, lovastatin 40 mg, fluvastatin XL 80 mg or pitavastatin 2-4 mg, or a low-intensity statin plus ezetimibe), and c) high-intensity (atorvastatin 40-80 mg, rosuvastatin 10-40 mg or any moderate-intensity statin plus ezetimibe).
The study primary endpoint was “adequate lipid control”. Following the European guideline criteria for CV prevention,1 we defined adequate control as LDL-C < 70mg/dL and divided the study population into 2 groups: LDL-C < 70mg/dL and LDL-C ≥ 70mg/dL.
Under the healthy habits section, alcohol consumption was defined in units (1 unit=1 beer, 1 glass of wine, 1/2 shot of liqueur or 1/2 whisky). More than 2 units/d was considered as excessive. Physical exercise was defined as walking for at least 30minutes per day or more than 2 sports sessions per week.
A short dietary intake questionnaire was used to analyze adherence to a Mediterranean diet.12
“Treatment after first visit” was reported as a variable to identify whether cholesterol-lowering therapy was up titrated.
Statistical AnalysisThe study was designed with 2 cross-sectional time points: at inclusion and at 1 year of follow up. This article refers to the first point only, because the second is still under way.
The sample was described using absolute and relative frequencies for dichotomous variables, and mean±standard deviation or median [interquartile range] for continuous variables, depending on whether or not they followed a normal distribution. For the between-group comparison (LDL-C < 70mg/dL and LDL-C ≥ 70mg/dL, subdivided into up titration and no titration), we used the chi-square test for categorical variables and the Student t test for continuous variables.
We analyzed independent predictors of therapeutic target achievement (primary endpoint) using a binary logistic regression model and LDL-C < 70mg/dL as the dependent variable. Our initial model included all variables showing a statistically significant association with the dependent variable in the bivariate analysis. Statistical significance was defined as P < .1. We used backward stepwise elimination and P entrance/exit tolerances of < .05 and > .1, respectively (with automated variable selection), to progressively eliminate variables until the model included only potential predictors of LDL-C < 70mg/dL with a statistical significance of P<.05. Potential effect modifiers were assessed using first-order interactions.
We then used the same procedure to analyze independent predictors of up titration after the first visit (increased intensity of the cholesterol-lowering therapy) in patients with LDL-C ≥ 70 mg/dL.
Finally, we examined variability by Spanish autonomous community in the prescription of high-intensity cholesterol-lowering therapy after the first visit, and whether such variability could be explained by the characteristics of the patients seen in each autonomous community or by the autonomous community size, expressed as total population. This analysis was performed only in autonomous communities that had enrolled at least 20 patients. We constructed a 3-step multilevel regression model13: in the first step we included a random constant only, to measure inter-community variability in patient rates with high-intensity cholesterol-lowering therapy. Second, we added various individual patient characteristics, to investigate whether the prescription differences by community could be explained by the characteristics of the patients seen in each community. We tested all the baseline characteristics that showed between-group differences with a statistical significance of P<.1. If autonomous community variability in the rate of patients with high-intensity cholesterol-lowering therapy fell to zero after we had adjusted by patient characteristics, variability would be due solely to the differences in the patients seen. Finally, in the third step we included the total population for each autonomous community. We estimated odds ratio (OR) as a measure of association. The multilevel regression models were constructed assuming independent covariance calculated with the R statistical package, version 0.98.953.
To measure the change in variability by autonomous community, at each step we calculated the percentage change in variance among autonomous communities in the most complex model vs the simplest. To measure the magnitude of the variance among autonomous communities, we estimated the intraclass correlation coefficient (ICC) and median OR (MOR). The ICC can be interpreted as the proportion of total variance in a selected variable that can be attributed to differences among autonomous communities. The MOR is defined as the median value of the estimated OR in the autonomous communities at “highest risk” and “lowest risk” after randomly selecting 2 autonomous communities repeated times. In this study, the MOR shows the extent to which the individual probability of receiving high-intensity cholesterol-lowering therapy is determined by the autonomous community where the patient is seen. A MOR equal to 1 would mean that there are no differences between autonomous communities in prescription rates. A MOR significantly greater than 1 would mean that there is some characteristic of the autonomous community that is relevant for explaining variations in the individual probability of receiving high-intensity cholesterol-lowering therapy, ie, some variability among autonomous communities remains unexplained. We used a 95%CI for ICC estimations and the Bayesian approach for MORs.
Analyses were calculated with the statistical packages SPSS 13.0 (Chicago, Illinois, United States) and R, version 0.98.953.
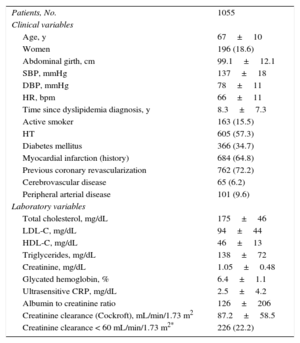
RESULTSA total of 116 physicians recruited 1291 patients, 1103 of whom had coronary heart disease and the remainder fulfilled other inclusion criteria. To increase sample homogeneity, we focused on patients with coronary heart disease since they were a majority, and finally analyzed only the 1055 patients with available baseline LDL-C values. The general characteristics of this final study population are shown in Table 1.
Baseline Characteristics of the Study Population
| Patients, No. | 1055 |
| Clinical variables | |
| Age, y | 67±10 |
| Women | 196 (18.6) |
| Abdominal girth, cm | 99.1±12.1 |
| SBP, mmHg | 137±18 |
| DBP, mmHg | 78±11 |
| HR, bpm | 66±11 |
| Time since dyslipidemia diagnosis, y | 8.3±7.3 |
| Active smoker | 163 (15.5) |
| HT | 605 (57.3) |
| Diabetes mellitus | 366 (34.7) |
| Myocardial infarction (history) | 684 (64.8) |
| Previous coronary revascularization | 762 (72.2) |
| Cerebrovascular disease | 65 (6.2) |
| Peripheral arterial disease | 101 (9.6) |
| Laboratory variables | |
| Total cholesterol, mg/dL | 175±46 |
| LDL-C, mg/dL | 94±44 |
| HDL-C, mg/dL | 46±13 |
| Triglycerides, mg/dL | 138±72 |
| Creatinine, mg/dL | 1.05±0.48 |
| Glycated hemoglobin, % | 6.4±1.1 |
| Ultrasensitive CRP, mg/dL | 2.5±4.2 |
| Albumin to creatinine ratio | 126±206 |
| Creatinine clearance (Cockroft), mL/min/1.73 m2 | 87.2±58.5 |
| Creatinine clearance < 60 mL/min/1.73 m2* | 226 (22.2) |
CRP, C-reactive protein; DBP, diastolic blood pressure; HDL-C, high-density lipoprotein cholesterol; HR, heart rate; HT, hypertension; LDL-C, low-density lipoprotein cholesterol; SBP, systolic blood pressure.
Unless otherwise indicated, data are expressed as No. (%) or mean ± standard deviation.
The most relevant serum lipid values for the entire study population (Table 1) were total cholesterol, 175±46 mg/dL; high-density lipoprotein cholesterol, 46±13 mg/dL; LDL-C, 94±44 mg/dL; triglycerides, 138±72 mg/dL; glycated hemoglobin, 6.4%±1.1%; ultrasensitive C-reactive protein, 2.5±4.2 mg/dL, and creatinine clearance (Cockroft), 87.2±58.5mL/min/1.73 m2.
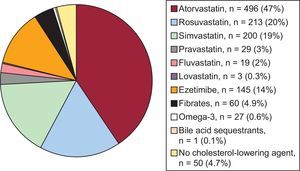
Figure 1 shows the use of cholesterol-lowering agents by active substance. The most commonly-used drug was atorvastatin (47%), followed by rosuvastatin (20%) and simvastatin (19%). Among nonstatin cholesterol-lowering agents, ezetimibe was prescribed to 14% of the patients. A small number of patients, 4.7%, did not receive any cholesterol-lowering agent.

By therapy intensity, 45%, 45%, and 10% of patients received high-, moderate-, and low-intensity cholesterol-lowering therapy, respectively.
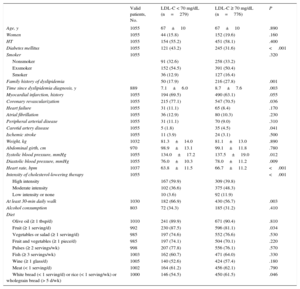
Lipid Control and Associated FactorsIn the baseline blood tests for the entire study set, 279 patients (26%) had adequate LDL-C control, while the remaining 776 (74%) had LDL-C ≥ 70mg/dL. The clinical variables associated with LDL-C < 70 mg/dL are shown in Table 2. The following variables were of particular note: diabetes mellitus, coronary revascularization, better blood pressure control, lower heart rate, and, above all, high-intensity cholesterol-lowering therapy. In contrast, active smoking, a family history of dyslipidemia and concomitant carotid artery disease were associated with poor lipid control (LDL-C ≥ 70mg/dL). Table 2 also lists diet and exercise factors, and shows an association between good lipid control and gentle daily exercise, fruit, and wholegrain bread intake.
Factors Associated With Good Lipid Control (Low-density Lipoprotein Cholesterol < 70 mg/dL)
| Valid patients, No. | LDL-C < 70 mg/dL (n=279) | LDL-C ≥ 70 mg/dL (n=776) | P | |
|---|---|---|---|---|
| Age, y | 1055 | 67±10 | 67±10 | .890 |
| Women | 1055 | 44 (15.8) | 152 (19.6) | .160 |
| HT | 1055 | 154 (55.2) | 451 (58.1) | .400 |
| Diabetes mellitus | 1055 | 121 (43.2) | 245 (31.6) | <.001 |
| Smoker | 1055 | .320 | ||
| Nonsmoker | 91 (32.6) | 258 (33.2) | ||
| Exsmoker | 152 (54.5) | 391 (50.4) | ||
| Smoker | 36 (12.9) | 127 (16.4) | ||
| Family history of dyslipidemia | 50 (17.9) | 216 (27.8) | .001 | |
| Time since dyslipidemia diagnosis, y | 889 | 7.1±6.0 | 8.7±7.6 | .003 |
| Myocardial infarction, history | 1055 | 194 (69.5) | 490 (63.1) | .055 |
| Coronary revascularization | 1055 | 215 (77.1) | 547 (70.5) | .036 |
| Heart failure | 1055 | 31 (11.1) | 65 (8.4) | .170 |
| Atrial fibrillation | 1055 | 36 (12.9) | 80 (10.3) | .230 |
| Peripheral arterial disease | 1055 | 31 (11.1) | 70 (9.0) | .310 |
| Carotid artery disease | 1055 | 5 (1.8) | 35 (4.5) | .041 |
| Ischemic stroke | 1055 | 11 (3.9) | 24 (3.1) | .500 |
| Weight, kg | 1032 | 81.3±14.0 | 81.1±13.0 | .890 |
| Abdominal girth, cm | 970 | 98.9±13.1 | 99.1±11.8 | .780 |
| Systolic blood pressure, mmHg | 1055 | 134.0±17.2 | 137.5±19.0 | .012 |
| Diastolic blood pressure, mmHg | 1055 | 76.0±10.3 | 78.0±11.2 | .009 |
| Heart rate, bpm | 1037 | 63.8±11.5 | 66.7±11.2 | <.001 |
| Intensity of cholesterol-lowering therapy | 1055 | <.001 | ||
| High intensity | 167 (59.9) | 309 (39.8) | ||
| Moderate intensity | 102 (36.6) | 375 (48.3) | ||
| Low intensity or none | 10 (3.6) | 92 (11.9) | ||
| At least 30-min daily walk | 1030 | 182 (66.9) | 430 (56.7) | .003 |
| Alcohol consumption | 803 | 72 (34.3) | 185 (31.2) | .410 |
| Diet | ||||
| Olive oil (≥ 1 tbsp/d) | 1010 | 241 (89.9) | 671 (90.4) | .810 |
| Fruit (≥ 1 serving/d) | 992 | 230 (87.5) | 596 (81.1) | .034 |
| Vegetables or salad (≥ 1 serving/d) | 985 | 197 (74.6) | 552 (76.6) | .530 |
| Fruit and vegetables (≥ 1 piece/d) | 985 | 197 (74.1) | 504 (70.1) | .220 |
| Pulses (≥ 2 servings/wk) | 998 | 207 (77.8) | 556 (76.1) | .570 |
| Fish (≥ 3 servings/wk) | 1003 | 162 (60.7) | 471 (64.0) | .330 |
| Wine (≥ 1 glass/d) | 1005 | 140 (52.6) | 424 (57.4) | .180 |
| Meat (< 1 serving/d) | 1002 | 164 (61.2) | 456 (62.1) | .790 |
| White bread (< 1 serving/d) or rice (< 1 serving/wk) or wholegrain bread (> 5 d/wk) | 1000 | 146 (54.5) | 450 (61.5) | .046 |
HT, hypertension; LDL-C, low-density lipoprotein cholesterol.
Data are expressed as No. (%) or mean±standard deviation.
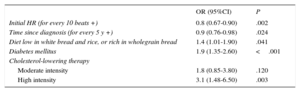
The independent predictors of LDL-C < 70 mg/dL in the multivariable analysis are shown in Table 3. The highest OR was associated with high-intensity cholesterol-lowering therapy. Lipid control was also better among diabetic patients, patients with diets containing less white bread and/or rice, and, finally, patients with a shorter history of dyslipidemia.
Independent Predictors of Low-density Lipoprotein Cholesterol < 70mg/dL. Logistic Regression
| OR (95%CI) | P | |
|---|---|---|
| Initial HR (for every 10 beats +) | 0.8 (0.67-0.90) | .002 |
| Time since diagnosis (for every 5 y +) | 0.9 (0.76-0.98) | .024 |
| Diet low in white bread and rice, or rich in wholegrain bread | 1.4 (1.01-1.90) | .041 |
| Diabetes mellitus | 1.9 (1.35-2.60) | <.001 |
| Cholesterol-lowering therapy | ||
| Moderate intensity | 1.8 (0.85-3.80) | .120 |
| High intensity | 3.1 (1.48-6.50) | .003 |
95%CI, 95% confidence interval; HR, heart rate; LDL-C, low-density lipoprotein cholesterol; OR, odds ratio.
C-statistic=0.67 (0.63-0.71).
P value for Hosmer-Lemeshow goodness of fit=.23.
We analyzed prescription changes that physicians made for the 776 patients who had LDL-C ≥ 70mg/dL. No change was made in 70% of patients. Therapy intensity was increased in 26% and was reduced in 3%. The main variables associated with up titration of therapy were low-strength therapy at baseline (OR=5.05; 95%CI, 3.3-9.2) and the LDL-C value itself (OR=1.2; 95%CI, 1.01-1.02). Specifically, of the patients with baseline LDL-C ≥ 70 mg/dL, an LDL-C value of 140±43 mg/dL was found among patients whose therapy was up titrated vs a value of 104±36 mg/dL among those whose therapy remained unchanged (P<.001). We also analyzed physician characteristics and found a more proactive attitude to up titration among older physicians (P=.02).
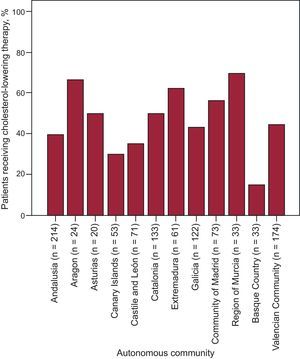
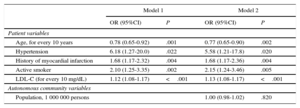
Analysis by Autonomous CommunityFigure 2 shows a major difference in baseline LDL-C values by autonomous community. We also found differences when we investigated variability among autonomous communities in high-intensity cholesterol-lowering therapy prescription rates (Figure 3). In the unadjusted multilevel model, this variability was 75%, with ICC=0.14 (95%CI, 0.05-0.32) and MOR=4.02 (95%CI, 1.22-6.65) (Table 4). Various baseline patient characteristics were associated with a higher prescription rate of high-intensity cholesterol-lowering therapy: age, hypertension, smoking, history of myocardial infarction, and baseline LDL-C. Variability among autonomous communities remained unchanged after adjustment for these variables (ICC=0.14; 95%CI, 0.05-0.31; MOR=2.45; 95%CI, 1.21-6.4), showing there must be another factor unrelated to patient profiles that would explain this prescription rate. Finally, we adjusted by the “global population” variable by autonomous communities, and found that variability persisted (ICC=0.16; 95%CI, 0.05-0.35; MOR=3.28; 95%CI, 1.25-9.41), suggesting variability in the care process unexplained by individual patient characteristics or autonomous community population size.
 of study patients with coronary heart disease based on laboratory test results before the baseline visit by autonomous community of residence. LDL-C, low-density lipoprotein cholesterol.")

Variability by Autonomous Community
| Model 1 | Model 2 | |||
|---|---|---|---|---|
| OR (95%CI) | P | OR (95%CI) | P | |
| Patient variables | ||||
| Age, for every 10 years | 0.78 (0.65-0.92) | .001 | 0.77 (0.65-0.90) | .002 |
| Hypertension | 6.18 (1.27-20.0) | .022 | 5.58 (1.21-17.8) | .020 |
| History of myocardial infarction | 1.68 (1.17-2.32) | .004 | 1.68 (1.17-2.36) | .004 |
| Active smoker | 2.10 (1.25-3.35) | .002 | 2.15 (1.24-3.46) | .005 |
| LDL-C (for every 10 mg/dL) | 1.12 (1.08-1.17) | <.001 | 1.13 (1.08-1.17) | <.001 |
| Autonomous community variables | ||||
| Population, 1 000 000 persons | 1.00 (0.98-1.02) | .820 | ||
95%CI, 95% confidence interval; ICC, intraclass correlation coefficient; LDL-C, low-density lipoprotein cholesterol; OR, odds ratio.
Initial model without adjustment by variables (not shown in the Table): variance=0.75; intraclass correlation coefficient=0.14 (0.05-0.32); median odds ratio=4.02 (1.22-6.65); goodness of fit=1.51 (P=.9); discrimination=0.63 (P < .01).
Model 1: variance=0.75; intraclass correlation coefficient=0.14 (0.05-0.31); median odds ratio=2.45 (1.21-6.4); goodness of fit=9.69 (P=.3); discrimination=0.7 (P<.001).
Model 2: variance=0.88; intraclass correlation coefficient=0.16 (0.05-0.35); median odds ratio=3.28 (1.25-9.41); goodness of fit=8.8 (P=.35); discrimination=0.7 (P<.001).
The degree of LDL-C control in patients with chronic coronary heart disease in Spain is still very low. Indeed, we observed adequate lipid control, which was the primary endpoint in this study, in only 26% of patients. This low figure is a cause for concern, because strategies that produce marked LDL-C reduction are associated with significant reductions in major adverse cardiovascular events.14 Compared with previous studies,7–9,15 the degree of control is even lower in our study, although results are not necessarily comparable due to a higher cutoff point (LDL-C < 100) in one study8 and inclusion of participants at cardiovascular risk but without coronary heart disease itself in another study.7 Furthermore, our study differs from others because we also investigated physician behavior and potential factors influencing physician actions, which provides a better overview of the problem.
The practice of administering cholesterol-lowering agents to patients with coronary heart disease is widely implemented (95.3% of patients received these drugs) and we should also note that there is a small percentage of patients with statin intolerance. Some 40% of patients received high-intensity cholesterol-lowering therapy (but not all were on maximum therapy because, for example, just 14% received ezetimibe). However, only 25% were well controlled, showing that adequate lipid control is hard to achieve. Doubling a statin dose reduces LDL-C by only 6.9% to 9.5%.16 Therefore, considering general LDL-C values in a population with coronary heart disease (94±44mg/dL in this study), it is unlikely that this common change in therapy will reduce LDL-C values to < 70 mg/dL. As a result, therapy will need up titration and, in many cases, the addition of other drugs.10 The use of novel, more potent cholesterol-lowering agents, such as PCSK9 inhibitors,17,18 could help achieve lipid control targets.
One of the most striking findings of this study is the low proportion (26%) of increased therapy among poorly controlled patients. This concept, known as therapeutic inertia, has already been described in this patient population.19 However, in our study, inertia should have been lower because the physicians knew they were participating in a lipid register.
The causes of therapeutic inertia include lack of consensus or knowledge of clinical practice guidelines,20 physicians overestimating the number of their patients with good lipid control,21 specialists being too focused on the acute disease stage, and extreme work load (although some studies were unable to find an association with the number of patients seen per week19). In our study, we found that older cardiologists prescribed significantly better treatment than their younger counterparts. Differences by autonomous community in high-intensity cholesterol-lowering therapy are another interesting finding, worthy of further reflection and investigation, but fall beyond the realms of this study. These differences in the care process remain unexplained by differences in patient characteristics, since variability scarcely changed when we adjusted the regression model by patient characteristics.
Underprescription could also be explained by lack of habit using drug combinations for dyslipidemias (combinations are very common in other fields) and even fear of using high-intensity cholesterol-lowering agents due to their potential adverse effects, although this is illogical because the undesired effects of cholesterol-lowering agents are readily reversed and a J-curve relationship in this field has yet to be demonstrated.
In addition, the health system itself further hinders the use of more potent or novel drugs and combinations by giving preference to lower-strength generics.22 Another factor, which we did not analyze in this study, is the degree of medication adherence. Lack of adherence could explain poor lipid control. Alarming figures have been published in other settings on discontinuation of cholesterol-lowering agents after 1 year of treatment. Discontinuation rates were largely dependent on drug class: 68.3% for bile acid sequestrants, 55.4% for niacin, 39.9% fibrates, 33.0% ezetimibe, and 28.9% for statins (P<.001 for all cholesterol-lowering agents vs statins).23
These problems can be addressed through different initiatives, such as patient education, physician training, specialized units, multidisciplinary programs,24 and even alternative therapies or intermittent dosing for statin-intolerant patients.25
LimitationsAlthough we instructed investigators to recruit patients consecutively to the study, as specified in the protocol, we did not check whether this requirement was fulfilled, and therefore we cannot rule out selection bias. Also, investigators were not selected or stratified at random by care level. We tried to ensure that all care levels were represented, but we cannot guarantee they were represented equally.
CONCLUSIONSThis study shows that despite changes in lipid control targets in official guidelines, a significant proportion of patients with coronary heart disease in Spain still has poor lipid control. In addition, most physicians take no action to correct poor lipid control. Our analysis of cholesterol-lowering therapies prescribed by physicians reveals room for improvement. In short, proactive policies should be implemented to encourage up titration of cholesterol-lowering therapies and the use of drug combinations when necessary, and to remove obstacles causing therapeutic inertia.
FUNDINGFerrer Internacional, Spain. The REPAR study is an initiative of the Vascular Risk and Cardiac Rehabilitation Section of the Spanish Society of Cardiology.
CONFLICTS OF INTERESTE. Galve has received remuneration from Ferrer and E. Ruiz is on the staff of the medical department at Ferrer.
- In Spain, patients with coronary heart disease have insufficient lipid control but it is unknown whether new knowledge and guidelines have improved the situation.
WHAT DOES THIS STUDY ADD?- This study shows that control remains inadequate (only 26% of patients have LDL-C < 70mg/dL); that there is room for improvement in current therapies because high-intensity statins are used in only 45% of patients and adjuvants such as ezetimibe are used in only 14%; that physicians show therapeutic inertia because they abstain from increasing therapy in 70% of patients, and that there are significant differences by autonomous community in Spain in terms of lipid control management.
Adriansens Abad JM, Agarrado Luna A, Alegría Barrero E, Alegría Ezquerra E, Alonso Pérez LJ, Álvarez Auñón A, Álvarez Cuesta JL, Álvarez García P, Andrés Novales J, Arias Castaño JC, Arribas Arribas P, Barragán Acea AM, Barrantes Castillo M, Batalla Celorio A, Bellver Navarro J, Bertomeu González V, Blanco Castiñeira J, Bravo Amaro M, Cabeza Laínez P, Campos Peris JV, Cano Nieto J, Caparrós Valderrama J, Casanova Sandoval JM, Castaños del Molino JM, Castillo Lueña JE, Chinchurreta Capote PA, Chueca Fernández JE, Claver Garrido E, Colomer Martí JL, Corbacho Ródenas JT, Cordero Fort A, Cosín Sales J, Crespo Mancebo FJ, Dalmau González-Gallarza R, Delgado Ortega M, Estruch Català G, Fácila Rubio L, Fajardo Molina R, Fernández de Soria Pantoja R, Fernández Redondo DA, Fernández Romero AJ, Flores Marín A, Franco Zapata JM, Freire Castroseiros E, García Acuña JM, García López JC, García Porrero E, García Quintana A, García-Borbolla Fernández R, Gómez Barrado JJ, Gómez Manzano J, Gómez Menchero AE, Gómez Moreno S, Gómez Pérez A, Gómez-Aldaraví Gutiérrez R, González Llópis F, González Vargas-Machuca MF, Hevia Nava JS, Huerta Blanco R, Lastra Galán JA, López Aranda MA, López Barreiro LM, López Fornas FJ, López Sánchez ES, Lozano Torres J, Marín Ortuño F, Martín Raymondi D, Martos Ferres JF, Marzal Martin D, Mazzanti Mignaqui GF, Medina Alba R, Merino Sesma J, Monzón Loma FJ, Mora Robles J, Moreno Arriba J, Nasarre Lorite E, Nicolás Valero JM, Núñez Villota J, Ortega Bernal J, Paz Bermejo MA, Pérez Garrido A, Pérez Ojeda G, Pérez Pérez AJ, Picón Heras R, Pindado Rodríguez C, Planas Aymà F, Pousibet Sanfeliu H, Rayo Gutiérrez M, Ripoll Vera T, Rodríguez Collado LJ, Rodríguez Fernández JA, Rodríguez Pérez O, Roldán Morcillo J, Romero Garrido R, Romero Hinojosa JA, Ruiz de Castroviejo del Campo J, Ruiz Ortiz M, Ruiz Ruiz M, Ruvira Durante J, Sabatel López F, Sanmartín Fernández M, Seijas Amigo J, Serra Tomas V, Torres Cortada G, Torres Marqués J, Valverde Farré A, Vega Barbado JL, Vega Fernández JM, Velásquez Arias E, Vidal Pérez RC, Villanueva Afán De Ribera A, and Zuazola Martinez P.