Hypertension causes subclinical changes in left ventricular structure and function, namely diastolic dysfunction. Diastolic dysfunction is a predictor of heart failure, being involved in the association between hypertension and heart failure with preserved ejection fraction. We aimed to determine whether patients with prehypertension have early changes in diastolic function in a large community-based cohort of asymptomatic adults.
MethodsA cross-sectional evaluation was performed of a community-based cohort consisting of 925 adults, aged 45 years or older, without known cardiovascular disease. All participants underwent detailed clinical and echocardiographic examination. The participants were categorized according to the European guidelines for the classification of office blood pressure (BP) levels as optimal, prehypertensive (normal and high-normal categories), and hypertensive. Diastolic function was evaluated by echocardiography using e’ velocities and E/e’ ratio. Diastolic dysfunction was defined using the 2016 ASE/EACVI Joint Recommendations and a 2017 clinically-oriented algorithm.
ResultsIn this cohort (61.5 ± 10.5 years; 37% men), prehypertension was present in 30.4% and hypertension in 51.0%. Using optimal BP as the reference, there was a progressive decrease of e’ velocity in prehypertensive and hypertensive individuals (12.2 ± 3.5 vs 11.3 ± 3.1 vs 9.6 ± 2.9cm/s, respectively; P for trend < .001). After multivariable adjustment, both BP categories were independent predictors of a lower e’ velocity (β = -0.56, P = .035 for prehypertension and β = –1.08, P < .001 for hypertension).
ConclusionsIn this large community-based cohort, adults with prehypertension already showed impaired cardiac relaxation before the onset of hypertension.
Keywords
Arterial hypertension is an important independent risk factor for cardiovascular disease and the single largest contributor to global mortality.1 In hypertension, subclinical organ damage represents an intermediate stage in the cardiovascular continuum, being associated with cardiovascular events.2 Therefore, current European guidelines recommend a holistic approach to the hypertensive patient, which includes the assessment of organ damage (cardiac, vascular, renal, and ophthalmic) as part of the diagnostic workup of these patients.3 Regarding cardiac involvement, hypertension can cause changes in both structure and function,4 particularly left ventricular hypertrophy and impaired diastolic function.5 Both have been shown to be independently associated with mortality and cardiovascular events.6
Diastolic dysfunction (DD) is prevalent among the general population, affecting 20% to 30% of individuals7,8 and is strongly associated with aging,9 obesity,8 insulin resistance,10 and hypertension.11 Although usually subclinical,11 DD is an important predictor of heart failure, especially of heart failure with preserved ejection fraction,12 and of long-term mortality.13 These findings support the role of DD as an intermediate step between hypertension and blood pressure (BP).11 The importance of assessing diastolic function in hypertension is acknowledged in recent recommendations, which state that evaluation of diastolic parameters should be an integral part of the echocardiogram of the hypertensive patient.14 However, the recently updated 2016 Joint Guideline of the American Society of Echocardiography and the European Association of Cardiovascular Imaging (“50% rule”)15 has been criticized due to the absence of validation data to support its use and the potential for underdiagnosing DD, and new diagnostic algorithms have been proposed.16
Observational studies have shown that the risk of cardiovascular events is directly related to systolic BP (SBP) and diastolic BP (DBP) values, with a progressively higher risk for BP levels over 115mmHg of SBP and 75mmHg of DBP.17 However, although hypertension is clearly associated with DD, few studies have assessed whether “prehypertensive patients” (BP 120-139/80-89mmHg) already have subclinical impaired diastolic function.18 Moreover, few studies have assessed the impact of different BP parameters on diastolic function.19
In this study we aimed to assess: a) whether individuals in the prehypertensive range already have changes in diastolic function; and b) the association between diastolic function and different BP parameters, such as SBP, DBP, and pulse pressure (PP).
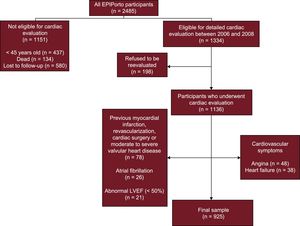
METHODSStudy SampleThis was a cross-sectional study including participants selected within the first follow-up of a cohort representative at baseline of the adult population of Porto, Portugal—the EPIPorto cohort study. From 1999 to 2003 the cohort assembly was made by random-digit dialing using households as the sampling frame, followed by random selection of 1 person aged 18 years or older in each household. Refusals were not substituted within the same household. The proportion of participation was 70%. At baseline, 2485 participants were recruited. Between October 2006 and July 2008, participants aged 45 years or over were eligible for a systematic evaluation of parameters of cardiac structure and function, which included a cardiovascular clinical history, physical examination, detailed anthropometric evaluation, collection of a fasting blood sample, and a transthoracic echocardiogram (Figure 1). Among 2048 cohort members in the eligible age range at this time, 134 (6.5%) had died, 198 (9.7%) refused to be re-evaluated, and 580 (28.3%) were lost to follow-up (unreachable by telephone or post). Of the 1136 participants who underwent cardiac evaluation, we excluded from this study those with previous myocardial infarction, percutaneous or surgical revascularization, prior cardiac surgery or moderate to severe valvular heart disease, atrial fibrillation, abnormal left ventricle ejection fraction and symptoms of angina, or heart failure (Figure 1). Written informed consent was obtained from all the individuals and the study was approved by the local ethics committee.
Clinical Variable Definitions
Participants were instructed to take their usual medication and abstain from alcohol, tea, coffee, smoking, and exercise in the 30minutes before the medical evaluation and BP measurement. Systolic BP was identified by phase I Korotkoff sound and DBP by phase V. Two measurements of BP separated by at least 5minutes were taken, on a single occasion, in the sitting position, with an ERKA 300 sphygmomanometer after a 10-minute rest, with no tight clothes, on the right upper arm, and at heart level. The mean was considered and when the difference was larger than 5mmHg for systolic or DBP a third measurement was taken and the mean of the 2 closest values was registered. According to the current guidelines,3 participants were divided into groups according to their BP levels: “optimal BP” (SBP < 120mmHg and DBP < 80mmHg); “prehypertension” (SBP 120-139mmHg or DBP 80-89mmHg); “hypertension” (SBP ≥ 140mmHg or DBP ≥ 90mmHg or use of antihypertensive medication).
Diabetes was defined as fasting blood glucose ≥ 126mg/dL or the patient's self-reported history of diabetes or use of diabetes medications.
Analytical and Anthropometric EvaluationA fasting venous blood sample was obtained in the morning for measurement of glucose, total cholesterol, LDL, HDL, and triglycerides.
Anthropometric measurements were performed after an overnight fast, with the participant wearing light clothing and no footwear. Body weight was measured to the nearest 0.1kg using a digital scale, and height was measured to the nearest centimeter in the standing position using a wall stadiometer. Body mass index was calculated as weight (kg) divided by squared height (m2). Overweight was defined as body mass index ≥ 25 and below 30kg/m2, and obesity as body mass index ≥ 30kg/m2.
Echocardiography DataAll echocardiographic studies were acquired using the same equipment (Hewlett-Packard Sonos 5500) and immediately after assessment of BP. Images were stored on videotape for subsequent offline analysis by 2 experienced cardiologists, blinded to clinical data. Cardiac chamber dimensions, volumes and left ventricular mass were measured following the standard recommendations20 and indexed to body surface area. Systolic function was evaluated by ejection fraction calculation using the modified biplane Simpson's rule. Diastolic function was assessed according to the 2016 Joint Guidelines on Diastolic Function Evaluation15 with measurement of mitral inflow velocities (E-wave, A-wave, E/A ratio) and E-wave deceleration time and isovolumetric relaxation time using pulsed-wave Doppler in the apical 4-chamber view. Velocities were recorded at end-expiration and averaged over 3 consecutive cardiac cycles. Pulsed-wave tissue Doppler velocities were acquired at end-expiration, in the apical 4-chamber view, at the lateral side of the mitral annulus, measuring early diastolic (e′) and late diastolic (a′) velocities and estimating the E/e′ ratio accordingly.
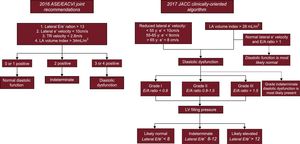
The main definition of DD used in the study followed the recommendations in the 2016 consensus document,15 where DD was defined if more than 2 of the following were present: lateral E/e’ ratio > 13, lateral e’ velocity < 10cm/s, left atrial maximum volume index > 34mL/m2, and peak tricuspid regurgitation velocity > 2.8 m/s. Diastolic function was classified as normal if less than 2 were present and indeterminate if 2 of the 4 conditions were present (Figure 2). In addition, considering the limitations of the 2016 recommendations, we also included data using 2 additional DD definitions: the previous European Association of Cardiovascular Imaging/American Society of Echocardiography (EACVI/ASE) consensus from 200921 and a recently published clinically-oriented algorithm to assess DD and left ventricle filling pressure (see Figure 2 for a detailed description of the algorithm).16

A classification scheme for characterization of diastolic function according to the 2016 ASE/EACVI Joint Recommendations and 2017 clinically-oriented algorithm. ASE/EACVI, American Society of Echocardiography/European Association of Cardiovascular Imaging; LA, left atrial; LV, left ventricle; TR, tricuspid regurgitation.
Continuous variables are reported as mean ± standard deviation or median [interquartile range]. Discrete variables are given in frequency and percentage. ANOVA or the chi-squared test were used to test for significant differences between demographic and clinical variables across BP groups (optimal, prehypertension, hypertension).
The Spearman rank correlation was used to assess the relationship between SBP, DBP, and PP and diastolic indices. The “nptrend” command in Stata was used to perform a nonparametric test of trend for the ranks across ordered groups.
To assess whether the categories of BP were associated with lateral E’ and E/E’ ratio, we used multivariable linear regression analysis including age, sex, body mass index, presence of diabetes, and BP category in the model, the latter as a categorical variable with “optimal BP” as the reference category. For evaluation of the association between DD and BP variables, we used Firth-type penalized likelihood logistic regression analysis, to correct for small-sample bias in beta coefficient estimation. McFadden's R-squared was used to assess the goodness-of-fit of the final regression models. Cases of indeterminate diastolic function (n = 134) were excluded from this analysis.
Considering the mean e’ velocities in the groups of interest (optimal BP, prehypertension, and hypertension), assuming a within-group variance of 12 and the number of individuals in each group of interest, we had a power of approximately 100% to detect a significant difference in e’ velocities with a type I error probability below 5%.
All statistical analyses were conducted using Stata 14.0 for Mac (StataCorp, College Station, Texas, United States).
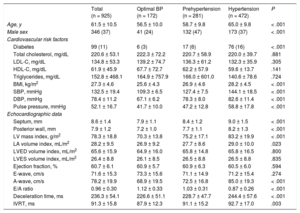
RESULTSThe final analysis included 925 participants with a mean age of 61.5 ± 10.5 years (37% men). The prevalence of hypertension was 51.0% (472 individuals) and 30.4% (281 individuals) were prehypertensive (normal or high-normal BP categories). The clinical, anthropometric, analytical and echocardiographic characteristics of the study sample are shown in Table 1. Individuals with prehypertension and hypertension showed an increased left ventricular mass index and the latter was an independent predictor of e’ velocity and E/e’ ratio. Regarding antihypertensive therapy, 22.2% were taking a renin-angiotensin axis modifier, 5.5% a calcium channel antagonist and 10.4% were on diuretics.
Study Participant Characteristics, According to Blood Pressure Levels
| Total (n = 925) | Optimal BP (n = 172) | Prehypertension (n = 281) | Hypertension (n = 472) | P | |
|---|---|---|---|---|---|
| Age, y | 61.5 ± 10.5 | 56.5 ± 10.0 | 58.7 ± 9.8 | 65.0 ± 9.8 | < .001 |
| Male sex | 346 (37) | 41 (24) | 132 (47) | 173 (37) | < .001 |
| Cardiovascular risk factors | |||||
| Diabetes | 99 (11) | 6 (3) | 17 (6) | 76 (16) | < .001 |
| Total cholesterol, mg/dL | 220.6 ± 53.1 | 222.3 ± 72.2 | 220.7 ± 58.9 | 220.0 ± 39.7 | .881 |
| LDL-C, mg/dL | 134.8 ± 53.3 | 139.2 ± 74.7 | 136.3 ± 61.2 | 132.3 ± 35.9 | .305 |
| HDL-C, mg/dL | 61.9 ± 45.9 | 67.7 ± 72.7 | 62.2 ± 57.9 | 59.6 ± 13.7 | .141 |
| Triglycerides, mg/dL | 152.8 ± 468.1 | 164.9 ± 757.9 | 166.0 ± 601.0 | 140.6 ± 78.6 | .724 |
| BMI, kg/m2 | 27.3 ± 4.6 | 25.6 ± 4.3 | 26.9 ± 4.6 | 28.2 ± 4.5 | < .001 |
| SBP, mmHg | 132.5 ± 19.4 | 109.3 ± 6.5 | 127.4 ± 7.5 | 144.1 ± 18.5 | < .001 |
| DBP, mmHg | 78.4 ± 11.2 | 67.1 ± 6.2 | 78.3 ± 8.0 | 82.6 ± 11.4 | < .001 |
| Pulse pressure, mmHg | 52.1 ± 16.7 | 41.7 ± 10.0 | 47.2 ± 12.8 | 58.8 ± 17.8 | < .001 |
| Echocardiographic data | |||||
| Septum, mm | 8.6 ± 1.4 | 7.9 ± 1.1 | 8.4 ± 1.2 | 9.0 ± 1.5 | < .001 |
| Posterior wall, mm | 7.9 ± 1.2 | 7.2 ± 1.0 | 7.7 ± 1.1 | 8.2 ± 1.3 | < .001 |
| LV mass index, g/m2 | 78.3 ± 18.8 | 70.3 ± 13.8 | 75.2 ± 17.1 | 83.2 ± 19.9 | < .001 |
| LA volume index, mL/m2 | 28.2 ± 9.5 | 26.9 ± 9.2 | 27.7 ± 8.6 | 29.0 ± 10.0 | .023 |
| LVED volume index, mL/m2 | 65.6 ± 15.9 | 64.9 ± 16.0 | 65.8 ± 14.8 | 65.8 ± 16.5 | .800 |
| LVES volume index, mL/m2 | 26.4 ± 8.8 | 26.1 ± 8.5 | 26.5 ± 8.8 | 26.5 ± 8.8 | .835 |
| Ejection fraction, % | 60.7 ± 6.1 | 60.9 ± 5.7 | 60.9 ± 6.3 | 60.5 ± 6.0 | .594 |
| E-wave, cm/s | 71.6 ± 15.3 | 73.3 ± 15.6 | 71.1 ± 14.9 | 71.2 ± 15.4 | .274 |
| A-wave, cm/s | 78.2 ± 19.9 | 68.9 ± 19.5 | 72.5 ± 16.8 | 85.0 ± 19.3 | < .001 |
| E/A ratio | 0.96 ± 0.30 | 1.12 ± 0.33 | 1.03 ± 0.31 | 0.87 ± 0.26 | < .001 |
| Deceleration time, ms | 236.3 ± 54.1 | 226.6 ± 51.1 | 228.7 ± 47.7 | 244.4 ± 57.6 | < .001 |
| IVRT, ms | 91.3 ± 15.8 | 87.9 ± 12.3 | 91.1 ± 15.2 | 92.7 ± 17.0 | .003 |
BMI, body mass index; BP, blood pressure; DBP, diastolic blood pressure; HDL-C, high-density lipoprotein cholesterol; IVRT, isovolumic relaxation time; LDL-C, low-density lipoprotein cholesterol; LA, left atria; LV, left ventricle; LVED, left ventricle end-diastolic; LVES, left ventricle end-systolic; SBP, systolic blood pressure.
Data are presented as mean ± standard deviation for continuous variables and No. (%) for categorical variables; P value for ANOVA or chi-squared test for significant differences between BP groups.
According to the 2016 ASE/EACVI Joint Recommendations, diastolic function was considered normal in 783 individuals (84.7%), abnormal in 8 (0.9%) and indeterminate in 134 (14.5%). However, when the 2017 clinically-oriented algorithm was used, the prevalence of DD was 49.2%: 16.2% had grade I DD, 5.2% had grade II, and 0.3% grade III DD. In 254 individuals, DD was graded as indeterminate.
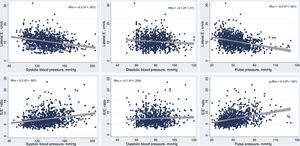
Association Between Different Blood Pressure Parameters and Diastolic FunctionSystolic BP values correlated with diastolic function parameters, showing a negative correlation with e’ velocity (Spearman's ρ = –0.3; P < .001) and a positive correlation with E/e’ ratio (Spearman's ρ = 0.2; P < .001), as detailed in Figure 3. After adjusting for age, sex, body mass index, and diabetes, we observed that for each 10mmHg increase in SBP there was a 0.2cm/s decrease in e’ velocity and a 0.1 increase in the E/e’ ratio, as detailed in Table 2. Systolic BP was not associated with DD using the more stringent 2016 criteria. However, each 10mmHg increase in SBP was associated with a 20% increase in the adjusted odds for DD according to the 2017 clinically-oriented algorithm.
 and diastolic function parameters.")
Regression Analyses Evaluating the Association Between SBP, DBP and PP and Echocardiographic Diastolic Indexes (E’ Velocity, E/E’ Ratio, and Presence of Diastolic Dysfunction)
| Univariable analysis | Multivariable analysis* | |||||
|---|---|---|---|---|---|---|
| β coefficient | SE | P | β coefficient | SE | P | |
| E’ velocity | ||||||
| SBP (per mmHg) | –0.049 | 0.005 | < .001 | –0.015 | 0.005 | .003 |
| DBP (per mmHg) | –0.030 | 0.010 | .001 | –0.031 | 0.008 | < .001 |
| PP (per mmHg) | –0.065 | 0.006 | < .001 | –0.010 | 0.006 | .126 |
| E/E’ ratio | ||||||
| SBP (per mmHg) | 0.032 | 0.004 | < .001 | 0.013 | 0.004 | .004 |
| DBP (per mmHg) | 0.009 | 0.008 | .238 | 0.009 | 0.007 | .225 |
| PP (per mmHg) | 0.051 | 0.005 | < .001 | 0.020 | 0.005 | < .001 |
| LA volume index | ||||||
| SBP (per mmHg) | 0.061 | 0.016 | < .001 | 0.032 | 0.018 | .065 |
| DBP (per mmHg) | –0.016 | 0.028 | .567 | –0.017 | 0.029 | .559 |
| PP (per mmHg) | 0.124 | 0.018 | < .001 | 0.094 | 0.022 | < .001 |
| Odds ratio | SE | P | Odds ratio | SE | P | |
|---|---|---|---|---|---|---|
| Diastolic dysfunction | ||||||
| 2016 joint ASE/EACVI recommendations | ||||||
| SBP (per mmHg) | 1.05 | 0.016 | .002 | 1.03 | 0.017 | .108 |
| DBP (per mmHg) | 0.98 | 0.032 | .447 | 0.99 | 0.032 | .658 |
| PP (per mmHg) | 1.08 | 0.017 | < .001 | 1.07 | 0.018 | < .001 |
| 2017 clinically-oriented algorithm | ||||||
| SBP (per mmHg) | 1.03 | 0.004 | < .001 | 1.02 | 0.004 | < .001 |
| DBP (per mmHg) | 1.02 | 0.006 | < .001 | 1.03 | 0.007 | < .001 |
| PP (per mmHg) | 1.04 | 0.005 | < .001 | 1.01 | 0.005 | .013 |
ASE/EACVI, American Society of Echocardiography/European Association of Cardiovascular Imaging; DBP, diastolic blood pressure; PP, pulse pressure; SBP, systolic blood pressure; SE, standard error.
For the univariable analyses, each blood pressure variable (SBP, DBP and PP) is included individually in the model for prediction of each of the diastolic indexes (linear regression) and diastolic dysfunction (logistic regression).
In the multivariable analyses, age, sex, body mass index, and the presence of diabetes were included in the model, in addition to the blood pressure variable assessed in each regression equation. All multivariable models showed McFadden's R-squared between 0.2 and 0.4, therefore providing good-fit models.
As shown in Figure 3, there was also an inverse correlation between DBP and e’ velocity (Spearman's ρ = –0.1; P = .01), but not with E/e’ ratio (Spearman's ρ = –0.1; P = .23). In the multivariable analysis, for each 10mmHg increase in DBP we observed a 0.3cm/s decrease in e’ velocity, and a 30% increase in the adjusted odds for DD according to the 2017 algorithm (no significant association was found when using the 2016 joint criteria).
PP was inversely correlated with the e’ velocity (Spearman's ρ = –0.4; P < .001) and positively correlated with the E/E’ ratio (Spearman's ρ = 0.3; P < .001), as detailed in Figure 3. In the multivariable regression analyses, PP was significantly associated with E/e’ ratio (each 10mmHg increase in PP was associated with a 0.2 increase in the E/e’ ratio) but not with e’ velocity. PP was associated with an increased odds of DD when we used both the 2016 criteria (odds ratio [OR], 1.07; P < .001) and 2017 algorithm (OR, 1.01; P = .013).
Higher SBP and PP were associated with an increase in left atrial volume index in the univariate analyses, but not DBP. However, after adjustment for age, sex, body mass index and diabetes, only PP remained a significant predictor of left atrial volume index.
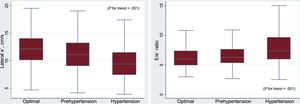
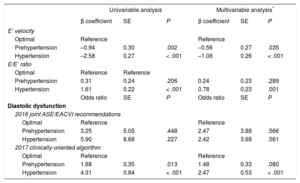
Diastolic Function Parameters in Different Categories of Blood PressureWhen compared with individuals with optimal BP, prehypertensive and hypertensive participants showed a progressive deterioration in diastolic function parameters (P for trend < .001). Prehypertension was associated with lower E’ velocity (11.3 ± 3.1cm/s vs 12.2 ± 3.5cm/s in individuals with optimal BP; P = .003), which was even lower in those with hypertension (9.6 ± 2.9cm/s vs 12.2 ± 3.5cm/s; P < .001), as depicted in Figure 4. In the multivariable analysis, both prehypertension (β = –0.56; P = .035) and hypertension (β = –1.08; P < .001) were associated with a significant decrease in the E’ velocity, as detailed in Table 3.
 according to blood pressure categories.")
Association Between Blood Pressure Categories and Diastolic Function Parameters
| Univariable analysis | Multivariable analysis* | |||||
|---|---|---|---|---|---|---|
| β coefficient | SE | P | β coefficient | SE | P | |
| E’ velocity | ||||||
| Optimal | Reference | Reference | ||||
| Prehypertension | –0.94 | 0.30 | .002 | –0.56 | 0.27 | .035 |
| Hypertension | –2.58 | 0.27 | < .001 | –1.08 | 0.26 | < .001 |
| E/E’ ratio | ||||||
| Optimal | Reference | Reference | ||||
| Prehypertension | 0.31 | 0.24 | .206 | 0.24 | 0.23 | .289 |
| Hypertension | 1.61 | 0.22 | < .001 | 0.78 | 0.23 | .001 |
| Odds ratio | SE | P | Odds ratio | SE | P | |
| Diastolic dysfunction | ||||||
| 2016 joint ASE/EACVI recommendations | ||||||
| Optimal | Reference | Reference | ||||
| Prehypertension | 3.25 | 5.05 | .448 | 2.47 | 3.88 | .566 |
| Hypertension | 5.90 | 8.68 | .227 | 2.42 | 3.68 | .561 |
| 2017 clinically-oriented algorithm | ||||||
| Optimal | Reference | Reference | ||||
| Prehypertension | 1.68 | 0.35 | .013 | 1.48 | 0.33 | .080 |
| Hypertension | 4.31 | 0.84 | < .001 | 2.47 | 0.53 | < .001 |
ASE/EACVI, American Society of Echocardiography/European Association of Cardiovascular Imaging; SE, standard error.
In the multivariable analyses, age, sex, body mass index, and the presence of diabetes were included in the model, in addition to the blood pressure categories assessed in each regression equation. All multivariable models showed McFadden's R-squared between 0.2-0.4, therefore providing good-fit models.
There was a significant trend toward a progressive increase in the E/e’ ratio as BP levels increased (6.4 ± 2.1 for optimal BP, 6.7 ± 2.1 for prehypertension and 8.0 ± 2.9 for hypertensive individuals; P for trend < .001). However, after adjustment for age, sex, body mass index, and diabetes, only hypertension was significantly associated with the lateral E/e’ ratio (Table 3).
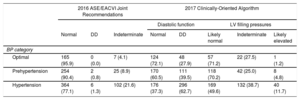
According to the 2016 Joint Recommendations, DD was present in 0.8% of prehypertensive and 1.3% of hypertensive patients (Table 4). Using the less stringent 2017 algorithm, there was a progressive and significant increase in the prevalence of DD across BP categories, from 28% in individuals with optimal BP, 39% in prehypertension and 63% in hypertension (Table 4). Furthermore, we found an increasing prevalence of likely elevated left ventricle filling pressures (1%, 5%, and 11% in the optimal, prehypertensive and hypertensive groups, respectively).
Prevalence and Grade of Diastolic Dysfunction Across Blood Pressure Categories Using the 2016 Joint Recommendations and the 2017 Clinically-oriented Algorithm
| 2016 ASE/EACVI Joint Recommendations | 2017 Clinically-Oriented Algorithm | |||||||
|---|---|---|---|---|---|---|---|---|
| Diastolic function | LV filling pressures | |||||||
| Normal | DD | Indeterminate | Normal | DD | Likely normal | Indeterminate | Likely elevated | |
| BP category | ||||||||
| Optimal | 165 (95.9) | 0 (0.0) | 7 (4.1) | 124 (72.1) | 48 (27.9) | 57 (71.2) | 22 (27.5) | 1 (1.2) |
| Prehypertension | 254 (90.4) | 2 (0.8) | 25 (8.9) | 170 (60.5) | 111 (39.5) | 118 (70.2) | 42 (25.0) | 8 (4.8) |
| Hypertension | 364 (77.1) | 6 (1.3) | 102 (21.6) | 176 (37.3) | 296 (62.7) | 169 (49.6) | 132 (38.7) | 40 (11.7) |
ASE/EACVI, American Society of Echocardiography/European Association of Cardiovascular Imaging; BP, blood pressure; DD, diastolic dysfunction; LV, left ventricle.
Data are expressed as No. (%).
We found no significant association between BP categories and DD using the 2016 criteria (8 cases of DD). Prehypertension was significantly associated with increased odds of DD in the univariate analysis, using the 2017 algorithm (OR, 1.68; P = .013), although the P value was slightly higher than .05 in the multivariable analysis (Table 3).
DISCUSSIONIn this cross-sectional study using a community-based cohort of asymptomatic individuals without known cardiovascular disease, we found a continuous association between the deterioration of diastolic function and BP levels, including SBP, DBP, and PP. More importantly, we observed that although diastolic function impairment is more pronounced in hypertensive individuals, these changes were already present in prehypertensive individuals, reflecting subclinical organ damage in this population.
Impairment of Diastolic Function in Prehypertensive IndividualsThere is currently strong evidence supporting a continuum of cardiovascular risk in function of BP values, not exclusive to the hypertensive range.11,12,17 This relationship was highlighted in a meta-analysis of 61 prospective studies, which showed a strong relationship between cardiovascular mortality and BP values, down to BP values of 115/75mmHg.17 Also, previous studies have shown that prehypertensive individuals have more target-organ damage than normotensive individuals, namely vascular damage.22,23
In our study we showed a continuous relationship between increasing degrees of BP (especially SBP and DBP) and a deterioration in E’ velocity, suggesting impaired cardiac relaxation. This observation supports the notion that these changes may reflect the cumulative effect of hypertension on the myocardium.6 Moreover, we observed that prehypertensive individuals had significantly lower E’ velocities compared with patients with “optimal BP”, showing that changes in diastolic function are already present in the prehypertensive stage. These results are in agreement with a previously published study based on an analysis from the ARIC cohort18 comprising a sample of 4871 older individuals (mean age 75 years), showing a progressive impairment of diastolic function parameters throughout different BP thresholds (from optimal BP to hypertension). Although there were significant differences between the groups in terms of diastolic function parameters (e’ lateral, E/e’ lateral) and prevalence of DD, there were no differences in systolic function parameters.
In our study, PP was associated with a higher E/e’ ratio and left atrial volume index (denoting increased left ventricle filling pressure), and with increased odds of DD. PP is an indirect index of arterial stiffness and an independent predictor of cardiovascular mortality.24 Data from the Framingham Heart Study provide support that in middle-aged and elderly individuals, PP has more prognostic power for cardiovascular events than SBP or DBP,25 and identifies the highest-risk patients for developing heart failure.26 Increased arterial stiffness might increase left ventricle hypertrophy due to cardiac pressure overload, therefore contributing to the morphological and functional changes involved in the pathophysiology of DD and elicit subclinical cardiac damage.
Our data corroborate the sensitivity of diastolic function parameters as markers of myocardial subclinical organ damage in this clinical setting. From a pathophysiological standpoint, several mechanisms might account for the progressive deterioration of cardiac relaxation and increased myocardial stiffness27: increased fibrosis, hypophosphorylation of titin, altered myocardial metabolism, decreased nitric oxide availability and a proinflammatory milieu.
The Role of Diastolic Function as a Target Organ in Cardiovascular Risk AssessmentThe presence of DD, even when subclinical, is considered an independent predictor of cardiovascular events and mortality.7 For example, in hypertensive individuals from the ASCOT substudy, the E/e’ ratio was an independent predictor of cardiovascular events.6 Curiously, most E/e’ ratio values were within the normal range, reflecting that this is indeed a sensitive parameter. Even in hypertensive patients with left ventricular hypertrophy, which is an established marker of target organ damage,3 impairment of diastolic function parameters adds prognostic information, allowing a better assessment of risk in this population.28
In our study, we decided to include 2 different criteria to define DD: the 2016 ASE/EACVI Joint Recommendations15 and a recently published clinically-oriented algorithm.16 The former replaced the previous recommendations for echocardiographic assessment of diastolic function.21 However, it has been strongly criticized because it was not validated and because its “50% rule” is very stringent, resulting in a large proportion of patients being included as “indeterminate” group (14.5% in our study). Indeed, according to the 2016 Joint Recommendations, we found a prevalence of DD of 0.9%, markedly different from the 49.2% using the 2017 algorithm and 22.0% using the previous recommendations from 2009 (). This prevalence of DD is in line with a recently published study using data from 1485 participants of the community-based STANISLAS cohort (1.3%).29 The small number of cases of DD using the 2016 criteria might account for the lack of significant association in the multivariable analysis both with prehypertension and hypertension. On the other hand, using the 2017 clinically-oriented algorithm, hypertensive patients had a 2.47 increased odds of DD and prehypertension was associated with a 1.48 increased odds of DD (P = .080). Given the importance of DD in the interface between hypertension and the development of BP,4,30 our findings offer a possible explanation for the increased cardiovascular risk in prehypertensive individuals.31
Strengths and LimitationsThe strengths of this study include the assessment of a relatively large sample of the general population, without other cardiac diseases, using contemporary echocardiographic techniques for the assessment of diastolic function.21 In this study, which comprised individuals 45 years or older, the prevalence of hypertension was 53.6%, which is similar to that reported in European individuals aged between 35 and 64 years (44.2%),32 and for Portuguese individuals between 35 and 64 years (46.9%).33 Diastolic function was evaluated according to the recommendations of the consensus document of the European Association of Echocardiography and the American Society of Echocardiography,21 which recommend the evaluation of E’ velocities and E/E’ ratio from tissue Doppler. In this study, we observed a stronger association between BP parameters and E’ velocity, which is considered an early and preload-independent index of left ventricular relaxation,28 whereas the E/E’ ratio is used to estimate increased left ventricle filling pressures.34
In this study, most patients were female (63%) and we adopted a cross-sectional design, which partially limits comments on causality. Furthermore, among the 2048 cohort members within the eligible age range, 580 individuals (28%) were unreachable by telephone or post. Although we excluded patients with clinical signs of coronary artery disease, we did not perform any stress tests to exclude myocardial ischemia, which is also a determinant of DD. In the assessment of diastolic function, we did not evaluate intraobserver or interobserver variability. However, all 4 cardiologists had extensive experience in echocardiography and worked in the same institution and a detailed procedure protocol was discussed between the team, prior to the start of the study, to harmonize the methodology and the measurements. Regarding the logistic regression models, due to the small number of positive cases of DD using some of the definitions, maximum likelihood estimation of conventional logistic model may suffer from small-sample bias. To address this problem, as well as the risk of over-adjustment after forcing 4 variables in the multivariable model (age, sex, body mass index, and diabetes), we used Firth-type penalized likelihood logistic regression analysis. Finally, in this study, all BP measurements were obtained using office BP, and not with ambulatory BP monitoring, which is currently the gold-standard method recommended in hypertension guidelines and provides a more accurate approach to the relationship between cardiovascular morbidity and mortality than office BP.3 The use of ambulatory BP monitoring would potentially result in the reclassification of some individuals in a lower BP category.35
CONCLUSIONsIn this large sample of the general population, there was a continuous relationship between BP levels and deterioration of diastolic function parameters. Changes in diastolic function were already present in prehypertensive individuals, reflecting myocardial subclinical organ damage in this population. Given the prognostic impact of DD in hypertensive patients, these observations reinforce the importance of assessing diastolic function in the workup of both hypertensive and prehypertensive patients.
CONFLICTS OF INTERESTNone declared.
- –
Hypertension is a major cardiovascular risk factor that is associated with structural and functional deleterious cardiac changes, contributing to impaired diastolic function and heart failure with preserved ejection fraction. Few studies have specifically evaluated the association between prehypertension and DD, especially considering the recent 2016 updated recommendations for the evaluation of diastole.
- –
Using a community-based cohort free of known cardiovascular disease, we found a continuous relationship between BP levels and deterioration of diastolic function parameters. Furthermore, prehypertensive individuals seemed to have an increased odds of DD using both the 2016 ASE/EACVI Joint Recommendations and a 2017 clinically-oriented algorithm. Our findings emphasize the importance of assessing diastolic function in the workup of both hypertensive and prehypertensive patients