Recent animal studies have shown metformin (MF) to impair endothelialization of drug-eluting stents (DES). The aim of this study was to evaluate the effect of MF on the healing of DES in human coronary arteries of patients with diabetes mellitus by optical coherence tomography (OCT).
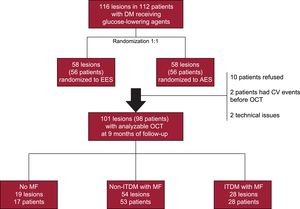
MethodsThe RESERVOIR trial randomized 116 lesions in 112 patients with diabetes mellitus to amphilimus- or everolimus-eluting stents and included mandatory OCT at 9 months of follow-up. Patients were divided in 3 groups according to the glucose-lowering agents received: a) no MF; b) MF in noninsulin treated patients, and c) MF in insulin-treated patients. The primary safety endpoint was the rate of uncovered stents.
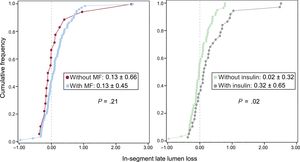
ResultsSeventeen patients with 19 lesions did not receive MF, whereas MF was administered to 53 noninsulin treated patients (54 lesions) and 28 insulin-treated patients (28 lesions). Baseline characteristics were comparable, although noninsulin treated patients who received MF had better glycemic control (P < .01). By OCT, rates of uncovered struts were comparable between groups (3.07±4.80% vs 2.23±4.73% vs 3.43±6.69%, respectively; P = .48). Multivariate models confirmed that MF had no effect on the healing of DES (OR, 1.49, 95%CI, 0.71-3.08; P = .29). Similarly, quantitative angiography showed no effect of MF on late lumen loss, whereas patients treated with exogenous insulin had greater late lumen loss (P = .02).
ConclusionsMetformin use does not impair endothelial healing of DES in patients with both insulin- and noninsulin-treated diabetes mellitus. According to these results, MF should not be discouraged in these patients.
Keywords
Patients with diabetes mellitus (DM) are at increased risk of coronary adverse events after percutaneous coronary intervention.1,2 Use of drug-eluting stents (DES) in these patients is associated with a significant reduction in events compared with bare metal stents.3 However, DM is a well-recognized predictor of DES thrombosis, which may be associated, among other causes, to lack of strut endothelialization.4
Metformin (MF), a biguanide insulin sensitizer, inhibits mitochondrial respiratory chain complex I and produces the activation of 5’-adenosine monophosphate-activated protein kinase, which leads to the inhibition of mammalian target of rapamycin (mTOR) complex 1 and its substrate S6 kinase.5 Thus, MF and mTOR inhibitors eluted by most DES (such as sirolimus or everolimus) share convergent signaling pathways. As a result, the association of sirolimus and MF could act synergistically, impairing endothelialization after stent placement. By contrast, patients with DM, especially those treated with insulin, exhibit exaggerated neointimal (NI) growth rather than a lack of endothelialization and therefore, the association of MF and mTOR inhibitors may increase their efficacy.
Previous preclinical studies have shown a significant reduction in stent endothelization in nondiabetic animals treated with MF.5,6 However, the effect of MF on strut endothelialization in humans has never been evaluated by intracoronary imaging. The objective of this study was to compare the effect of MF on the endothelialization of DES by optical coherence tomography (OCT) in both insulin-treated diabetes mellitus (ITDM) and noninsulin-treated diabetes mellitus patients (non-ITDM).
METHODSStudy PopulationAll patients from the RESERVOIR trial7 evaluated by OCT at 9 months of follow-up were included in the current study. A full description of the trial has been published previously.7 Briefly, the RESERVOIR trial was a multicenter, prospective, randomized clinical trial that aimed to compare the endothelialization of 2 different DES by OCT in 112 patients with DM.8 The target population consisted of diabetic patients with documented silent ischemia, stable angina, unstable angina or non—ST-segment elevation myocardial infarction. Major exclusion criteria included patients with DM treated only with diet and lifestyle changes, ST-segment elevation myocardial infarction, left main or ostial left descending artery stenosis, large bifurcations, severely calcified lesions, stent restenosis, chronic renal failure, or left ventricular ejection fraction < 30%. From a total of 112 patients randomized, 98 patients (101 lesions) underwent angiographic and OCT follow-up surveillance at 9 months. OCT results demonstrated that formulation of the drug with an amphiphilic carrier (amphilimus-eluting stents, CID, Saluggia, Italy)9 resulted in noninferior efficacy compared with the classic elution from durable polymers (everolimus-eluting stents, Abbott Vascular, Illinois, United States).
All patients were followed up by an endocrinologist during the study follow-up. A complete metabolic profile including body mass index, creatinine, hemoglobin A1c, high-density lipoproteins and low-density lipoproteins cholesterol was assessed at baseline and at the moment of the angiographic follow-up. Diabetes mellitus management was performed according to recommendations for standard of care of European clinical practice guidelines on DM.10
Patients were divided into 3 groups according to the glucose-lowering agents received during the study follow-up: a) patients not treated with MF; patients receiving MF were subsequently divided depending on the exogenous insulin status; b) patients treated with MF but not receiving exogenous insulin, and c) insulin-treated patients also treated with MF.
Study Endpoints and DefinitionsThe synergy between MF and mTOR inhibitors inhibiting neointimal healing was evaluated in this study by the relative frequency of uncovered struts by OCT at 9 months of follow-up (primary endpoint). Struts were classified as uncovered if any part of the strut was visibly exposed to the lumen, or covered if a layer of tissue was visible over all the reflecting surfaces.11 The NI volume obstruction was used as the efficacy endpoint, inhibiting the NI hyperplasia. Neointimal volume obstruction was defined as the NI volume (mm3) divided by the stent volume (mm3) multiplied by 100.11 Other endpoints included the relative frequency of malapposed struts, the relative frequency of uncovered and malapposed struts, NI thickness, maximal NI area obstruction assessed by OCT, and angiographic in-stent late loss.8
Angiographic and Optical Coherence Tomography AnalysisQuantitative coronary analysis was performed at a central core laboratory (BARCICORE Lab, Barcelona, Spain)12 by experienced analysts, blinded to the medical treatment received for DM. The analysis was performed using dedicated coronary angiography analysis software (CAAS version 5.9, Pie Medical BV, Maastricht, the Netherlands).
Optical coherence tomography data were also analyzed at the same core laboratory (BARCICORE Lab, Barcelona, Spain) by experienced analysts, who were also blinded to the clinical data, using proprietary offline software (LightLab Imaging, St. Jude Medical Inc.). Cross-sections at 1-mm intervals within the stent segment and 5mm proximal and distal to the stent edges were analyzed as previously described. Frames with overlapped stents or side-branches take off were not considered for analysis. For totally occluded vessels that were not associated with stent thrombosis, it was estimated that the entire length of the stent was filled with NI hyperplasia.13
Statistical AnalysisStatistical analysis was performed using SPSS version 23.0 (Chicago, Illinois, United States). Continuous variables are shown as mean±standard deviation unless otherwise noted. Categorical variables are expressed as frequencies and group percentages. Baseline characteristics were compared using the chi-square test or Fischer exact test for categorical variables and ANOVA (analysis of variance) for continuous variables. Bonferroni adjustment was used for multiple comparisons between groups. To evaluate the synergic effect of mTOR inhibitors and MF taking into account the nonindependence of struts within lesions, generalized estimating equation models as well as nonparametric analysis of aggregated data were used.14 Generalized estimating equation models were conducted nesting struts within lesions, and using treatment groups and the stent type received by randomization as covariates. Statistical significance was set at the .05 level for all comparisons.
RESULTSFrom October 2012 to October 2013, 98 patients (101 lesions) were enrolled in the study and evaluated by OCT at 9 months of follow-up: 17 patients (19 lesions) did not receive MF, whereas MF was prescribed to 53 non-ITDM patients (54 lesions) and 28 ITDM patients (28 lesions) (Figure 1).

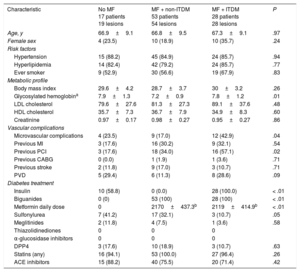
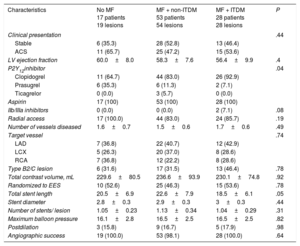
Baseline clinical and procedural characteristics are shown in Table 1 and Table 2. Notably, 60% of patients in group without MF were insulin-treated. Accordingly, glycemic control tended to be better in the group treated only with MF (P = .06). The frequency of micro- and macrovascular complications was higher in ITDM patients. By contrast, low-density lipoprotein and high-density lipoprotein cholesterol was similar between the groups (all P > .50).
Baseline Characteristics and Metabolic Profile
| Characteristic | No MF 17 patients 19 lesions | MF + non-ITDM 53 patients 54 lesions | MF + ITDM 28 patients 28 lesions | P |
|---|---|---|---|---|
| Age, y | 66.9±9.1 | 66.8±9.5 | 67.3±9.1 | .97 |
| Female sex | 4 (23.5) | 10 (18.9) | 10 (35.7) | .24 |
| Risk factors | ||||
| Hypertension | 15 (88.2) | 45 (84.9) | 24 (85.7) | .94 |
| Hyperlipidemia | 14 (82.4) | 42 (79.2) | 24 (85.7) | .77 |
| Ever smoker | 9 (52.9) | 30 (56.6) | 19 (67.9) | .83 |
| Metabolic profile | ||||
| Body mass index | 29.6±4.2 | 28.7±3.7 | 30±3.2 | .26 |
| Glycosylated hemoglobina | 7.9±1.3 | 7.2±0.9 | 7.8±1.2 | .01 |
| LDL cholesterol | 79.6±27.6 | 81.3±27.3 | 89.1±37.6 | .48 |
| HDL cholesterol | 35.7±7.3 | 36.7±7.9 | 34.9±8.3 | .60 |
| Creatinine | 0.97±0.17 | 0.98±0.27 | 0.95±0.27 | .86 |
| Vascular complications | ||||
| Microvascular complications | 4 (23.5) | 9 (17.0) | 12 (42.9) | .04 |
| Previous MI | 3 (17.6) | 16 (30.2) | 9 (32.1) | .54 |
| Previous PCI | 3 (17.6) | 18 (34.0) | 16 (57.1) | .02 |
| Previous CABG | 0 (0.0) | 1 (1.9) | 1 (3.6) | .71 |
| Previous stroke | 2 (11.8) | 9 (17.0) | 3 (10.7) | .71 |
| PVD | 5 (29.4) | 6 (11.3) | 8 (28.6) | .09 |
| Diabetes treatment | ||||
| Insulin | 10 (58.8) | 0 (0.0) | 28 (100.0) | < .01 |
| Biguanides | 0 (0) | 53 (100) | 28 (100) | < .01 |
| Metformin daily dose | 0 | 2170±437.3b | 2119±414.9b | < .01 |
| Sulfonylurea | 7 (41.2) | 17 (32.1) | 3 (10.7) | .05 |
| Meglitinides | 2 (11.8) | 4 (7.5) | 1 (3.6) | .58 |
| Thiazolidinediones | 0 | 0 | 0 | |
| α-glucosidase inhibitors | 0 | 0 | 0 | |
| DPP4 | 3 (17.6) | 10 (18.9) | 3 (10.7) | .63 |
| Statins (any) | 16 (94.1) | 53 (100.0) | 27 (96.4) | .26 |
| ACE inhibitors | 15 (88.2) | 40 (75.5) | 20 (71.4) | .42 |
ACE, angiotensin-converting enzyme; CABG, coronary artery bypass graft; DPP4, dipeptidyl peptidase-4 inhibitors; HDL, high-density lipoproteins; ITDM, insulin-treated diabetes mellitus; LDL, low-density lipoproteins; MF, metformin; MI, myocardial infarction; PCI, percutaneous coronary intervention; PVD, peripheral vascular disease.
The data are presented as No. (%) or mean±standard deviation.
Clinical and Procedural Characteristics
| Characteristics | No MF 17 patients 19 lesions | MF + non-ITDM 53 patients 54 lesions | MF + ITDM 28 patients 28 lesions | P |
|---|---|---|---|---|
| Clinical presentation | .44 | |||
| Stable | 6 (35.3) | 28 (52.8) | 13 (46.4) | |
| ACS | 11 (65.7) | 25 (47.2) | 15 (53.6) | |
| LV ejection fraction | 60.0±8.0 | 58.3±7.6 | 56.4±9.9 | .4 |
| P2Y12inhibitor | .04 | |||
| Clopidogrel | 11 (64.7) | 44 (83.0) | 26 (92.9) | |
| Prasugrel | 6 (35.3) | 6 (11.3) | 2 (7.1) | |
| Ticagrelor | 0 (0.0) | 3 (5.7) | 0 (0.0) | |
| Aspirin | 17 (100) | 53 (100) | 28 (100) | |
| IIb/IIIa inhibitors | 0 (0.0) | 0 (0.0) | 2 (7.1) | .08 |
| Radial access | 17 (100.0) | 44 (83.0) | 24 (85.7) | .19 |
| Number of vessels diseased | 1.6±0.7 | 1.5±0.6 | 1.7±0.6 | .49 |
| Target vessel | .74 | |||
| LAD | 7 (36.8) | 22 (40.7) | 12 (42.9) | |
| LCX | 5 (26.3) | 20 (37.0) | 8 (28.6) | |
| RCA | 7 (36.8) | 12 (22.2) | 8 (28.6) | |
| Type B2/C lesion | 6 (31.6) | 17 (31.5) | 13 (46.4) | .78 |
| Total contrast volume, mL | 229.6±80.5 | 236.6±93.9 | 230.1±74.8 | .92 |
| Randomized to EES | 10 (52.6) | 25 (46.3) | 15 (53.6) | .78 |
| Total stent length | 20.5±6.9 | 22.6±7.9 | 18.5±6.1 | .05 |
| Stent diameter | 2.8±0.3 | 2.9±0.3 | 3±0.3 | .44 |
| Number of stents/ lesion | 1.05±0.23 | 1.13±0.34 | 1.04±0.29 | .31 |
| Maximum balloon pressure | 16.1±2.8 | 16.5±2.5 | 16.5±2.5 | .82 |
| Postdilation | 3 (15.8) | 9 (16.7) | 5 (17.9) | .98 |
| Angiographic success | 19 (100.0) | 53 (98.1) | 28 (100.0) | .64 |
ACS, acute coronary syndrome; EES, everolimus-eluting stent; ITDM, insulin-treated diabetes mellitus; LAD, left anterior descending artery; LCX, left circumflex artery; LV, left ventricular; MF, metformin; RCA: right coronary artery.
The data are presented as No. (%) or mean±standard deviation.
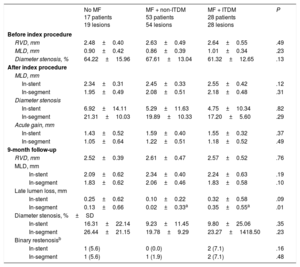
Angiographic characteristics are shown in Table 3. After stent implantation, reference vessel diameter, minimal lumen diameter and acute gain were similar for all groups. At 9 months of follow-up, in-segment late lumen loss was significantly lower for non-ITDM treated with MF compared with ITDM patients treated with MF (P < .01), whereas there were no differences between non-ITDM patients with MF vs patients without MF (P = 1.0). Insulin-treated patients had significantly higher late loss vs those never treated with insulin (P = .02, Figure 2).
Paired Quantitative Coronary Angiography Results
| No MF 17 patients 19 lesions | MF + non-ITDM 53 patients 54 lesions | MF + ITDM 28 patients 28 lesions | P | |
|---|---|---|---|---|
| Before index procedure | ||||
| RVD, mm | 2.48±0.40 | 2.63±0.49 | 2.64±0.55 | .49 |
| MLD, mm | 0.90±0.42 | 0.86±0.39 | 1.01±0.34 | .23 |
| Diameter stenosis, % | 64.22±15.96 | 67.61±13.04 | 61.32±12.65 | .13 |
| After index procedure | ||||
| MLD, mm | ||||
| In-stent | 2.34±0.31 | 2.45±0.33 | 2.55±0.42 | .12 |
| In-segment | 1.95±0.49 | 2.08±0.51 | 2.18±0.48 | .31 |
| Diameter stenosis | ||||
| In-stent | 6.92±14.11 | 5.29±11.63 | 4.75±10.34 | .82 |
| In-segment | 21.31±10.03 | 19.89±10.33 | 17.20±5.60 | .29 |
| Acute gain, mm | ||||
| In-stent | 1.43±0.52 | 1.59±0.40 | 1.55±0.32 | .37 |
| In-segment | 1.05±0.64 | 1.22±0.51 | 1.18±0.52 | .49 |
| 9-month follow-up | ||||
| RVD, mm | 2.52±0.39 | 2.61±0.47 | 2.57±0.52 | .76 |
| MLD, mm | ||||
| In-stent | 2.09±0.62 | 2.34±0.40 | 2.24±0.63 | .19 |
| In-segment | 1.83±0.62 | 2.06±0.46 | 1.83±0.58 | .10 |
| Late lumen loss, mm | ||||
| In-stent | 0.25±0.62 | 0.10±0.22 | 0.32±0.58 | .09 |
| In-segment | 0.13±0.66 | 0.02±0.33a | 0.35±0.55a | .01 |
| Diameter stenosis, %±SD | ||||
| In-stent | 16.31±22.14 | 9.23±11.45 | 9.80±25.06 | .35 |
| In-segment | 26.44±21.15 | 19.78±9.29 | 23.27±1418.50 | .23 |
| Binary restenosisb | ||||
| In-stent | 1 (5.6) | 0 (0.0) | 2 (7.1) | .16 |
| In-segment | 1 (5.6) | 1 (1.9) | 2 (7.1) | .48 |
ITDM, insulin-treated diabetes mellitus; MF, metformin; MLD, minimum vessel diameter; RVD, reference vessel diameter.
Unless otherwise indicated, the data are presented as No. (%) or mean ± standard deviation.
 or exogenous insulin (right panel). MF, metformin.")
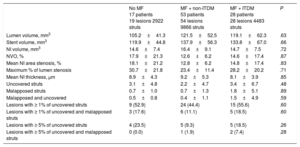
The OCT results are presented in Table 4, Figure 3 and Figure of the supplementary material. Analyzable neointimal volume data were available in all patients; however, strut coverage could not be assessed in 1 patient in the no MF group due to technical issues. The primary endpoint, the relative frequency of uncovered struts, was similar for all 3 groups (3.07±4.80% for patients without MF vs 2.23±4.73% for non-ITDM + MF group vs 3.43±6.69% for ITDM + MF group, P = .48). Generalized estimating equations models confirmed no association between MF and the relative frequency of uncovered struts, regardless the insulin status or the stent type allocated during the study randomization (OR, 1.49; 95%CI, 0.71-3.08; P = .29). Similarly, the NI volume obstruction (endpoint of efficacy of the combination of drugs) was also similar for all groups (P = .87).
Optical Coherence Tomography Results
| No MF 17 patients 19 lesions 2922 struts | MF + non-ITDM 53 patients 54 lesions 9866 struts | MF + ITDM 28 patients 28 lesions 4483 struts | P | |
|---|---|---|---|---|
| Lumen volume, mm3 | 105.2±41.3 | 121.5±52.5 | 119.1±62.3 | .63 |
| Stent volume, mm3 | 119.9±44.8 | 137.9±56.3 | 133.8±67.0 | .66 |
| NI volume, mm3 | 14.6±7.4 | 16.4±9.1 | 14.7±7.5 | .72 |
| NVO, % | 17.9±21.3 | 12.6±6.2 | 14.6±17.4 | .87 |
| Mean NI area stenosis, % | 18.1±21.2 | 12.8±6.2 | 14.8±17.4 | .83 |
| Maximum % of lumen stenosis | 30.7±21.8 | 23.4±11.4 | 28.2±20.2 | .71 |
| Mean NI thickness, μm | 8.9±4.3 | 9.2±5.3 | 8.1±3.9 | .85 |
| Uncovered struts | 3.1±4.8 | 2.2±4.7 | 3.4±6.7 | .48 |
| Malapposed struts | 0.7±1.0 | 0.7±1.3 | 1.8±5.1 | .89 |
| Malapposed and uncovered | 0.5±0.8 | 0.4±1.1 | 1.5±4.9 | .59 |
| Lesions with ≥ 1% of uncovered struts | 9 (52.9) | 24 (44.4) | 15 (55.6) | .60 |
| Lesions with ≥ 1% of uncovered and malapposed struts | 3 (17.6) | 6 (11.1) | 5 (18.5) | .60 |
| Lesions with ≥ 5% of uncovered struts | 4 (23.5) | 5 (9.3) | 5 (18.5) | .26 |
| Lesions with ≥ 5% of uncovered and malapposed struts | 0 (0.0) | 1 (1.9) | 2 (7.4) | .28 |
ITDM, insulin-treated diabetes mellitus; MF, metformin; NI, neointimal; NVO: neointimal volume obstruction.
Unless otherwise indicated, the data are presented as No. (%) or mean±standard deviation.

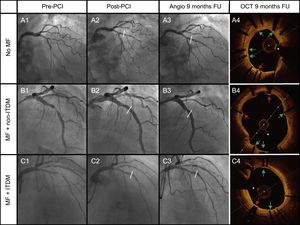
Cases of the 3 groups of therapy received: A: No MF; B: MF + non-ITDM; C: MF + ITDM. Column 1 represents angiography images pre-PCI, column 2 post-PCI, column 3 angiography at 9 months, and the last column represents OCT images at 9 months. Green arrows point to covered struts. Red arrows represent uncovered struts. The asterisk represents the wire artefact. FU, follow-up; ITDM, insulin-treated diabetes mellitus; MF, metformin; non-ITDM, noninsulin treated diabetes mellitus; OCT, optical coherence tomography; PCI, percutaneous coronary intervention.
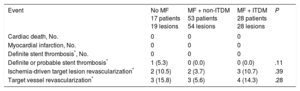
Clinical follow-up was obtained for all patients at 12 months (Table 5). No significant differences were observed in any of the prespecified endpoints between groups, although numerically there were more target vessel revascularizations in the no MF and ITDM + MF groups (15.8% and 14.3%, respectively) vs 5.6% in non-ITDM + MF group; P = .28).
Clinical Events at 12 Months
| Event | No MF 17 patients 19 lesions | MF + non-ITDM 53 patients 54 lesions | MF + ITDM 28 patients 28 lesions | P |
|---|---|---|---|---|
| Cardiac death, No. | 0 | 0 | 0 | |
| Myocardial infarction, No. | 0 | 0 | 0 | |
| Definite stent thrombosis*, No. | 0 | 0 | 0 | |
| Definite or probable stent thrombosis* | 1 (5.3) | 0 (0.0) | 0 (0.0) | .11 |
| Ischemia-driven target lesion revascularization* | 2 (10.5) | 2 (3.7) | 3 (10.7) | .39 |
| Target vessel revascularization* | 3 (15.8) | 3 (5.6) | 4 (14.3) | .28 |
ITDM, insulin-treated diabetes mellitus; MF, metformin.
Unless otherwise indicated, the data are expressed as No. (%).
The present study is the first to evaluate the role of MF in the endothelialization of DES in humans by intravascular imaging. The main findings of this study are the following: a) MF use is not associated with impaired neointimal healing of DES in humans with DM, and b) insulin-treated patients showed significantly worse angiographic results at follow-up than patients not treated with exogenous insulin.
Previous studies in animal models suggested that MF may inhibit endothelialization following limus-eluting stent placement, and thus, this combination may increase the risk of stent thrombosis.5,6 Notably, these studies were performed in nondiabetic animal models. Our results, by contrast, were obtained from human coronary arteries of diabetic patients. Importantly, the intimal thickening is regulated by the p27Kip1 (a cyclin dependent kinase inhibitor), which is elevated in quiescent vascular smooth muscle cells and inhibits vascular cell proliferation and cell migration. In humans without DM, a vascular injury such as stent deployment produces degradation of p27Kip1 protein in an mTOR-dependent manner, which induces proliferation and migration allowing stent endothelialization.15 Thus, synergy between MF and mTOR inhibitors may raise levels of p27Kip1, which strongly inhibit strut endothelialization. In contrast, in patients with DM, p27Kip1 messenger ribonucleic acid levels are usually decreased due to an increased activity of the extracellular signal response kinase,15 which promotes neointimal growth regardless of mTOR inhibition (a process known as “resistance to mTOR inhibition”).16 Therefore, although the association of MF + limus-eluting stents may decrease strut endothelialization in nondiabetic mammalians, this effect seems to be not clinically relevant in humans with DM, probably because the levels of p27Kip1 are decreased despite mTOR inhibition.
Our results are consistent with those of a study conducted by Lipinski et al. who found similar rates of stent thrombosis in patients with or without MF in a retrospective cohort of noninsulin-dependent DM patients.17 However, they suggested that the lack of association between MF and stent thrombosis was due to the anti-inflammatory effects of MF, and also because dual antiplatelet therapy may overcome poor endothelialization in cases of MF treatment. Our study, however, has demonstrated that endothelial coverage occurs in human coronary arteries of patients with DM independently of the use of MF.
Insulin-treated patients have been systematically excluded from previous analyses. Thus, our study is also the first to evaluate the effect of MF in ITDM patients (group 3). Insulin-treated patients are usually patients with a longer history of DM and often with a higher degree of insulin-resistance.18,19 Indeed, enhanced neointimal growth may be expected in these patients, and accordingly, not only the risk of stent thrombosis but also of restenosis may be higher.20 Thus, our study separated insulin-treated patients receiving MF from those never treated with insulin. Our results showed no effect of MF on strut coverage regardless of their insulin status and also confirmed worse angiographic outcomes in insulin-treated patients. Of note, the higher angiographic in-segment late loss found in insulin-treated patients was not related to any OCT-derived metrics within the stent. This may suggest that disease progression in stent margins accounts for most of the difference in late loss between insulin-treated and noninsulin treated patients, which may be explained by a DES-induced edge-effect or by the overall diffuse progression of disease which is enhanced in diabetes.
Limitations and StrengthsOur study design has some limitations. This study is a posthoc analysis of a randomized trial designed to compare 2 different DES. The sample size was calculated based on a different hypothesis, and MF was not randomly assigned. Therefore, the results should be interpreted with caution.
However, our study has also some strengths. First, the population was prospectively included and followed up, and data were exhaustively collected and checked by an external contract research organization; second, because glucose-lowering agents were prescribed in our study by a local endocrinologist according to the current recommendations rather than randomly assigned, the conclusions of the present study may be more representative of a real population of diabetic patients.
CONCLUSIONSMetformin use does not impair endothelial healing of DES in patients with both insulin- and noninsulin treated-diabetes mellitus. According to these results, MF use should not be discouraged in these patients.
FUNDINGThis study was funded by the Spanish Heart Foundation and the Spanish Society of Cardiology (Madrid, Spain).
CONFLICTS OF INTERESTThe Spanish Heart Foundation has received an unrestricted grant from Biomenco, a company that distributes Alvimedica products in Spain.
- –
Metformin and mTOR inhibitors eluted by most DES (such as sirolimus or everolimus) share convergent signaling pathways.
- –
Previous preclinical studies have shown a significant reduction in stent endothelization in nondiabetic animals treated with MF.
- –
The effect of MF on strut endothelialization in humans has not previously been evaluated by intracoronary imaging.
- –
The present study is the first to evaluate the role of MF in the endothelialization of DES in humans by intravascular imaging.
- –
Metformin use is not associated with impaired neointimal healing of DES in humans with both insulin- and noninsulin-treated diabetes mellitus.