Intensive glucose control with insulin in patients with an acute coronary syndrome reduces platelet reactivity during hospitalization, compared to conventional control. However, the effect of strict, long-term glucose control on platelet reactivity in these patients remains uncertain.
MethodsThis is a prospective, randomized trial evaluating the effects of optimized glucose control (target glucose, 80-120mg/dL) with insulin, compared with conventional control (target glucose, <180 mg/dL), on platelet reactivity after hospital discharge in patients with an acute coronary syndrome and hyperglycemia. The primary endpoint was assessment of platelet aggregation after stimulation with adenosine diphosphate 20 μM at 12-month follow-up.
ResultsOne hundred four patients were randomized to optimized management (n=53) or conventional management (n=51). There were no differences between groups in baseline characteristics or platelet function. After 12 months of follow-up, blood glucose levels were significantly lower in the optimized treatment group (104 vs 119 mg/dL; P<.001). However, platelet aggregation following adenosine diphosphate 20 μM stimulation showed no differences between the groups (54.2% [14.3%] vs 55.1% [18.3%] respectively; P=.81). There were no significant differences for other platelet function tests.
ConclusionsLong-term optimized glucose control with insulin in patients with an acute coronary syndrome did not result in a reduction in platelet reactivity compared to conventional control.
Keywords
Patients with an acute coronary syndrome (ACS) and hyperglycemia have an increased risk of experiencing new cardiovascular events at both the long and short term.1–4 Greater platelet reactivity has been documented in patients with hyperglycemia,5 and it has been proposed that, among other factors, platelet activation could play a fundamental role in this clinical context.
Although it has not been established that intensive treatment to reduce glucose levels results in a decrease in cardiovascular events,6–11 our group recently demonstrated that rigorous control with insulin in ACS patients with hyperglycemia decreases platelet reactivity during the hospitalization phase.12 Furthermore, the poorer the patients’ glucose control had been before the coronary event, the greater the reduction was seen to be.13
Outside the acute phase, studies that have evaluated protocols for strict glucose control at long term have yielded discordant clinical results.14–19 For that reason, the current clinical practice guidelines recommend a less rigorous target for blood glucose control (HbA1c<7%).20 Patients with chronic ischemic heart disease and hyperglycemia also show increased platelet reactivity, which is associated with a poorer prognosis.21 Nonetheless, the effect of strict glucose control on platelet reactivity is uncertain.
In this study, the impact on platelet reactivity of implementing an optimized protocol for glucose control with insulin is compared with that of a conventional protocol.
METHODSStudy DesignThe CHIPS12 (Management of Hyperglycaemia and Platelet Activity in Patients With Acute Coronary Syndrome) study is a randomized, single-center trial that evaluated the impact of allocation to an intensive protocol with intravenous insulin for blood glucose control on platelet reactivity in ACS patients with hyperglycemia. The details and results of the first randomization phase of this trial were recently published.12,13
For the present long-term study, at the time of hospital discharge patients were again randomized 1:1 to an optimized treatment protocol for glucose control (target glucose value, 80-120 mg/dL) or to conventional treatment (target glucose value, <180 mg/dL). The optimized management consisted of follow-up in the hospital diabetes mellitus unit by endocrinologists with expertise in diabetes mellitus. Patients in this group received ultra-slow insulin by protocol, together with rapid-acting insulin with meals. Conventional management consisted of follow-up by primary care physicians, who sent patients to a general endocrinologist or not, at their discretion. Glucose levels were measured with the capillary blood glucose test (Accu-Chek Sensor®; Roche, Mannheim, Germany).
As to the management of ACS, all participants received the treatment currently recommended in clinical practice guidelines, except when there were contraindications.20,22,23 The study was carried out in accordance with the Declaration of Helsinki and was approved by the ethics committee of our hospital. All patients gave written consent for participation in the study.
The primary endpoint of the study was defined as the reduction in platelet aggregation following stimulation with 20 μM adenosine diphosphate (ADP), evaluated at 12 months after ACS. Secondary endpoints were the reductions in platelet function occurring with other parameters of aggregation and activation, and the incidence of cardiovascular events.
Platelet Function AnalysisFor the study of platelet function, blood samples were collected by forearm venipuncture. A total blood volume of approximately 30mL was extracted at baseline (at the time of hospital discharge and before randomization) and at 12 months after treatment. The first 3 mL of sample was discarded to avoid spontaneous platelet activation. All samples were analyzed within 1 h after collection by investigators blinded to the assigned intervention group.
Platelet AggregationPlatelet aggregation was assessed by turbidimetric light transmission aggregometry using platelet-rich plasma24 on a dual-channel instrument (IZASA, Chrono-Log, Model 490). Various platelet agonists were used as stimuli: ADP at 5 and 20 μM (primary endpoint of the study), collagen at 6 μg/mL, epinephrine at 20 μM, and thrombin receptor activating peptide at 25 μM. Platelet-rich plasma was obtained by centrifuging citrated blood at 800 rpm for 10min and was kept at 37°C for 20 min before use. Platelet-poor plasma was obtained by a second centrifugation of the remaining blood at 2500 rpm for 10 min. When platelet count in platelet-rich plasma was outside the desired range, it was adjusted to 250000/μL by dilution with autologous plasma. Analysis of aggregation was performed by adjusting the aggregometer with platelet-rich plasma as the reference of 0% light transmission (0% aggregation) and platelet-poor plasma as the reference of 100% transmission and measuring the increase in light transmission through a platelet-rich plasma suspension during 5min with constant shaking, then incubation at 37°C in the presence of a platelet agonist.
Platelet Reactivity IndexActivation of platelet receptor P2Y12 was analyzed using the platelet reactivity index, which was determined by evaluation of the intracellular platelet protein according to previously reported protocols.25 Briefly, vasodilator-stimulated phosphoprotein phosphorylation was measured by flow cytometry (Coulter EPICS XL- MCLTM and System IITM software; Coulter, Miami, Florida, United States) using a monoclonal antibody-labeled commercial kit (Biocytex Inc.; Marseille, France). The platelet reactivity index was calculated after adding prostaglandin E1 (PGE1) and PGE1+ADP, then measuring the mean fluorescence intensity of vasodilator-stimulated phosphoprotein phosphorylation. PGE1 increases vasodilator-stimulated phosphoprotein phosphorylation through adenylate cyclase stimulation, while ADP binding to purinergic receptors leads to its inhibition. Thus, addition of ADP to PGE1-stimulated platelets reduces the concentration of PGE1-induced phosphorylated vasodilator-stimulated phosphoprotein. On this basis, elevation of the platelet reactivity index indicates upregulation of the activating mechanisms of P2Y12 receptors.
P-selectin Expression and IIb/IIIa Glycoprotein ActivationActivated glycoprotein (GP) IIb/IIIa receptor expression on the platelet surface was evaluated using PAC-1 antibodies (conjugated PAC1-FITC, Becton Dickinson; Rutherford, New Jersey, United States), as previously described.26 P-selectin expression was analyzed using phycoerythrin-conjugated anti-CD62P antibody (0.3 mg/mL; Becton Dickinson, San Jose, California, United States). Both receptors were evaluated before and after addition of 10 μM ADP. Samples were analyzed within 2h by flow cytometry (Coulter EPICS XL- MCLTM, System IITM software; Coulter, Miami, Florida, United States). Platelet activation was expressed as the percentage of platelets positive for bound antibodies.
Statistical AnalysisNormal distribution of the variables was confirmed with the Kolmogorov-Smirnov test. Quantitative variables that met the condition of normality are expressed as the mean (standard deviation), and non-normal variables as the median [interquartile range]. Categorical variables are expressed as frequencies and percentages. In all cases, we tested the distribution of the variable against theoretical models and tested the assumption of homogeneity of variances. Associations between categorical variables were determined with the chi-square test or the Fisher exact test when at least 25% of the values showed an expected frequency<5. The Student t test was used to compare quantitative variables with 2 categories. The nonparametric Mann-Whitney U test was used for variables with non-normal distribution. Associations between quantitative variables were examined with the Pearson correlation coefficient. Differences with a probability error≤5% (P≤.05) were considered significant. Data analysis was performed with SPSS, version 15.0 (SPSS Inc.; Chicago, Illinois, United States).
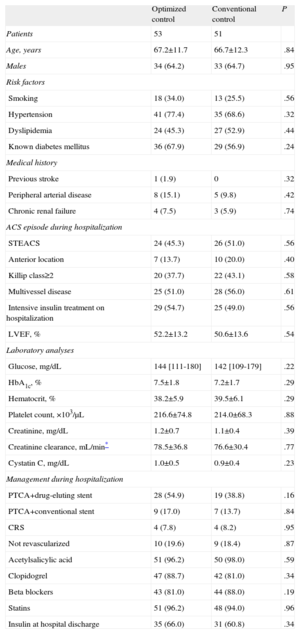
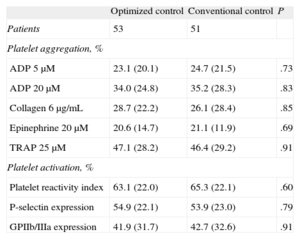
RESULTSOf the 115 patients randomized for the CHIPS study, 5 died during hospitalization and 6 chose not to continue in the study at the time of the second randomization. A total of 104 patients were randomized at hospital discharge to optimized treatment (n=53) or conventional treatment (n=51). The patients’ baseline characteristics, including demographic variables, clinical characteristics, laboratory data, and angiographic findings are shown in Table 1. There were no significant differences between the groups for any of the variables evaluated, including the analysis of platelet function at hospital discharge (Table 2).
Clinical Characteristics by Treatment Group
| Optimized control | Conventional control | P | |
| Patients | 53 | 51 | |
| Age, years | 67.2±11.7 | 66.7±12.3 | .84 |
| Males | 34 (64.2) | 33 (64.7) | .95 |
| Risk factors | |||
| Smoking | 18 (34.0) | 13 (25.5) | .56 |
| Hypertension | 41 (77.4) | 35 (68.6) | .32 |
| Dyslipidemia | 24 (45.3) | 27 (52.9) | .44 |
| Known diabetes mellitus | 36 (67.9) | 29 (56.9) | .24 |
| Medical history | |||
| Previous stroke | 1 (1.9) | 0 | .32 |
| Peripheral arterial disease | 8 (15.1) | 5 (9.8) | .42 |
| Chronic renal failure | 4 (7.5) | 3 (5.9) | .74 |
| ACS episode during hospitalization | |||
| STEACS | 24 (45.3) | 26 (51.0) | .56 |
| Anterior location | 7 (13.7) | 10 (20.0) | .40 |
| Killip class≥2 | 20 (37.7) | 22 (43.1) | .58 |
| Multivessel disease | 25 (51.0) | 28 (56.0) | .61 |
| Intensive insulin treatment on hospitalization | 29 (54.7) | 25 (49.0) | .56 |
| LVEF, % | 52.2±13.2 | 50.6±13.6 | .54 |
| Laboratory analyses | |||
| Glucose, mg/dL | 144 [111-180] | 142 [109-179] | .22 |
| HbA1c, % | 7.5±1.8 | 7.2±1.7 | .29 |
| Hematocrit, % | 38.2±5.9 | 39.5±6.1 | .29 |
| Platelet count, ×103/μL | 216.6±74.8 | 214.0±68.3 | .88 |
| Creatinine, mg/dL | 1.2±0.7 | 1.1±0.4 | .39 |
| Creatinine clearance, mL/min* | 78.5±36.8 | 76.6±30.4 | .77 |
| Cystatin C, mg/dL | 1.0±0.5 | 0.9±0.4 | .23 |
| Management during hospitalization | |||
| PTCA+drug-eluting stent | 28 (54.9) | 19 (38.8) | .16 |
| PTCA+conventional stent | 9 (17.0) | 7 (13.7) | .84 |
| CRS | 4 (7.8) | 4 (8.2) | .95 |
| Not revascularized | 10 (19.6) | 9 (18.4) | .87 |
| Acetylsalicylic acid | 51 (96.2) | 50 (98.0) | .59 |
| Clopidogrel | 47 (88.7) | 42 (81.0) | .34 |
| Beta blockers | 43 (81.0) | 44 (88.0) | .19 |
| Statins | 51 (96.2) | 48 (94.0) | .96 |
| Insulin at hospital discharge | 35 (66.0) | 31 (60.8) | .34 |
ACS, acute coronary syndrome; CRS, coronary revascularization surgery; HbA1c, glycohemoglobin; LVEF, left ventricular ejection fraction; PTCA, percutaneous transluminal coronary angioplasty; STEACS: ST segment elevation acute coronary syndrome.
Values are presented as no. (%), mean±standard deviation or median [interquartile range].
Analysis of Baseline Platelet Function (Hospital Discharge)
| Optimized control | Conventional control | P | |
| Patients | 53 | 51 | |
| Platelet aggregation, % | |||
| ADP 5μM | 23.1 (20.1) | 24.7 (21.5) | .73 |
| ADP 20μM | 34.0 (24.8) | 35.2 (28.3) | .83 |
| Collagen 6μg/mL | 28.7 (22.2) | 26.1 (28.4) | .85 |
| Epinephrine 20μM | 20.6 (14.7) | 21.1 (11.9) | .69 |
| TRAP 25μM | 47.1 (28.2) | 46.4 (29.2) | .91 |
| Platelet activation, % | |||
| Platelet reactivity index | 63.1 (22.0) | 65.3 (22.1) | .60 |
| P-selectin expression | 54.9 (22.1) | 53.9 (23.0) | .79 |
| GPIIb/IIIa expression | 41.9 (31.7) | 42.7 (32.6) | .91 |
ADP, adenosine diphosphate; GPIIb/IIIa, glucoprotein IIb/IIIa; TRAP, thrombin receptor activating peptide.
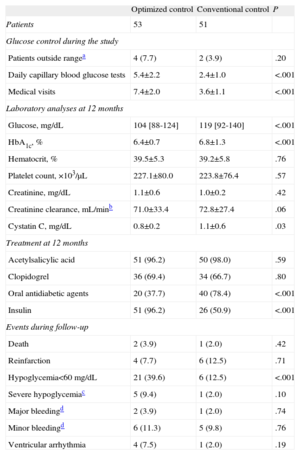
Management of hyperglycemia during the one-year follow-up, treatment administered, and adverse events recorded are summarized in Table 3. Patients assigned to optimized treatment had a larger number of daily capillary blood glucose tests and were more thoroughly monitored (P<.001). Optimized treatment resulted in better glucose control at 12 months than did conventional treatment (104 vs 119 mg/dL; P<.001), and better metabolic control, as assessed by HbA1c values (6.4 [0.7] vs 6.8 [1.3] mg/dL; P<.001). Furthermore, with optimized management, there was a smaller decline in renal function than with conventional management. This was best seen with cystatin C measurements (0.8 [0.2] vs 1.1 [0.6]; P=.03).
Long-Term Management and Cardiovascular Events According to Treatment Group
| Optimized control | Conventional control | P | |
| Patients | 53 | 51 | |
| Glucose control during the study | |||
| Patients outside rangea | 4 (7.7) | 2 (3.9) | .20 |
| Daily capillary blood glucose tests | 5.4±2.2 | 2.4±1.0 | <.001 |
| Medical visits | 7.4±2.0 | 3.6±1.1 | <.001 |
| Laboratory analyses at 12 months | |||
| Glucose, mg/dL | 104 [88-124] | 119 [92-140] | <.001 |
| HbA1c, % | 6.4±0.7 | 6.8±1.3 | <.001 |
| Hematocrit, % | 39.5±5.3 | 39.2±5.8 | .76 |
| Platelet count, ×103/μL | 227.1±80.0 | 223.8±76.4 | .57 |
| Creatinine, mg/dL | 1.1±0.6 | 1.0±0.2 | .42 |
| Creatinine clearance, mL/minb | 71.0±33.4 | 72.8±27.4 | .06 |
| Cystatin C, mg/dL | 0.8±0.2 | 1.1±0.6 | .03 |
| Treatment at 12 months | |||
| Acetylsalicylic acid | 51 (96.2) | 50 (98.0) | .59 |
| Clopidogrel | 36 (69.4) | 34 (66.7) | .80 |
| Oral antidiabetic agents | 20 (37.7) | 40 (78.4) | <.001 |
| Insulin | 51 (96.2) | 26 (50.9) | <.001 |
| Events during follow-up | |||
| Death | 2 (3.9) | 1 (2.0) | .42 |
| Reinfarction | 4 (7.7) | 6 (12.5) | .71 |
| Hypoglycemia<60mg/dL | 21 (39.6) | 6 (12.5) | <.001 |
| Severe hypoglycemiac | 5 (9.4) | 1 (2.0) | .10 |
| Major bleedingd | 2 (3.9) | 1 (2.0) | .74 |
| Minor bleedingd | 6 (11.3) | 5 (9.8) | .76 |
| Ventricular arrhythmia | 4 (7.5) | 1 (2.0) | .19 |
HbA1c, glycohemoglobin.
Values are expressed as no. (%), mean±standard deviation, or median [interquartile range].
There were no differences between the groups with regard to antiplatelet treatment, but hyperglycemia management did differ. A larger percentage of patients were treated with insulin instead of oral antidiabetic agents in the group receiving optimized treatment. As to adverse events, a larger number of patients with optimized management presented with episodes of hypoglycemia (glucose level<60mg/dL), but there were no significant differences between the groups in the percentage of episodes of severe hypoglycemia (9.4% vs 2.0%; P=.10).
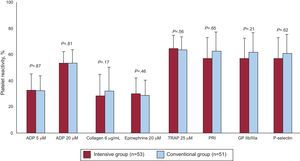
Analysis of Platelet Function During Follow-UpThe results of platelet function analysis at 12 months of treatment are shown in the Figure. There were no significant differences between optimized and conventional treatment regarding the primary endpoint of the study: percentage (standard deviation) of platelet aggregation following stimulation with 20 μM of ADP (54.2% [14.3%] vs 55.1% [18.3%]; P=.81). Nor were there differences for the remaining parameters analyzed: ADP 5 μM (34.0% [15.6%] vs 33.4% [15.8%]; P=.87), collagen 6 μg/mL (29.1% [23.1%] vs 37.2% [22.9%]; P=.17), epinephrin 20 μM (32.9% [15.0%] vs 30.1% [16.1%]; P=.46), thrombin receptor-activating peptide 25 μM (67.6% [12.5%] vs 65.8% [14.3%]; P=.56), platelet reactivity index (59.3% [22.1%] vs 64.2 [22.6%]; P=.44), GPIIb/IIIa expression (60.1% [16.7%] vs 65.5% [19.2%]; P=.21), and P-selectin expression (61.0% [23.7%] vs 63.5% [23.4%]; P=.65).
DISCUSSION
This is the first study to evaluate a protocol for intensive long-term glucose control in patients with hyperglycemia who experienced an ACS. Although it has been demonstrated that diabetic patients present elevated platelet reactivity,5 and that greater platelet reactivity leads to a higher incidence of cardiovascular events at long term,21 we did not detect, according to any of the tests used, a significant reduction in platelet function after implementation of an intensive protocol with insulin.
Several hypotheses may explain why our study did not show significant differences between the two treatment groups. First, the study patients exhibited acceptable control of carbohydrate metabolism at the time of inclusion, with HbA1c at <8% in both arms. It is known that the benefits of reducing platelet reactivity with intensive insulin treatment are greater in patients with poorer prior glucose control; therefore, the overall benefit might be smaller in our study.13 Second, although a statistically significant reduction was documented, glucose levels in both treatment groups were adequate, with a between-group absolute difference of 15 mg/dL. In the DIGAMI-2 study, the difference obtained between the two treatment groups was 16 mg/dL; this is one of the reasons the authors cite to explain the absence of significant differences between the treatments.16
However, the present study indicates that a more aggressive long-term protocol for glucose control slows microvascular injury. Optimized control was observed to reduce impairment of renal function. It is interesting that cystatin C was the parameter that best illustrated renal damage, even more than creatinine clearance or plasma creatinine values. This finding acquires considerable relevance in clinical practice, since it has been demonstrated that cystatin C is an independent prognostic marker in patients with an ACS.29 There is greater controversy in the literature over whether an intensive protocol for glucose control can reduce macrovascular injury. The latest studies have yielded contradictory results, even showing an increase in mortality in patients with intensive control. In some of these studies, it seems that the higher rate of cardiovascular events encountered is mainly due to the degree to which glucose is decreased and to the episodes of hypoglycemia. In fact, various recent meta-analyses of the results of large clinical trials have confirmed a reduction in the incidence of myocardial infarction with intensive treatment, but no decrease in overall mortality.30–32 In our study there were no significant differences in the number of cardiovascular events, and although the incidence of hypoglycemia episodes was higher, there were no significant differences in the number of symptomatic episodes or those reaching levels of <40 mg/dL.
LimitationsAlthough this is a randomized trial, it was conducted in a single center. The study lacks power to detect possible differences in adverse events, mainly severe episodes of hypoglycemia. Nonetheless, despite these limitations, the robustness of the methods and statistical analysis lends support to the results obtained.
CONCLUSIONSIntensive long-term glucose control with insulin in ACS patients with hyperglycemia does not reduce platelet hyperactivity in comparison with conventional treatment. Nonetheless, implementation of an aggressive protocol for long-term outpatient management of hyperglycemia in patients with ACS is feasible and potentially safe, with a low percentage of hypoglycemia episodes, and could decrease progression of renal impairment when compared to a conventional protocol.
FUNDINGThis study was funded by an unrestricted grant from FIC (Fundación Interhospitalaria para la Investigación Cardiovascular) (Madrid, Spain; CIF G-81563801).
CONFLICTS OF INTERESTNone declared.