Heart failure management programs reduce hospitalizations. Some studies also show reduced mortality. The determinants of program success are unknown. The aim of the present study was to update our understanding of the reductions in mortality and readmissions produced by these programs, elucidate their components, and identify the factors determining program success.
MethodsSystematic literature review (1990-2014; PubMed, EMBASE, CINAHL, Cochrane Library) and manual search of relevant journals. The studies were selected by 3 independent reviewers. Methodological quality was evaluated in a blinded manner by an external researcher (Jadad scale). These results were pooled using random effects models. Heterogeneity was evaluated with the I2 statistic, and its explanatory factors were determined using metaregression analysis.
ResultsOf the 3914 studies identified, 66 randomized controlled clinical trials were selected (18 countries, 13 535 patients). We determined the relative risks to be 0.88 for death (95% confidence interval [95%CI], 0.81-0.96; P < .002; I2, 6.1%), 0.92 for all-cause readmissions (95%CI, 0.86-0.98; P < .011; I2, 58.7%), and 0.80 for heart failure readmissions (95%CI, 0.71-0.90; P < .0001; I2, 52.7%). Factors associated with program success were implementation after 2001, program location outside the United States, greater baseline use of angiotensin-converting enzyme inhibitors/angiotensin receptor blockers, a higher number of intervention team members and components, specialized heart failure cardiologists and nurses, protocol-driven education and its assessment, self-monitoring of signs and symptoms, detection of deterioration, flexible diuretic regimen, early care-seeking among patients and prompt health care response, psychosocial intervention, professional coordination, and program duration.
ConclusionsWe confirm the reductions in mortality and readmissions with heart failure management programs. Their success is associated with various structural and intervention variables.
Keywords
The prevalence of heart failure (HF) is increasing, reaching > 10% in individuals older than 70 years.1–3
It is the main cause of hospitalization in persons older than 65 years.1 Heart failure has a considerable impact on health care systems and comprises about 2.5% of overall health care expenditure,1 mainly due to admissions. However, the cost attributable to informal care, typically provided by women in Spain, represents the largest part of the overall health care cost (59.1%-69.8%).4 The disease has a marked impact on the quality of life of patients and their caregivers.4,5
Patients with HF are complex and of advanced age. Their considerable number of comorbidities and readmissions affect their clinical treatment and prognosis.1,2
Many of the admissions are considered avoidable.1,2 Because numerous meta-analyses6–23 and 1 metareview24 have shown that HF management programs significantly reduce the number of readmissions, these approaches are recommended in European clinical practice guidelines (I-A).2
Nonetheless, these meta-analyses reviewed a limited number of studies, which were, moreover, heterogeneous in terms of populations studied, their characteristics and usual care, geographical area, and health care system. The extraordinarily complex interventions are frequently scarcely described. Thus, it is difficult to evaluate which characteristics and clinical contexts favor program success and could be used to guide the organization of the different health care systems when setting priorities. Some meta-analyses have studied certain characteristics indispensable for success14,16 in a limited number of studies. Numerous meta-analyses11,14–16,19–24 and recent articles25–27 have mentioned the need to explore all of these elements in greater depth.
The objectives of this systematic review were the following: a) to update our understanding of the effectiveness of HF management programs not using remote monitoring while accurately describing the type of patient, the organization and contents of the intervention, and their ability to reduce mortality and readmissions, and b) to identify the determinants of program success.
METHODSDesignThe study design is detailed in the .
We performed a systematic review and meta-analysis of randomized controlled trials (RCT) assessing hospital admissions and/or mortality in HF management programs involving multifactorial interventions and not using remote monitoring methods apart from telephones.
Our methodology adopted the CONSORT (Consolidated Standards of Reporting Trials)1 and AHA (American Heart Association) Taxonomy2 guidelines to evaluate the sociodemographic and clinical characteristics of the population undergoing the intervention, organizational aspects of the health care team, program intensity, mode of health care delivery, and type of follow-up, and the precise contents of the interventions and usual care.
This meta-analysis adhered to the recommendations of the PRISMA (Preferred Reporting Items for Systematic reviews and Meta-Analysis) statement.3
Electronic databases—PubMed, EMBASE, CINAHL, and Cochrane Library—were searched from January 1990 to December 2014. In addition, we reviewed the main journals publishing articles on the topic of interest and the bibliography of the retrieved systematic reviews and meta-analyses. The databases consulted and the search strategy used are detailed in the .
We included RCT published in English, Spanish, French, or German with data on mortality and/or all-cause readmissions or HF readmissions.
Telemedicine/telecare studies were excluded because they have been the subject of specific studies and their inclusion would increase heterogeneity; moreover, because of the high prevalence and high degree of clinical and psychosocial comorbidities in HF patients, this type of health care cannot be offered in a widespread manner. However, we included studies that only involved telephone contact because telephones are typically available to almost all types of patients.
We also excluded medication studies (except for those analyzing drug titration and optimization), those studying multiple diseases, and those that were not multifactorial (eg, only examining exercise or a single technique). Nonetheless, we included 3 multifactorial studies whose intervention included cardiac rehabilitation of patients with HF.
Study Selection and Data ExtractionThree reviewers (M. J. Oyanguren Artola, J. Torcal Laguna, and P. M. Latorre García) independently analyzed the available information sources. At least 2 of the authors separately analyzed the full texts of the studies using predefined selection sheets. Any disagreements were resolved through discussion and, if the disagreement persisted, with the participation of the third author.
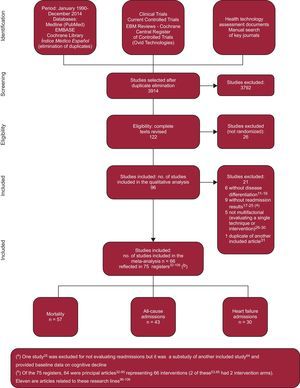
Article screening (Figure 1) identified a total of 96 publications on RCT, with 21 meeting at least 1 exclusion criterion () and 75 corresponding to 66 randomized trials, reflected in 64 articles (), including 2 studies with 2 intervention arms, and a further 11 related articles ().
.")
An external researcher and at least 2 members of the team conducted a blind evaluation of the methodological quality of the selected studies according to the Jadad criteria.4 All of the selected studies scored at least 3 on the Jadad scale: 29 studies (43.9%) achieved 5 points; 23 (34.85%), 4 points; and 14 (21.21%), 3 points. The Jadad scale is described in the .
Statistical AnalysisThe STATA Metaprop5 procedure was used for variables expressing proportions. This approach determined the pooled estimate of the proportion and its exact confidence intervals using the binomial test.
A random effects model (DerSimonian and Laird) was used to pool the results. This model takes into account variability among studies and within each study.6 We also calculated the 95% confidence intervals (95%CIs) of the model. For the intervals, the relative risks (RRs) were calculated from the tabulated data of the individual studies selected, as well as the differences in the risks and their 95%CIs for mortality, all-cause admissions, and HF admissions. We also calculated the numbers of patients needed to treat (NNTs)7 using the metannt procedure (STATA version 11).
To estimate and quantify the heterogeneity among the different studies, Cochran's Q test and I2 statistic were used, with values of 25%, 50%, and 75% corresponding to low, moderate, and high degrees of heterogeneity, respectively.8 The possible existence of a publication bias9 was visually explored using a funnel plot comparing the effects of the studies (RRs) with their standard errors10 ().
Any studies containing more than 2 treatment arms were considered 2 studies with 2 separate arms and the values of the control group were halved to avoid its double weighting.7
A metaregression analysis was performed using the metareg procedure of STATA (version 11) to examine how much the different intervention components and study characteristics could explain the heterogeneity of the treatment effect between studies.
Two univariable metaregression analyses considering each factor separately were performed, as well as multivariable metaregressions considering all factors simultaneously. Both approaches gave similar results for the associations between treatment effects and study characteristics.
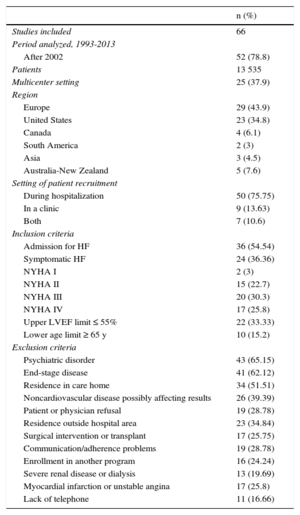
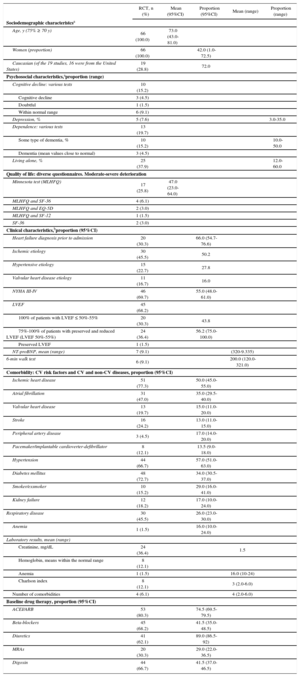
RESULTSDescription of the ProgramsA description of the studies according to the study period, country, whether they were multicenter studies or not, sample size, place of recruitment, and inclusion and exclusion criteria is shown in Table 1 (). In addition, we evaluated the sociodemographic, psychosocial, and clinical characteristics of the study patients (Table 2) (). The patients were mainly older and male, with an advanced New York Heart Association (NYHA) functional class, reduced left ventricular ejection fraction (LVEF), and considerable cardiovascular and noncardiovascular comorbidity.
Characteristics of the Studies of Heart Failure Management Programs*
| n (%) | |
|---|---|
| Studies included | 66 |
| Period analyzed, 1993-2013 | |
| After 2002 | 52 (78.8) |
| Patients | 13 535 |
| Multicenter setting | 25 (37.9) |
| Region | |
| Europe | 29 (43.9) |
| United States | 23 (34.8) |
| Canada | 4 (6.1) |
| South America | 2 (3) |
| Asia | 3 (4.5) |
| Australia-New Zealand | 5 (7.6) |
| Setting of patient recruitment | |
| During hospitalization | 50 (75.75) |
| In a clinic | 9 (13.63) |
| Both | 7 (10.6) |
| Inclusion criteria | |
| Admission for HF | 36 (54.54) |
| Symptomatic HF | 24 (36.36) |
| NYHA I | 2 (3) |
| NYHA II | 15 (22.7) |
| NYHA III | 20 (30.3) |
| NYHA IV | 17 (25.8) |
| Upper LVEF limit ≤ 55% | 22 (33.33) |
| Lower age limit ≥ 65 y | 10 (15.2) |
| Exclusion criteria | |
| Psychiatric disorder | 43 (65.15) |
| End-stage disease | 41 (62.12) |
| Residence in care home | 34 (51.51) |
| Noncardiovascular disease possibly affecting results | 26 (39.39) |
| Patient or physician refusal | 19 (28.78) |
| Residence outside hospital area | 23 (34.84) |
| Surgical intervention or transplant | 17 (25.75) |
| Communication/adherence problems | 19 (28.78) |
| Enrollment in another program | 16 (24.24) |
| Severe renal disease or dialysis | 13 (19.69) |
| Myocardial infarction or unstable angina | 17 (25.8) |
| Lack of telephone | 11 (16.66) |
HF, heart failure; LVEF, left ventricular ejection fraction; NYHA, New York Heart Association; %, the percentage of studies including the characteristic studied was calculated as n × 100/66 (total number of RCTs included in the meta-analysis).
Pooled Data of the Characteristics of the Patients in the Heart Failure Management Programs ()
| RCT, n (%) | Mean (95%CI) | Proportion (95%CI) | Mean (range) | Proportion (range) | |
|---|---|---|---|---|---|
| Sociodemographic characteristcsa | |||||
| Age, y (75% ≥ 70 y) | 66 (100.0) | 73.0 (43.0-81.0) | |||
| Women (proportion) | 66 (100.0) | 42.0 (1.0-72.5) | |||
| Caucasian (of the 19 studies, 16 were from the United States) | 19 (28.8) | 72.0 | |||
| Psychosocial characteristics,aproportion (range) | |||||
| Cognitive decline: various tests | 10 (15.2) | ||||
| Cognitive decline | 3 (4.5) | ||||
| Doubtful | 1 (1.5) | ||||
| Within normal range | 6 (9.1) | ||||
| Depression, % | 5 (7.6) | 3.0-35.0 | |||
| Dependence: various tests | 13 (19.7) | ||||
| Some type of dementia, % | 10 (15.2) | 10.0-50.0 | |||
| Dementia (mean values close to normal) | 3 (4.5) | ||||
| Living alone, % | 25 (37.9) | 12.0-60.0 | |||
| Quality of life: diverse questionnaires. Moderate-severe deterioration | |||||
| Minnesota test (MLHFQ) | 17 (25.8) | 47.0 (23.0-64.0) | |||
| MLHFQ and SF-36 | 4 (6.1) | ||||
| MLHFQ and EQ-5D | 2 (3.0) | ||||
| MLHFQ and SF-12 | 1 (1.5) | ||||
| SF-36 | 2 (3.0) | ||||
| Clinical characteristics,bproportion (95%CI) | |||||
| Heart failure diagnosis prior to admission | 20 (30.3) | 66.0 (54.7-76.6) | |||
| Ischemic etiology | 30 (45.5) | 50.2 | |||
| Hypertensive etiology | 15 (22.7) | 27.8 | |||
| Valvular heart disease etiology | 11 (16.7) | 16.0 | |||
| NYHA III-IV | 46 (69.7) | 55.0 (48.0-61.0) | |||
| LVEF | 45 (68.2) | ||||
| 100% of patients with LVEF ≤ 50%-55% | 20 (30.3) | 43.8 | |||
| 75%-100% of patients with preserved and reduced LVEF (LVEF 50%-55%) | 24 (36.4) | 56.2 (75.0-100.0) | |||
| Preserved LVEF | 1 (1.5) | ||||
| NT-proBNP, mean (range) | 7 (9.1) | (320-9.335) | |||
| 6-min walk test | 6 (9.1) | 200.0 (120.0-321.0) | |||
| Comorbidity: CV risk factors and CV and non-CV diseases, proportion (95%CI) | |||||
| Ischemic heart disease | 51 (77.3) | 50.0 (45.0-55.0) | |||
| Atrial fibrillation | 31 (47.0) | 35.0 (29.5-40.0) | |||
| Valvular heart disease | 13 (19.7) | 15.0 (11.0-20.0) | |||
| Stroke | 16 (24.2) | 13.0 (11.0-15.0) | |||
| Peripheral artery disease | 3 (4.5) | 17.0 (14.0-20.0) | |||
| Pacemaker/implantable cardioverter-defibrillator | 8 (12.1) | 13.5 (9.0-18.0) | |||
| Hypertension | 44 (66.7) | 57.0 (51.0-63.0) | |||
| Diabetes mellitus | 48 (72.7) | 34.0 (30.5-37.0) | |||
| Smoker/exsmoker | 10 (15.2) | 29.0 (16.0-41.0) | |||
| Kidney failure | 12 (18.2) | 17.0 (10.0-24.0) | |||
| Respiratory disease | 30 (45.5) | 26.0 (23.0-30.0) | |||
| Anemia | 1 (1.5) | 16.0 (10.0-24.0) | |||
| Laboratory results, mean (range) | |||||
| Creatinine, mg/dL | 24 (36.4) | 1.5 | |||
| Hemoglobin, means within the normal range | 8 (12.1) | ||||
| Anemia | 1 (1.5) | 16.0 (10-24) | |||
| Charlson index | 8 (12.1) | 3 (2.0-6.0) | |||
| Number of comorbidities | 4 (6.1) | 4 (2.0-6.0) | |||
| Baseline drug therapy, proportion (95%CI) | |||||
| ACEI/ARB | 53 (80.3) | 74.5 (69.5-79.5) | |||
| Beta-blockers | 45 (68.2) | 41.5 (35.0-48.5) | |||
| Diuretics | 41 (62.1) | 89.0 (86.5-92) | |||
| MRAs | 20 (30.3) | 29.0 (22.0-36.5) | |||
| Digoxin | 44 (66.7) | 41.5 (37.0-46.5) | |||
95%CI, 95% confidence interval; ACEI, angiotensin-converting enzyme inhibitors; ARB, angiotensin II receptor blockers; CV, cardiovascular; LVEF, left ventricular ejection fraction; MRAs, mineralocorticoid receptor antagonists; NYHA, New York Heart Association functional class; RCT, randomized controlled trials.
The percentage of studies including the characteristic studied was calculated as n × 100 / 66 (total number of RCT included in the meta-analysis). Proportion: pooled estimate of the proportion; 95%CI: confidence interval of the proportion (exact values from the binomial test). Mean: pooled estimate of the mean of the numerical variables and 95%CI of the estimate or range, as appropriate.
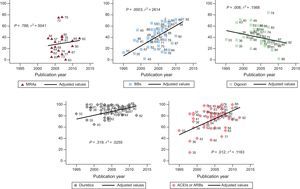
There was increased use over time of angiotensin-converting enzyme inhibitors (ACEIs)/angiotensin receptor blockers (ARBs) (P < .012) and beta-blockers (P < .003) and reduced use of digoxin (P < .008), with a wide variability in drug use among the different studies (Figure 2).
 in the different studies according to the year of publication. Data reported by the publications at the start of the study. The straight line represents the mean value estimated from a regression model for each of the drugs. The numbers signify individual studies. ACEIs, angiotensin-converting enzyme inhibitors; ARBs, angiotensin receptor blockers; BBs, beta-blockers; MRAs, mineralocorticoid receptor antagonists.")
Percentage of drug use (BBs, ACEIs/ARBs, MRAs, diuretics, and digoxin) in the different studies according to the year of publication. Data reported by the publications at the start of the study. The straight line represents the mean value estimated from a regression model for each of the drugs. The numbers signify individual studies. ACEIs, angiotensin-converting enzyme inhibitors; ARBs, angiotensin receptor blockers; BBs, beta-blockers; MRAs, mineralocorticoid receptor antagonists.
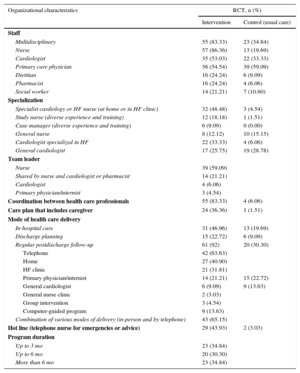
The intervention organization is shown in Table 3, and the definitions used are shown in the ). We analyzed the professionals dedicated to the programs and their degree of specialization, the mode of health care delivery, and the program intensity. In total, 83% of the programs were multidisciplinary, with interprofessional coordination and consensus-based/protocol-driven patient treatment. However, only 34.8% of the usual care involved 2 or more team members, and only 6% reported to coordination or planning systems. Nurses participated in 86% of the programs, cardiologists in 53%, and primary care physicians in 54%. The nurses were specialized in cardiology or HF in 48% of the programs and worked in a HF clinic or in the home setting in equal proportions; the cardiologists were specialized in HF in 33% (the professional duties are defined in the ). The program duration was proportionally distributed into < 3 months, 3-6 months, and > 6 months.
Organizational Characteristics: Pooled Data of the Organization of the Heart Failure Management Programs
| Organizational characteristics | RCT, n (%) | |
|---|---|---|
| Intervention | Control (usual care) | |
| Staff | ||
| Multidisciplinary | 55 (83.33) | 23 (34.84) |
| Nurse | 57 (86.36) | 13 (19.69) |
| Cardiologist | 35 (53.03) | 22 (33.33) |
| Primary care physician | 36 (54.54) | 39 (59.09) |
| Dietitian | 16 (24.24) | 6 (9.09) |
| Pharmacist | 16 (24.24) | 4 (6.06) |
| Social worker | 14 (21.21) | 7 (10.60) |
| Specialization | ||
| Specialist cardiology or HF nurse (at home or in HF clinic) | 32 (48.48) | 3 (4.54) |
| Study nurse (diverse experience and training) | 12 (18.18) | 1 (1.51) |
| Case manager (diverse experience and training) | 6 (9.09) | 0 (0.00) |
| General nurse | 8 (12.12) | 10 (15.15) |
| Cardiologist specialized in HF | 22 (33.33) | 4 (6.06) |
| General cardiologist | 17 (25.75) | 19 (28.78) |
| Team leader | ||
| Nurse | 39 (59.09) | |
| Shared by nurse and cardiologist or pharmacist | 14 (21.21) | |
| Cardiologist | 4 (6.06) | |
| Primary physician/internist | 3 (4.54) | |
| Coordination between health care professionals | 55 (83.33) | 4 (6.06) |
| Care plan that includes caregiver | 24 (36.36) | 1 (1.51) |
| Mode of health care delivery | ||
| In-hospital care | 31 (46.96) | 13 (19.69) |
| Discharge planning | 15 (22.72) | 6 (9.09) |
| Regular postdischarge follow-up | 61 (92) | 20 (30.30) |
| Telephone | 42 (63.63) | |
| Home | 27 (40.90) | |
| HF clinic | 21 (31.81) | |
| Primary physician/internist | 14 (21.21) | 15 (22.72) |
| General cardiologist | 6 (9.09) | 9 (13.63) |
| General nurse clinic | 2 (3.03) | |
| Group intervention | 3 (4.54) | |
| Computer-guided program | 9 (13.63) | |
| Combination of various modes of delivery (in-person and by telephone) | 43 (65.15) | |
| Hot line (telephone nurse for emergencies or advice) | 29 (43.93) | 2 (3.03) |
| Program duration | ||
| Up to 3 mo | 23 (34.84) | |
| Up to 6 mo | 20 (30.30) | |
| More than 6 mo | 23 (34.84) | |
HF, heart failure; RCT, randomized controlled trials.
The number (percentage) of the studies including the characteristic studied was calculated as n × 100 / 66 (total number of RCT included in the meta-analysis). Data from the original studies are in
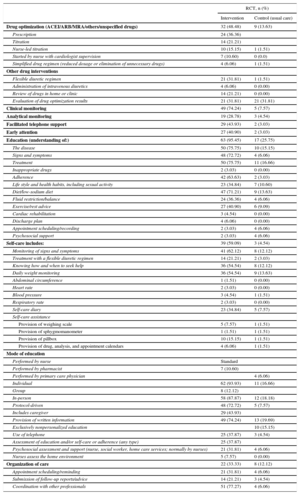
The intervention content during hospitalization was similar in the 2 groups, except in 10 studies. These latter studies included a supplementary evaluation that could involve medication, diet, exercise, or psychosocial aspects and postdischarge requirements. From this evaluation, a comprehensive discharge plan, as well as an appointment schedule and contact details, was frequently developed for the patient; this information was relayed to other community-based health care professionals and social workers. Nurses, and occasionally pharmacists, began educating the patients and family members during the patients’ hospitalization. We analyzed postdischarge drug optimization and clinical monitoring, the content and mode of self-care education, psychosocial aspects, and program coordination are shown in Table 4 (, ).
Intervention Characteristics: Pooled Data of the Main Intervention Contents of the Heart Failure Management Programs
| RCT, n (%) | ||
|---|---|---|
| Intervention | Control (usual care) | |
| Drug optimization (ACEI/ARB/MRA/others/unspecified drugs) | 32 (48.48) | 9 (13.63) |
| Prescription | 24 (36.36) | |
| Titration | 14 (21.21) | |
| Nurse-led titration | 10 (15.15) | 1 (1.51) |
| Started by nurse with cardiologist supervision | 7 (10.60) | 0 (0.0) |
| Simplified drug regimen (reduced dosage or elimination of unnecessary drugs) | 4 (6.06) | 1 (1.51) |
| Other drug interventions | ||
| Flexible diuretic regimen | 21 (31.81) | 1 (1.51) |
| Administration of intravenous diuretics | 4 (6.06) | 0 (0.00) |
| Review of drugs in home or clinic | 14 (21.21) | 0 (0.00) |
| Evaluation of drug optimization results | 21 (31.81) | 21 (31.81) |
| Clinical monitoring | 49 (74.24) | 5 (7.57) |
| Analytical monitoring | 19 (28.78) | 3 (4.54) |
| Facilitated telephone support | 29 (43.93) | 2 (3.03) |
| Early attention | 27 (40.90) | 2 (3.03) |
| Education (understanding of:) | 63 (95.45) | 17 (25.75) |
| The disease | 50 (75.75) | 10 (15.15) |
| Signs and symptoms | 48 (72.72) | 4 (6.06) |
| Treatment | 50 (75.75) | 11 (16.66) |
| Inappropriate drugs | 2 (3.03) | 0 (0.00) |
| Adherence | 42 (63.63) | 2 (3.03) |
| Life style and health habits, including sexual activity | 23 (34.84) | 7 (10.60) |
| Diet/low-sodium diet | 47 (71.21) | 9 (13.63) |
| Fluid restriction/balance | 24 (36.36) | 4 (6.06) |
| Exercise/rest advice | 27 (40.90) | 6 (9.09) |
| Cardiac rehabilitation | 3 (4.54) | 0 (0.00) |
| Discharge plan | 4 (6.06) | 0 (0.00) |
| Appointment scheduling/recording | 2 (3.03) | 4 (6.06) |
| Psychosocial support | 2 (3.03) | 4 (6.06) |
| Self-care includes: | 39 (59.09) | 3 (4.54) |
| Monitoring of signs and symptoms | 41 (62.12) | 8 (12.12) |
| Treatment with a flexible diuretic regimen | 14 (21.21) | 2 (3.03) |
| Knowing how and when to seek help | 36 (54.54) | 8 (12.12) |
| Daily weight monitoring | 36 (54.54) | 9 (13.63) |
| Abdominal circumference | 1 (1.51) | 0 (0.00) |
| Heart rate | 2 (3.03) | 0 (0.00) |
| Blood pressure | 3 (4.54) | 1 (1.51) |
| Respiratory rate | 2 (3.03) | 0 (0.00) |
| Self-care diary | 23 (34.84) | 5 (7.57) |
| Self-care assistance | ||
| Provision of weighing scale | 5 (7.57) | 1 (1.51) |
| Provision of sphygmomanometer | 1 (1.51) | 1 (1.51) |
| Provision of pillbox | 10 (15.15) | 1 (1.51) |
| Provision of drug, analysis, and appointment calendars | 4 (6.06) | 1 (1.51) |
| Mode of education | ||
| Performed by nurse | Standard | |
| Performed by pharmacist | 7 (10.60) | |
| Performed by primary care physician | 4 (6.06) | |
| Individual | 62 (93.93) | 11 (16.66) |
| Group | 8 (12.12) | |
| In-person | 58 (87.87) | 12 (18.18) |
| Protocol-driven | 48 (72.72) | 5 (7.57) |
| Includes caregiver | 29 (43.93) | |
| Provision of written information | 49 (74.24) | 13 (19.69) |
| Exclusively nonpersonalized education | 10 (15.15) | |
| Use of telephone | 25 (37.87) | 3 (4.54) |
| Assessment of education and/or self-care or adherence (any type) | 25 (37.87) | |
| Psychosocial assessment and support (nurse, social worker, home care services; normally by nurses) | 21 (31.81) | 4 (6.06) |
| Nurses assess the home environment | 5 (7.57) | 0 (0.00) |
| Organization of care | 22 (33.33) | 8 (12.12) |
| Appointment scheduling/reminding | 21 (31.81) | 4 (6.06) |
| Submission of follow-up reports/advice | 14 (21.21) | 3 (4.54) |
| Coordination with other professionals | 51 (77.27) | 4 (6.06) |
ACEIs, angiotensin-converting enzyme inhibitors; ARBs, angiotensin receptor blockers; MRAs, mineralocorticoid receptor antagonists; RCT, randomized controlled trials.
The number (percentage) of studies including the characteristic studied is calculated by n × 100 / 66 (total number of RCT included in the meta-analysis). Data of the original studies are in
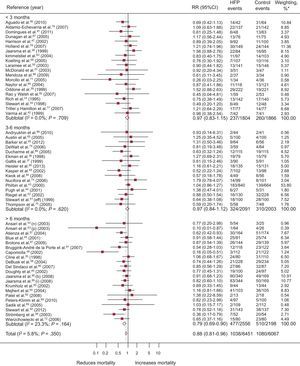
A total of 57 RCT evaluated mortality; of these, 4 showed a significantly positive result (Figure 3). Compared with 16.7% (95%CI, 14.3%-19.2%; I2, 87.4%) of the control group, 13.7% (95%CI, 11.4%-15.9%; I2, 89%) of the intervention group died, with a difference in risk of death of –2.1% (95%CI, –3.4% to –1.0%; P < .0004; I2, 16.6%) attributable to the programs and RR=0.88 (95%CI, 0.81-0.96; P < .002; I2, 6.1%); in other words, there was a relative mortality reduction of 12% associated with the programs, with a NNT = 20 (95%CI, 14-36) for programs longer than 6 months (). Heterogeneity was low.
 meta-analysis on the effects of heart failure management programs on mortality stratified by intervention duration. 95%CI, 95% confidence interval; HFP, heart failure program; RR, relative risk. *Study weight, random effects model.")
Forest plot showing the results of a random effects (DerSimonian and Laird) meta-analysis on the effects of heart failure management programs on mortality stratified by intervention duration. 95%CI, 95% confidence interval; HFP, heart failure program; RR, relative risk. *Study weight, random effects model.
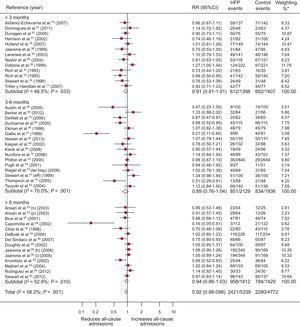
A total of 43 RCT evaluated all-cause admissions, with 9 obtaining a significantly positive result (Figure 4). Compared with 49.5% (95%CI, 45.1%-51.3%; I2, 89.9%) of the control group, 44.5% (95%CI, 37.9%-51.1%; I2, 96.7%) of the patients in the intervention group were admitted at least once, with a difference in risk of admission of –4.8% (95%CI, –8% to –1.5%; P < .004; I2, 63.5%) attributable to the programs and RR = 0.92 (95%CI, 0.86-0.98; P < .011; I2, 58.7%); this corresponded to a relative reduction in all-cause admission of 8% associated with the programs, with NNT = 29 in studies longer than 6 months. Heterogeneity was moderate.
 meta-analysis on the effects of heart failure management programs on all-cause admissions stratified by intervention duration. 95%CI, 95% confidence interval; HFP, heart failure program; RR, relative risk. *Study weight, random effects model.")
Forest plot showing the results of a random effects (DerSimonian and Laird) meta-analysis on the effects of heart failure management programs on all-cause admissions stratified by intervention duration. 95%CI, 95% confidence interval; HFP, heart failure program; RR, relative risk. *Study weight, random effects model.
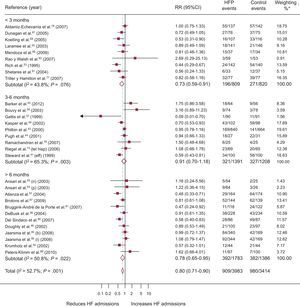
A total of 30 RCT recorded HF admissions, with 8 obtaining a significantly positive result (Figure 5). Compared with 30% (95%CI, 24%-35.9%; I2, 95.10%) of the controls, 23.5% (95%CI, 18.9%-28.1%; I2, 93.7%) of the patients of the intervention group were admitted at least once, with a difference in risk of admission of –5.6% (95%CI, –9% to –2.2%; P < .001; I2, 67.8%) attributable to the programs and RR = 0.80 (95%CI, 0.71-0.90; P < .0001; I2, 52.7%); this comprised a relative reduction in HF admissions of 20% associated with the programs, with NNT = 11 (95%CI, 8-20) in studies shorter than 3 months and NNT = 17 (95%CI, 12-35) in those longer than 6 months. Heterogeneity was moderate.
 meta-analysis on the effects of heart failure management programs on heart failure admissions stratified by intervention duration. 95%CI, 95% confidence interval; HF, heart failure; HFP, heart failure program; RR, relative risk. *Study weight, random effects model.")
Forest plot showing the results of a random effects (DerSimonian and Laird) meta-analysis on the effects of heart failure management programs on heart failure admissions stratified by intervention duration. 95%CI, 95% confidence interval; HF, heart failure; HFP, heart failure program; RR, relative risk. *Study weight, random effects model.
Analyses of the effects of the programs according to the setting of the intervention are shown in and indicate that the programs were effective in both the clinic and in the home setting or in a combination of these.
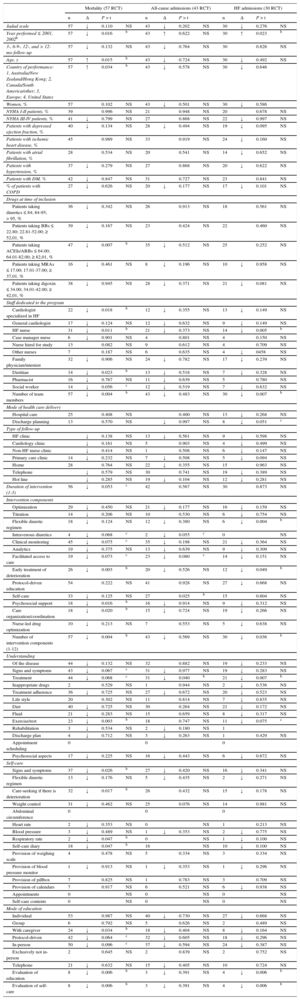
Determinants of the ResultsThe main characteristics of the HF management programs significantly associated with reduced mortality and/or reduced all-cause or HF admissions (Table 5) () were the following: year of performance 2002 or later, a country other than the United States, main baseline use of ACEI/ARB, and an inverse relationship between patient age and mortality.
Factors Related to the Success of Heart Failure Management Programs. Results of the Metaregression Analysisa
| Mortality (57 RCT) | All-cause admissions (43 RCT) | HF admissions (30 RCT) | ||||||||||
|---|---|---|---|---|---|---|---|---|---|---|---|---|
| n | Δ | P > t | n | Δ | P > t | n | Δ | P > t | ||||
| Jadad scale | 57 | ↓ | 0.110 | NS | 43 | ↓ | 0.202 | NS | 30 | ↓ | 0.276 | NS |
| Year performed ≤ 2001, 2002b | 57 | ↓ | 0.016 | b | 43 | ↑ | 0.622 | NS | 30 | ↑ | 0.023 | b |
| 3-, 6-9-, 12-, and > 12-mo follow-up | 57 | ↓ | 0.132 | NS | 43 | ↓ | 0.764 | NS | 30 | 0.826 | NS | |
| Age, y | 57 | ↑ | 0.015 | b | 43 | ↓ | 0.724 | NS | 30 | ↓ | 0.492 | NS |
| Country of performance: 1, Australia/New Zealand/Hong Kong; 2, Canada/South America/other; 3, Europe; 4, United States | 57 | ↑ | 0.034 | b | 43 | ↓ | 0.578 | NS | 30 | ↓ | 0.646 | |
| Women, % | 57 | 0.102 | NS | 43 | ↓ | 0.501 | NS | 30 | ↓ | 0.586 | ||
| NYHA I-II patients, % | 39 | 0.996 | NS | 21 | 0.948 | NS | 20 | 0.678 | NS | |||
| NYHA III-IV patients, % | 41 | ↓ | 0.799 | NS | 27 | 0.868 | NS | 22 | ↓ | 0.997 | NS | |
| Patients with depressed ejection fraction, % | 40 | ↓ | 0.134 | NS | 28 | ↓ | 0.494 | NS | 19 | ↓ | 0.095 | NS |
| Patients with ischemic heart disease, % | 45 | 0.989 | NS | 33 | 0.919 | NS | 24 | ↓ | 0.160 | NS | ||
| Patients with atrial fibrillation, % | 28 | 0.534 | NS | 20 | 0.541 | NS | 14 | ↓ | 0.652 | NS | ||
| Patients with hypertension, % | 37 | ↓ | 0.279 | NS | 27 | 0.868 | NS | 20 | ↓ | 0.622 | NS | |
| Patients with DM, % | 42 | ↓ | 0.847 | NS | 31 | 0.727 | NS | 23 | 0.841 | NS | ||
| % of patients with COPD | 27 | ↓ | 0.626 | NS | 20 | ↓ | 0.177 | NS | 17 | ↓ | 0.101 | NS |
| Drugs at time of inclusion | ||||||||||||
| Patients taking diuretics ≤ 84; 84-95; > 95, % | 36 | ↓ | 0.342 | NS | 26 | 0.913 | NS | 18 | 0.561 | NS | ||
| Patients taking BBs ≤ 22.80; 22.81-52.00; ≥ 52,01, % | 39 | ↓ | 0.167 | NS | 23 | 0.424 | NS | 22 | 0.460 | NS | ||
| Patients taking ACEIs/ARBs ≤ 64.00; 64.01-82.00; ≥ 82,01, % | 47 | ↓ | 0.007 | b | 35 | ↓ | 0.512 | NS | 25 | 0.252 | NS | |
| Patients taking MRAs ≤ 17.00; 17.01-37.00; ≥ 37,01, % | 16 | ↓ | 0.461 | NS | 8 | ↓ | 0.196 | NS | 10 | ↓ | 0.958 | NS |
| Patients taking digoxin ≤ 34.00; 34.01-42.00; ≥ 42,01, % | 38 | ↓ | 0.945 | NS | 28 | ↓ | 0.371 | NS | 21 | ↓ | 0.081 | NS |
| Staff dedicated to the program | ||||||||||||
| Cardiologist specialized in HF | 22 | ↓ | 0.018 | b | 12 | ↓ | 0.355 | NS | 13 | ↓ | 0.149 | NS |
| General cardiologist | 17 | ↓ | 0.124 | NS | 12 | ↓ | 0.632 | NS | 9 | ↓ | 0.149 | NS |
| HF nurse | 31 | ↓ | 0.011 | b | 21 | ↓ | 0.373 | NS | 14 | ↓ | 0.005 | b |
| Case manager nurse | 6 | ↓ | 0.901 | NS | 4 | 0.801 | NS | 4 | 0.150 | NS | ||
| Nurse hired for study | 13 | 0.082 | NS | 9 | 0.612 | NS | 4 | 0.709 | NS | |||
| Other nurses | 7 | 0.187 | NS | 6 | 0.635 | NS | 4 | ↓ | 0458 | NS | ||
| Family physician/internist | 32 | ↓ | 0.906 | NS | 24 | ↓ | 0.782 | NS | 17 | ↓ | 0.239 | NS |
| Dietitian | 14 | ↓ | 0.023 | b | 13 | ↓ | 0.518 | NS | 7 | ↓ | 0.328 | NS |
| Pharmacist | 16 | ↓ | 0.767 | NS | 11 | ↓ | 0.639 | NS | 5 | 0.780 | NS | |
| Social worker | 14 | ↓ | 0.056 | c | 12 | ↓ | 0.519 | NS | 7 | ↓ | 0.632 | NS |
| Number of team members | 57 | ↓ | 0.004 | b | 43 | ↓ | 0.483 | NS | 30 | ↓ | 0.007 | b |
| Mode of health care delivery | ||||||||||||
| Hospital care | 25 | 0.408 | NS | 0.400 | NS | 13 | ↓ | 0.268 | NS | |||
| Discharge planning | 13 | 0.570 | NS | ↓ | 0.997 | NS | 8 | ↓ | 0.051 | c | ||
| Type of follow-up | ||||||||||||
| HF clinic | ↓ | 0.138 | NS | 13 | ↓ | 0.561 | NS | 9 | ↓ | 0.598 | NS | |
| Cardiology clinic | ↓ | 0.161 | NS | 5 | 0.903 | NS | 4 | ↓ | 0.499 | NS | ||
| Non-HF nurse clinic | ↓ | 0.414 | NS | 1 | 0.508 | NS | 6 | ↓ | 0.147 | NS | ||
| Primary care clinic | 14 | ↓ | 0.232 | NS | 7 | ↓ | 0.508 | NS | 5 | ↓ | 0.094 | NS |
| Home | 28 | 0.764 | NS | 22 | ↓ | 0.355 | NS | 15 | 0.963 | NS | ||
| Telephone | ↓ | 0.579 | NS | 30 | 0.741 | NS | 19 | ↓ | 0.389 | NS | ||
| Hot line | ↓ | 0.285 | NS | 19 | ↓ | 0.104 | NS | 12 | ↓ | 0.281 | NS | |
| Duration of intervention (1-3) | 56 | ↓ | 0.053 | c | 42 | 0.567 | NS | 30 | 0.873 | NS | ||
| Intervention components | ||||||||||||
| Optimization | 29 | ↓ | 0.450 | NS | 21 | ↓ | 0.177 | NS | 16 | ↓ | 0.159 | NS |
| Titration | 14 | ↓ | 0.206 | NS | 10 | 0.530 | NS | 6 | ↓ | 0.754 | NS | |
| Flexible diuretic regimen | 18 | ↓ | 0.124 | NS | 12 | ↓ | 0.380 | NS | 6 | ↓ | 0.004 | b |
| Intravenous diuretics | 4 | ↓ | 0.068 | c | 2 | ↓ | 0.055 | c | 0 | NS | ||
| Clinical monitoring | 45 | ↓ | 0.075 | c | 35 | ↓ | 0.198 | NS | 21 | ↓ | 0.364 | NS |
| Analytics | 19 | ↓ | 0.375 | NS | 13 | ↓ | 0.639 | NS | 9 | ↓ | 0.309 | NS |
| Facilitated access to care | 19 | ↓ | 0.073 | c | 23 | ↓ | 0.080 | c | 14 | ↓ | 0.151 | NS |
| Early treatment of deterioration | 26 | ↓ | 0.003 | b | 20 | ↓ | 0.526 | NS | 12 | ↓ | 0.049 | b |
| Protocol-driven education | 54 | 0.222 | NS | 41 | 0.928 | NS | 27 | ↓ | 0.668 | NS | ||
| Self-care | 33 | ↓ | 0.125 | NS | 27 | 0.025 | b | 15 | 0.604 | NS | ||
| Psychosocial support | 18 | ↓ | 0.016 | b | 16 | ↓ | 0.914 | NS | 9 | ↓ | 0.312 | NS |
| Care organization/coordination | 18 | ↓ | 0.020 | b | 15 | ↓ | 0.724 | NS | 19 | ↓ | 0.266 | NS |
| Nurse-led drug optimization | 10 | ↓ | 0.213 | NS | 7 | 0.553 | NS | 5 | ↓ | 0.638 | NS | |
| Number of intervention components (1-12) | 57 | ↓ | 0.004 | b | 43 | ↓ | 0.569 | NS | 30 | ↓ | 0.036 | b |
| Understanding | ||||||||||||
| Of the disease | 44 | ↓ | 0.132 | NS | 32 | 0.882 | NS | 19 | ↓ | 0.233 | NS | |
| Signs and symptoms | 43 | ↓ | 0.067 | c | 31 | ↓ | 0.977 | NS | 19 | ↓ | 0.283 | NS |
| Treatment | 44 | ↓ | 0.068 | c | 31 | ↓ | 0.040 | b | 21 | ↓ | 0.007 | b |
| Inappropriate drugs | 2 | 0.529 | NS | 1 | 0.944 | NS | 2 | ↓ | 0.536 | NS | ||
| Treatment adherence | 36 | ↓ | 0.725 | NS | 27 | ↓ | 0.672 | NS | 20 | ↓ | 0.523 | NS |
| Life style | 20 | 0.302 | NS | 11 | 0.814 | NS | 7 | ↓ | 0.835 | NS | ||
| Diet | 40 | ↓ | 0.725 | NS | 30 | 0.264 | NS | 21 | ↓ | 0.172 | NS | |
| Fluid | 21 | ↓ | 0.283 | NS | 15 | 0.659 | NS | 8 | ↓ | 0.317 | NS | |
| Exercise/rest | 23 | ↓ | 0.003 | b | 18 | 0.747 | NS | 11 | ↓ | 0.075 | c | |
| Rehabilitation | 3 | ↓ | 0.534 | NS | 2 | ↓ | 0.180 | NS | 1 | |||
| Discharge plan | 4 | ↓ | 0.712 | NS | 3 | ↓ | 0.263 | NS | 1 | 0.429 | NS | |
| Appointment scheduling | 0 | 0 | 0 | |||||||||
| Psychosocial aspects | 17 | ↓ | 0.225 | NS | 16 | ↓ | 0.443 | NS | 6 | ↓ | 0.672 | NS |
| Self-care | ||||||||||||
| Signs and symptoms | 37 | ↓ | 0.026 | b | 27 | ↓ | 0.420 | NS | 16 | ↓ | 0.341 | NS |
| Flexible diuretic regimen | 13 | ↓ | 0.176 | NS | 5 | ↓ | 0.435 | NS | 2 | ↓ | 0.271 | NS |
| Care-seeking if there is deterioration | 32 | ↓ | 0.017 | b | 26 | 0.432 | NS | 15 | ↓ | 0.178 | NS | |
| Weight control | 31 | ↓ | 0.462 | NS | 25 | 0.076 | NS | 14 | 0.981 | NS | ||
| Abdominal circumference | 0 | 0 | 0 | |||||||||
| Heart rate | 2 | ↓ | 0.353 | NS | 0 | NS | 1 | 0.213 | NS | |||
| Blood pressure | 3 | ↓ | 0.489 | NS | 1 | ↓ | 0.353 | NS | 2 | ↓ | 0.775 | NS |
| Respiratory rate | 2 | ↓ | 0.047 | b | 0 | NS | 1 | ↓ | 0.100 | NS | ||
| Self-care diary | 18 | ↓ | 0.047 | b | 16 | NS | 10 | ↓ | 0.100 | NS | ||
| Provision of weighing scale | 4 | 0.478 | NS | 5 | 0.334 | NS | 3 | 0.334 | NS | |||
| Provision of blood pressure monitor | 1 | ↓ | 0.913 | NS | 1 | ↓ | 0.353 | NS | 1 | ↓ | 0.296 | NS |
| Provision of pillbox | 7 | 0.825 | NS | 1 | 0.783 | NS | 3 | 0.709 | NS | |||
| Provision of calendars | 7 | 0.917 | NS | 6 | 0.521 | NS | 6 | ↓ | 0.938 | NS | ||
| Appointments | 0 | NS | 0 | NS | 0 | NS | ||||||
| Self-care contents | 0 | NS | 0 | NS | 0 | NS | ||||||
| Mode of education | ||||||||||||
| Individual | 53 | 0.987 | NS | 40 | ↓ | 0.730 | NS | 27 | ↓ | 0.668 | NS | |
| Group | 6 | 0.792 | NS | 5 | 0.626 | NS | 2 | 0.489 | NS | |||
| With caregiver | 24 | ↓ | 0.034 | b | 18 | ↓ | 0.404 | NS | 8 | ↓ | 0.164 | NS |
| Protocol-driven | 42 | ↓ | 0.064 | c | 32 | ↓ | 0.605 | NS | 18 | ↓ | 0.296 | NS |
| In-person | 50 | ↓ | 0.096 | c | 37 | ↓ | 0.594 | NS | 24 | ↓ | 0.387 | NS |
| Exclusively not in-person | 2 | 0.645 | NS | 2 | 0.839 | NS | 2 | 0.752 | NS | |||
| Telephone | 21 | ↓ | 0.632 | NS | 15 | ↓ | 0.405 | NS | 10 | 0.724 | NS | |
| Evaluation of education | 8 | ↓ | 0.006 | b | 3 | ↓ | 0.391 | NS | 4 | ↓ | 0.006 | b |
| Evaluation of self-care | 8 | ↓ | 0.006 | b | 3 | ↓ | 0.391 | NS | 4 | ↓ | 0.006 | b |
↓, reduced relative risk between the RCT that refer to the factor and those that do not; ACEIs, angiotensin-converting enzyme inhibitors; ARBs, angiotensin receptor blockers; BBs, beta-blockers; COPD, chronic obstructive pulmonary disease; DM, diabetes mellitus; EF, ejection fraction; HF, heart failure; MRAs, mineralocorticoid receptor antagonists; NS, not significant; NYHA, New York Heart Association; RCT, randomized controlled trials.
In the case of drugs, the variable was collected in the percentage of patients using the medication; the tertiles have been considered for the analysis.
Regarding the organizational characteristics, the number of members of the multidisciplinary team, specialist HF cardiologist and nurse, and a duration > 6 months were significantly associated with positive outcomes, although an intervention < 3 months was significant.
Finally, the intervention contents were associated with reduced mortality and/or fewer admissions for all-causes and for HF: the number of components evaluated in this meta-analysis, including the flexible diuretic regimen, early treatment of deterioration, psychosocial aspects, care organization and coordination, self-monitoring of signs and symptoms and early care-seeking if there was deterioration, keeping a self-care diary, understanding of the treatment, exercise, psychosocial aspects, and coordination of care, as well as appropriate evaluation of education and self-care and inclusion of caregivers.
The following also reduced the risk of mortality and/or readmissions, without reaching statistical significance: drug optimization, titration, administration of intravenous diuretics, and clinical and analytical monitoring.
DISCUSSIONThe present study of 66 RCT performed in 18 countries and including 13 553 patients is the largest study of this type so far. Previous comparable meta-analyses published between 2004 and 2012 (19 in total) evaluated between 6 and 35 RCT. Our study included 16 trials published between 2005 and 2013 not included in the previous meta-analyses ().
This meta-analysis confirmed the reduction in all-cause and HF admissions and showed that HF programs reduce mortality.
Our results on mortality reduction agree with those of 6 previous meta-analyses6,11,13,14,17,21; another 6 studies9,10,15,18,19,23 showed favorable nonsignificant tendencies and another8 showed neutral results, although the trials included in this last analysis were performed before 2001. One meta-analysis7 showed a reduction in the combination of mortality and readmissions, another 3 studies12,16,20 did not analyze pooled mortality and found a significant reduction in 3, 4, and 1 studies, respectively, and 1 study22 did not evaluate mortality. The metareview by Savard et al.24 did not combine meta-analyses but found significant reductions in 6 of 13 meta-analyses and nonsignificant but favorable tendencies in the remainder.
The reduction in all-cause readmissions concurs with the results of 13 meta-analyses.6–9,11–15,18,21–23 Another meta-analysis10 (which only included 6 trials from 1998 to 2003) showed a nonsignificant tendency toward a reduction, and another20 only found significant differences in reduced admissions in 2 of 8 studies due to their heterogeneity. Four meta-analyses12,16,19,20 did not provide pooled data, with 1 of these16 showing a reduction in the combination of readmissions and mortality in 8 management programs and, finally, 1 meta-analysis17 did not measure all-cause readmissions. In the metareview by Savard et al.,24 10 of the 13 meta-analyses found reductions in all-cause readmissions.
Our HF readmission results agree with those of the 9 meta-analyses evaluating this variable6,7,11,13,15,17,22 and with controlled trials evaluating the impact of pharmacist collaborative care in patients with HF by Koshman et al.18 The case management programs reported by Taylor et al.19 showed tendencies toward a reduction. Koshman et al.18 showed that pharmacist-directed care (without collaborative care) failed to reduce admissions. In the metareview by Savard et al.,24 the 9 meta-analyses measuring changes in HF-related hospitalization found significantly fewer HF readmissions.
Regarding the determinants of readmission and/or mortality reductions produced by the programs, our meta-analysis indicates that study performance in 2002 or later improved the morbidity and mortality results, as in the meta-analysis by Göhler et al.14 The improved results of programs from 2002 onward were associated with greater baseline use of ACEIs and beta-blockers: greater baseline use of ACEIs was a significant determinant of the results, a finding previously reported by Phillips et al.10 and Göhler et al.,14 whereas greater use of beta-blockers was a nonsignificant determinant of the results. Programs performed in the United States also showed worse results than those conducted in other countries. American programs are associated with predominantly home-based care—possibly due to fewer HF clinics or units—a lower proportion of specialist HF cardiologists and nurses, a higher frequency of case managers, and lower percentage of drug optimization, as well as added coordination difficulties due to US health care being delivered almost exclusively by private sector providers.
Most patient characteristics were not significantly associated with the results, as expected, given that the studies comprised RCT with usual care and comparable intervention groups and as previously reported for NYHA and LVEF16 and HF with ischemic etiology or diabetes mellitus.14 In contrast, Göhler et al.14 linked a lower NYHA class to a greater mortality reduction. Similar to these authors, we found an inverse relationship between age and mortality,14 contradicting the analysis by Yu et al.,16 which reported that demographic factors had no effect.
As mentioned in previous meta-analyses, the care team is the main organizational characteristic associated with significantly reduced morbidity and mortality, specifically, the number of members6,13,14 and the specialization of the multidisciplinary team, and the inclusion of specialist HF cardiologists and nurses.6,10,11,13,14,16 Our study also adds dieticians and social workers, although the inclusion of the latter was only nearly significant. A cardiologist not specialized in HF and pharmacist nonsignificantly reduced the risk. Our meta-analysis agrees with the observation of Yu et al.16 that the incorporation of the primary care physician to the specialized HF cardiologist and nurse team could be beneficial and, like the present authors, Whellan et al.12 questioned whether the participation of primary care physicians in these programs could be effective without the participation of specialized HF cardiologist and nurse team.
Programs with home- and clinic-based follow-up significantly reduced admissions for HF, unlike those with telephone care alone.
Our study agrees with previous studies identifying a duration > 6 months as a factor with a significant effect on readmission reduction,14,17,21 although an intervention < 3 months was also significant (this period typically shows more admissions, which may explain its stronger influence). These findings differ from those of Roccaforte et al.,11 who found an association with studies lasting 3-6 months. Similar to Holland et al.,13 we conclude that the study quality does not affect the results, in contrast to Roccaforte et al.,11 who contend that the higher the study quality, the greater the mortality reduction.
Regarding the intervention, we agree with other meta-analyses10,16,21 in finding that the number of intervention components evaluated in our study significantly reduced readmissions or mortality.
The elements of the intervention significantly reducing the risk of mortality and/or readmissions in our meta-analysis were identified in previous studies: flexible diuretic regimen,16 early treatment of deterioration,6,12,16 psychosocial aspects, and care organization and coordination.16
Other elements of the intervention evaluated in this meta-analysis reduced the risk of morbidity and mortality to a greater or lesser extent, although nonsignificantly: clinical and analytical monitoring, easy access to care, intravenous diuretic administration, and drug optimization and titration.16
Although patient education and self-care are considered positive elements of the intervention in numerous meta-analyses,6,15–17,23 our meta-analysis showed that the reduction was generally nonsignificant, despite reducing the risk of morbidity and mortality. However, some education and self-care components were essential for a significant risk reduction: self-monitoring of signs and symptoms and early care-seeking, keeping a self-care diary, understanding of treatment and exercise, psychosocial aspects, and care coordination, as well as education and self-care evaluation and caregiver inclusion. In-person and protocol-driven education was nearly significant. Other education and self-care elements reduced the risk but nonsignificantly, such as understanding of diet and fluid intake and inappropriate drugs, the importance of adherence, the discharge plan, weight control, and use of pillboxes.
The clinical implications of this study are as follows: a) specific programs should be universally introduced for patients with HF, at least for those who have had a hospital admission, because there is sufficient evidence for the implementation of successful programs, which can also be cost-effective by reducing hospital admissions and relieving the social burden of informal care; b) these programs should be implemented in hospital-based HF units, community-based HF clinics, and in the home setting; c) the program design should include at least the factors shown in this meta-analysis to significantly reduce admissions and mortality and those reducing the risk, which are converted into management quality criteria, and d) before the widespread introduction of programs, they should be contextualized, adapted, and tested in each health care system, and their efficacy and manner of implementation should be studied, in conjunction with continual reevaluation with quality indicators.
New high-quality primary studies are required to explore in greater depth the key factors for the success of the programs and their intervention and organizational characteristics through a description of the characteristics of the patients, health care system, and social and geographic context of the programs. Their application should be studied in subgroups with preserved LVEF, women, patients with psychiatric disorders or important comorbidities, and the manner and content of the participation of the primary care physician in the specialized HF cardiologist and nurse teams. Programs including telemonitoring should be studied with the same degree of precision mentioned and their cost-effectiveness should be contrasted with those of programs omitting such methods.
LimitationsThe interventions required interpretation because the studies poorly describe the interventions implemented, their contents, the organization and patient characteristics, and usual care. Most studies also failed to evaluate the direct results of their interventions (eg, degree of drug optimization achieved, knowledge acquired by patients and family members, degree of adherence, and the results of early treatment of decompensations). The education intervention of the HF programs is scarcely described and almost entirely overlooked in the control groups.
The definition of depressed LVEF in some studies is currently obsolete. The definition of admission is imprecise in numerous studies as to whether planned admissions or emergency department visits were included and their minimum duration.
The multifactorial nature of the programs regarding their contents, intensity, type of organization, and patients and the geographical and health care system differences make it difficult to draw definitive conclusions on the characteristics guaranteeing the success of HF management programs in all health care systems.
CONCLUSIONSThe present meta-analysis corroborates in December 2014 the reduction in all-cause and HF admissions of most previous meta-analyses but includes many more RCT (66 in total) and is more up-to-date, in addition to including RCT from Spain. Our work also consolidates the reduced mortality reported in some of these meta-analyses and identifies the determinants of readmission and mortality results.
CONFLICTS OF INTERESTNone declared.
- –
Overall, HF management programs reduce admissions.
- –
Some programs do not obtain such results, for unclear reasons.
- –
Some programs also reduce mortality but others do not, and there are no conclusive general results.
- –
The need to implement HF management programs is undeniable but precise elucidation is required of the determinants of success, specifically, the patient characteristics, intervention contents, and the social, geographical, and health care system organization and program setting.
- –
The present study ratifies in December 2014 the reduction in all-cause and HF admissions and confirms the reduction in mortality with multifactorial programs without telemonitoring.
- –
The study identifies the following significant determinants of readmissions and mortality: multidisciplinary teams with specialist HF nurses and cardiologists; self-monitoring of signs and symptoms; prompt care-seeking and understanding of treatment; protocol-driven education in and self-care and its assessment; flexible diuretic regimen; early treatment of deteriorations; psychosocial intervention; coordination of hospital- and community-based professionals; clinic- and home-based follow-up after discharge; and a duration longer than 6 months.
- –
The following also nonsignificantly reduce the risk of readmissions and mortality: drug optimization, titration, intravenous diuretic administration, and clinical and analytical monitoring.
We thank Dr. Manuel Anguita, from the Department of Cardiology, Hospital Reina Sofía, Córdoba, for his initial review of the meta-analysis.