Microvascular obstruction (MVO) is negatively associated with cardiac structure and worse prognosis after ST-segment elevation myocardial infarction (STEMI). Epithelial cell adhesion molecule (EpCAM), involved in epithelium adhesion, is an understudied area in the MVO setting. We aimed to determine whether EpCAM is associated with the appearance of cardiac magnetic resonance (CMR)-derived MVO and long-term systolic function in reperfused STEMI.
MethodsWe prospectively included 106 patients with a first STEMI treated with percutaneous coronary intervention, quantifying serum levels of EpCAM 24hours postreperfusion. All patients underwent CMR imaging 1 week and 6 months post-STEMI. The independent correlation of EpCAM with MVO, systolic volume indices, and left ventricular ejection fraction was evaluated.
ResultsThe mean age of the sample was 59±13 years and 76% were male. Patients were dichotomized according to median EpCAM (4.48 pg/mL). At 1-week CMR, lower EpCAM was related to extensive MVO (P=.021) and larger infarct size (P=.019). At presentation, EpCAM values were significantly associated with the presence of MVO in univariate (OR, 0.58; 95%CI, 0.38-0.88; P=.011) and multivariate logistic regression models (OR, 0.55; 95%CI, 0.35-0.87; P=.010). Although MVO tends to resolve at chronic phases, decreased EpCAM was associated with worse systolic function: reduced left ventricular ejection fraction (P=.009) and higher left ventricular end-systolic volume (P=.043).
ConclusionsEpCAM is associated with the occurrence of CMR-derived MVO at acute phases and long-term adverse ventricular remodeling post-STEMI.
Keywords
Coronary reperfusion, mainly through percutaneous techniques, markedly diminishes acute mortality after reperfused ST-segment elevation myocardial infarction (STEMI). Despite complete reperfusion at the epicardial level, however, a considerable number of patients (30% to 50%) display abnormal myocardial perfusion.1,2 This phenomenon is known as microvascular obstruction (MVO) and is associated with compromised structure and function as well as with worse prognosis.3,4
Certain baseline characteristics are useful in predicting the extent of MVO upon patient arrival. Indeed, a scoring method including 4 predisposing factors (reperfusion delay, diabetes mellitus, Killip class, and sum of ST-segment elevation) at the initial electrocardiogram has been developed to predict MVO appearance.5 However, soluble biomarkers to predict the extent of MVO are scarce, highlighting a crucial need for novel molecules to gain greater insight into MVO pathophysiology and provide new therapeutic alternatives.
Although several underlying mechanisms act both simultaneously and sequentially in MVO pathophysiology, endothelial abnormalities, decreased capillary density and increased endothelial permeability are particularly important.2,6,7 In this context, epithelial cell adhesion molecule (EpCAM) is found in the basolateral membrane of numerous normal epithelial cells to maintain cell-to-cell adhesion, thus preserving epithelial integrity.8 Despite its promising role in oncology,9 the involvement of this molecule in the cardiovascular scenario is understudied.
The aim of this work was to explore the association of circulating EpCAM determined 24hours after percutaneous coronary intervention with cardiac magnetic resonance (CMR)-derived MVO, as well as with cardiac structure and function within the first 6 months after STEMI.
METHODSStudy populationThis study conformed to the principles for use of human subjects outlined in the Declaration of Helsinki, the study protocol was approved by the local Research Ethics Committee, and written informed consent was obtained from all participants.
We prospectively enrolled patients discharged between July 2013 and December 2017 with the following inclusion criteria: patients with a first STEMI as outlined in current definitions10 treated with percutaneous coronary intervention within 12hours of chest pain onset, and who underwent CMR imaging 1 week and 6 months post-STEMI. Exclusion criteria were death, reinfarction, or clinical instability during the first 6 months postdischarge or any contraindication to CMR.
Biomarker assaysBlood samples were isolated 24hours after coronary revascularization, centrifuged at 2300rpm for 15minutes, and serum was immediately stored at 80°C until further analyses were performed. Serum EpCAM levels were analyzed using the Olink CARDIOVASCULAR III panel (Olink Proteomics, Uppsala, Sweden). The Proximity Extension Assay technology used for the Proseek Multiplex protocol has been described elsewhere11 or in the .
High-sensitivity troponin T (Elecsys TnT assay, Roche Diagnostics, Basel, Switzerland; myocardial infarction diagnosis cutoff> 14 ng/mL) was measured on admission, at 3hours, and at 6- to 8-hour intervals for the first 24hours
White blood cell countsLymphocyte, and eosinophil (x 1000 cells/mL) counts were measured upon patient arrival, and at 12, 24, 48, 72, and 96hours after revascularization using a commercial assay based on cytochemical light scatter and light absorption measurements (ADVIA 120 Hematology System from Siemens Diagnostics, Germany).
Cardiac magnetic resonance studiesTwo CMR studies (1.5 T unit, Magnetom Sonata; Siemens, Erlangen, Germany) were performed at 7 [5-8] days (1-week CMR) and 196 [167-242] days (6-month CMR) after STEMI, in accordance with our laboratory protocol12 and current recommendations. All studies were performed and analyzed by 2 cardiologists specialized in CMR with 15 years of experience, using customized software (QMASS MR 6.1.5, Medis, Leiden, The Netherlands). CMR data were prospectively recorded and immediately included in the database.
Further information about CMR acquisition, sequences and quantification can be consulted elsewhere12,13 or in the .
The interobserver variability for the calculation of traditional CMR indexes used in the present study in our laboratory has been previously reported and is less than 5%.12,13
Endpoints and follow-upCMR-derived MVO at 1 week was selected as the primary endpoint of this study.
The secondary endpoints were the relationship between EpCAM measured at 24hours after percutaneous coronary intervention and long-term ventricular remodeling, as reflected by 6-month left ventricular (LV) ejection fraction (LVEF) and LV end-systolic volume index.
Statistical analysisData were tested for normal distribution using the Kolmogorov–Smirnov test. Continuous normally distributed data are expressed as the mean±standard deviation of the mean and were compared using paired and unpaired Student t tests. Nonparametric data are expressed as the median [interquartile range] and were compared using the Mann-Whitney U test. Group percentages were compared using the chi-square test or the Fisher exact test where appropriate.
A multivariate logistic regression analysis with the forward conditional stepwise method was performed to test the association of baseline characteristics with the presence of MVO at 1 week in the entire study group. All input variables were entered simultaneously to obtain the odds ratio (OR), 95% confidence interval (95%CI) for the variables not independently associated with MVO. For the multivariate regression analysis, all baseline characteristics were chosen. EpCAM was the only index independently associated with the presence of MVO at 1 week.
The association between EpCAM and CMR indices was performed using the Pearson or Spearman correlation test were appropriate.
Discrimination accuracy (c-statistic) for MVO prediction was computed for the EpCAM.
The relationship between EpCAM (pg/mL) and 1-week MVO (% of LV mass), between EpCAM (pg/mL) and 1-week infarct size (% of LV mass), and between EpCAM (pg/mL) and 1-week intramyocardial hemorrhage (number of segments) were analyzed using multivariate linear regression models in the entire study group. For the multivariate regression analyses, all baseline characteristics were chosen as covariates for the adjustment. Next, a reduced and parsimonious model was derived using backward stepwise selection.
The covariates included in the final model for 1-week infarct size were anterior infarction, Thrombolysis in Myocardial Infarction (TIMI) flow grade before percutaneous coronary intervention, high-sensitivity troponin T, and lymphocyte minimum count. For 1-week MVO, TIMI flow grade before PCI and high-sensitivity troponin T were selected in the final model. In the case of 1-week intramyocardial hemorrhage, diabetes mellitus, TIMI flow grade after percutaneous coronary intervention, anterior infarction and time to reperfusion were included in the final model.
The relationship at 6 months between EpCAM (pg/mL) and LVEF (%) and between EpCAM (pg/mL) and LV end-systolic volume index (mL/m2) were analyzed using multivariate linear regression models. All baseline characteristics were chosen as covariates for the adjustment. Next, a reduced and parsimonious model was derived using backward stepwise selection.
The covariates included in the final model for LVEF at 6 months were anterior infarction, TIMI flow grade before percutaneous coronary intervention, minimum lymphocyte count and high-sensitivity troponin T. In the case of 6-month LV end-systolic volume index, minimum lymphocyte count and high-sensitivity troponin T were included in the final model.
Statistical significance was considered for a 2-tailed P <.05. The SPSS statistical package (version 15.0, SPSS Inc., Chicago, Illinois) and STATA (Version 9.0, StataCorp, College Station, Texas) were used throughout.
RESULTSWe prospectively enrolled 127 consecutive patients discharged between July 2013 and December 2017 with inclusion criteria. Exclusion criteria were death (n=2), reinfarction (n=4), or clinical instability (n=4) during the first 6 months postdischarge or any contraindication to CMR (n=11). The final study group comprised 106 STEMI patients. The study patient flowchart is presented in .
The mean age of the sample was 59±13 years, and 81 (76%) were men. The infarct location was anterior in 54 patients (51%), and 20 patients (19%) were in Killip class ≥ II. At 1-week CMR, the median MVO was 0 [0-2.3] % of LV mass and the mean LVEF was 53±11%.
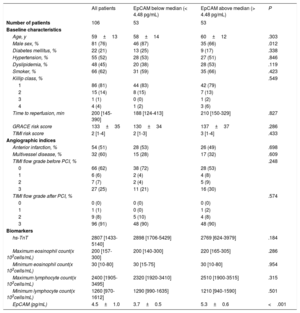
Association of EpCAM with extent of 1-week MVOSerum levels of EpCAM were quantified 24hours after reperfusion, with a median EpCAM of 4.48 pg/mL. The baseline characteristics of patients with EpCAM values below and above median are presented in table 1, showing a higher number of male than female patients with circulating EpCAM below the median.
Baseline characteristics, angiographic indices, and biomarkers of the entire cohort and of patients with EpCAM above or below the median
| All patients | EpCAM below median (< 4.48 pg/mL) | EpCAM above median (> 4.48 pg/mL) | P | |
|---|---|---|---|---|
| Number of patients | 106 | 53 | 53 | |
| Baseline characteristics | ||||
| Age, y | 59±13 | 58±14 | 60±12 | .303 |
| Male sex, % | 81 (76) | 46 (87) | 35 (66) | .012 |
| Diabetes mellitus, % | 22 (21) | 13 (25) | 9 (17) | .338 |
| Hypertension, % | 55 (52) | 28 (53) | 27 (51) | .846 |
| Dyslipidemia, % | 48 (45) | 20 (38) | 28 (53) | .119 |
| Smoker, % | 66 (62) | 31 (59) | 35 (66) | .423 |
| Killip class, % | .549 | |||
| 1 | 86 (81) | 44 (83) | 42 (79) | |
| 2 | 15 (14) | 8 (15) | 7 (13) | |
| 3 | 1 (1) | 0 (0) | 1 (2) | |
| 4 | 4 (4) | 1 (2) | 3 (6) | |
| Time to reperfusion, min | 200 [145-390] | 188 [124-413] | 210 [150-329] | .827 |
| GRACE risk score | 133±35 | 130±34 | 137±37 | .286 |
| TIMI risk score | 2 [1-4] | 2 [1-3] | 3 [1-4] | .433 |
| Angiographic indices | ||||
| Anterior infarction, % | 54 (51) | 28 (53) | 26 (49) | .698 |
| Multivessel disease, % | 32 (60) | 15 (28) | 17 (32) | .609 |
| TIMI flow grade before PCI, % | .248 | |||
| 0 | 66 (62) | 38 (72) | 28 (53) | |
| 1 | 6 (6) | 2 (4) | 4 (8) | |
| 2 | 7 (7) | 2 (4) | 5 (9) | |
| 3 | 27 (25) | 11 (21) | 16 (30) | |
| TIMI flow grade after PCI, % | .574 | |||
| 0 | 0 (0) | 0 (0) | 0 (0) | |
| 1 | 1 (1) | 0 (0) | 1 (2) | |
| 2 | 9 (8) | 5 (10) | 4 (8) | |
| 3 | 96 (91) | 48 (90) | 48 (90) | |
| Biomarkers | ||||
| hs-TnT | 2807 [1433-5140] | 2898 [1706-5429] | 2769 [624-3979] | .184 |
| Maximum eosinophil count(x 103cells/mL) | 200 [157-300] | 200 [140-300] | 220 [165-305] | .286 |
| Minimum eosinophil count(x 103cells/mL) | 30 [10-80] | 30 [15-75] | 30 [10-80] | .954 |
| Maximum lymphocyte count(x 103cells/mL) | 2400 [1905-3495] | 2320 [1920-3410] | 2510 [1900-3515] | .315 |
| Minimum lymphocyte count(x 103cells/mL) | 1260 [970-1612] | 1290 [990-1635] | 1210 [940-1590] | .501 |
| EpCAM (pg/mL) | 4.5±1.0 | 3.7±0.5 | 5.3±0.6 | <.001 |
EpCAM, epithelial cell adhesion molecule; GRACE, Global Registry of Acute Coronary Events; hs-TnT, high-sensitive troponin T; PCI, percutaneous coronary intervention; TIMI, Thrombolysis in Myocardial Infarction.
Data are expressed as No. (%), mean±standard deviation, or median [range].
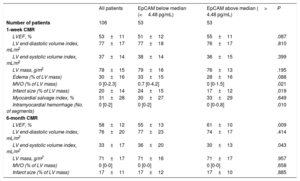
For the CMR imaging variables at 1 week, patients with below median EpCAM levels displayed greater MVO (0.7 [0-4.2] vs 0 [0-1.5], P=.021), infarct size (24±15 vs 17±12, P=.019), and intramyocardial hemorrhage (0 [0-2] vs 0 [0-0.8], P=.010) (table 2).
CMR characteristics of the entire cohort and of patients with EpCAM above or below the median
| All patients | EpCAM below median (<4.48 pg/mL) | EpCAM above median (> 4.48 pg/mL) | P | |
|---|---|---|---|---|
| Number of patients | 106 | 53 | 53 | |
| 1-week CMR | ||||
| LVEF, % | 53±11 | 51±12 | 55±11 | .087 |
| LV end-diastolic volume index, mL/m2 | 77±17 | 77±18 | 76±17 | .810 |
| LV end-systolic volume index, mL/m2 | 37±14 | 38±14 | 36±15 | .399 |
| LV mass, g/m2 | 78±15 | 79±16 | 76±13 | .195 |
| Edema (% of LV mass) | 30±16 | 33±15 | 28±16 | .088 |
| MVO (% of LV mass) | 0 [0-2.3] | 0.7 [0-4.2] | 0 [0-1.5] | .021 |
| Infarct size (% of LV mass) | 20±14 | 24±15 | 17±12 | .019 |
| Myocardial salvage index, % | 31±28 | 30±27 | 33±29 | .649 |
| Intramyocardial hemorrhage (No. of segments) | 0 [0-2] | 0 [0-2] | 0 [0-0.8] | .010 |
| 6-month CMR | ||||
| LVEF, % | 58±12 | 55±13 | 61±10 | .009 |
| LV end-diastolic volume index, mL/m2 | 76±20 | 77±23 | 74±17 | .414 |
| LV end-systolic volume index, mL/m2 | 33±17 | 36±20 | 30±13 | .043 |
| LV mass, g/m2 | 71±17 | 71±16 | 71±17 | .957 |
| MVO (% of LV mass) | 0 [0-0] | 0 [0-0] | 0 [0-0] | .658 |
| Infarct size (% of LV mass) | 17±11 | 17±12 | 17±10 | .885 |
CMR, cardiovascular magnetic resonance; EpCAM, epithelial cell adhesion molecule; LV, left ventricular; LVEF, left ventricular ejection fraction; MVO, microvascular obstruction.
The data are expressed as absolute numbers, mean±standard deviation, or median [range].
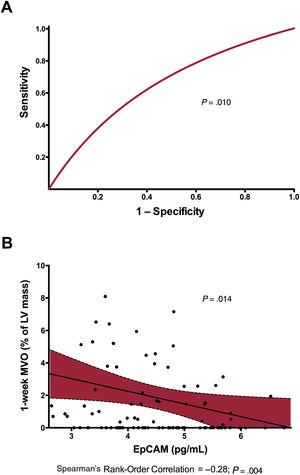
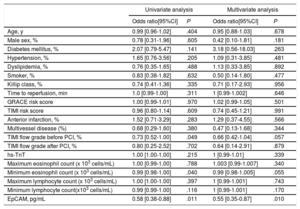
In a univariate analysis, EpCAM (OR, 0.58; 95%CI, 0.38-0.88; P=.011), TIMI flow grade before percutaneous coronary intervention (OR, 0.73; 95%CI, 0.52-1.00; P=.049) and eosinophil minimum count (OR, 0.99; 95%CI, 0.98-1.00; P=.040) were significantly associated with the presence of MVO. However, when we included all baseline clinical variables in a multivariate logistic regression model, only EpCAM levels were independently associated with MVO (OR, 0.55; 95%CI, 0.35-0.87; P=.010) (table 3). Moreover, EpCAM showed a significantly discrimination accuracy for MVO prediction (c-statistic: 0.65; 95%CI, 0.54-0.75; P=.010, figure 1A). Baseline and CMR characteristics according to the presence of MVO at 1-week CMR are shown in and , respectively.
Predictors of 1-week MVO: univariate and multivariate analysis
| Univariate analysis | Multivariate analysis | |||
|---|---|---|---|---|
| Odds ratio[95%CI] | P | Odds ratio[95%CI] | P | |
| Age, y | 0.99 [0.96-1.02] | .404 | 0.95 [0.88-1.03] | .678 |
| Male sex, % | 0.78 [0.31-1.96] | .605 | 0.42 [0.10-1.81] | .181 |
| Diabetes mellitus, % | 2.07 [0.79-5.47] | .141 | 3.18 [0.56-18.03] | .263 |
| Hypertension, % | 1.65 [0.76-3.56] | .205 | 1.09 [0.31-3.85] | .481 |
| Dyslipidemia, % | 0.76 [0.35-1.65] | .488 | 1.13 [0.33-3.85] | .892 |
| Smoker, % | 0.83 [0.38-1.82] | .632 | 0.50 [0.14-1.80] | .477 |
| Killip class, % | 0.74 [0.41-1.36] | .335 | 0.71 [0.17-2.93] | .956 |
| Time to reperfusion, min | 1.0 [0.99-1.00] | .311 | 1 [0.99-1.002] | .646 |
| GRACE risk score | 1.00 [0.99-1.01] | .970 | 1.02 [0.99-1.05] | .501 |
| TIMI risk score | 0.96 [0.80-1.14] | .609 | 0.74 [0.45-1.21] | .991 |
| Anterior infarction, % | 1.52 [0.71-3.29] | .283 | 1.29 [0.37-4.55] | .566 |
| Multivessel disease (%) | 0.68 [0.29-1.60] | .380 | 0.47 [0.13-1.68] | .344 |
| TIMI flow grade before PCI, % | 0.73 [0.52-1.00] | .049 | 0.66 [0.42-1.04] | .057 |
| TIMI flow grade after PCI, % | 0.80 [0.25-2.52] | .702 | 0.64 [0.14-2.91] | .879 |
| hs-TnT | 1.00 [1.00-1.00] | .215 | 1 [0.99-1.01] | .339 |
| Maximum eosinophil count (x 103 cells/mL) | 1.00 [0.99-1.00] | .788 | 1.003 [0.99-1.007] | .340 |
| Minimum eosinophil count (x 103 cells/mL) | 0.99 [0.98-1.00] | .040 | 0.99 [0.98-1.005] | .055 |
| Maximum lymphocyte count (x 103 cells/mL) | 1.00 [1.00-1.00] | .397 | 1 [0.99-1.001] | .743 |
| Minimum lymphocyte count(x103 cells/mL) | 0.99 [0.99-1.00] | .116 | 1 [0.99-1.001] | .170 |
| EpCAM, pg/mL | 0.58 [0.38-0.88] | .011 | 0.55 [0.35-0.87] | .010 |
95%CI, 95% confidence interval; EpCAM, epithelial cell adhesion molecule; GRACE, Global Registry of Acute Coronary Events; hs-TnT, high-sensitive troponin T; MVO, microvascular obstruction; PCI, percutaneous coronary intervention. TIMI, Thrombolysis in Myocardial Infarction.
 for MVO prediction. B: after adjustment for baseline characteristics, EpCAM showed a negative association with 1-week MVO in the study group. EpCAM, epithelial cell adhesion molecule; LV, left ventricular; MVO, microvascular obstruction.")
Predictive value and association of EpCAM with respect to 1-week MVO. A: EpCAM showed a significant discrimination accuracy (c-statistic) for MVO prediction. B: after adjustment for baseline characteristics, EpCAM showed a negative association with 1-week MVO in the study group. EpCAM, epithelial cell adhesion molecule; LV, left ventricular; MVO, microvascular obstruction.
In the chronic phase (6 months), we detected an increase in LVEF (58±12 vs 53±11, P <.001), and a decrease in LV end-systolic volume index (33±17 vs 37±14mL/m2, P=.007) and infarct size (17±11 vs 20±14%, P=.001) compared with baseline characteristics. Conversely, no difference was observed in mean LV end-diastolic volume index (76±20 vs 77±17mL/m2, P=.932). MVO and intramyocardial hemorrhage had almost vanished in all patients at 6 months.
For the CMR imaging variables at 6 months, patients with EpCAM levels below the median displayed lower values of LVEF (55±13 vs 61±10, P=.009) and higher values of LV end-systolic volume index (36±20 vs 30±13, P=.043) (table 2). LVEF at 6 months (OR, 1.05; 95%CI, 1.01-1.09, P=.012) and LV end-systolic volume index at 6 months (OR, 0.97; 95%CI, 0.95-0.99; P=.048) were significantly associated with low EpCAM levels.
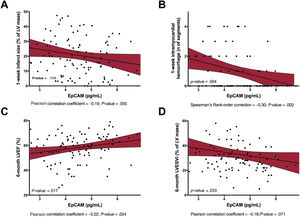
Adjusted effect of EpCAM on short- and long-term cardiac structure and functionAfter multivariate adjustment including all baseline characteristics, serum EpCAM levels remained significantly and inversely associated with 1-week MVO (P=.014, figure 1B), 1-week infarct size (P=.113, figure 2A), and 1-week intramyocardial hemorrhage (P=.004, figure 2B). Serum EpCAM levels also showed a significant positive association with LVEF at 6 months (P=.017, figure 2C) and a nonsignificant negative association with LV end-systolic volume index at 6 months (P=.033, figure 2D).
, intramyocardial hemorrhage (B) a positive relationship with 6-month LVEF (C) and 6-month LVESVI (D), after STEMI. EpCAM, epithelial cell adhesion molecule; LV; left ventricular; LVEF, left ventricular ejection fraction; LVESVI, left ventricular end-systolic volume index; STEMI, ST-segment elevation myocardial infarction.")
Association of EpCAM with 1-week infarct size, 1-week intramyocardial hemorrhage, 6-month LVEF, and 6-month LVESVI. In a multivariate linear regression analysis, EpCAM showed a negative association with 1-week infarct size (A), intramyocardial hemorrhage (B) a positive relationship with 6-month LVEF (C) and 6-month LVESVI (D), after STEMI. EpCAM, epithelial cell adhesion molecule; LV; left ventricular; LVEF, left ventricular ejection fraction; LVESVI, left ventricular end-systolic volume index; STEMI, ST-segment elevation myocardial infarction.
The main finding of our study is the association between circulating EpCAM values and CMR-derived MVO at 1 week, and long-term LV remodeling indices, in a cohort of patients with a first STEMI.
Microvascular obstructionIn reperfused STEMI, abnormalities in microcirculation can occur in more than 50% of patients.1,2 This phenomenon is known as MVO and brings about deleterious structural and prognostic effects such as larger infarct size, more depressed systolic function, less contractile recovery and more adverse remodeling.3,4 As regards prognosis, a recent meta-analysis has demonstrated that the presence of MVO increases the 2-year risk of death, reinfarction, and heart failure.14 Collectively, MVO leads to adverse structural and prognostic consequences.
The last 2 decades have seen important progress in MVO detection, ranging from purely clinical predictors (Killip class, reperfusion delay, presence of diabetes mellitus and the sum of ST-segment elevation at initial electrocardiogram),5 widely available markers (leukocyte counts)15,16 and invasive parameters, to the advent of sophisticated noninvasive imaging techniques.1,17,18 However, late gadolinium enhancement CMR is currently the most reliable technique to determine the presence and extent of MVO, defined as those regions within the core of an infarcted hyper-enhanced area with lack of contrast uptake.1,5
According to our data, minimum eosinophil count, but not Killip class, the presence of diabetes and lymphocyte count were associated with the extent of CMR-derived MVO at 1 week (). Although other baseline variables have been described to correlate with the occurrence of MVO, this was not confirmed in our cohort, probably due to the limited sample size.
Circulating biomarkers associated with microvascular obstructionIn recent years, important insights have been made into the pathophysiology and diagnosis of MVO, yet the predictive value of serum biomarkers in MVO detection and quantification is understudied. Some studies have reported a correlation between nonspecific biomarkers (eg, high-sensitivity troponin T, lactate dehydrogenase, and natriuretic peptides, among others) and CMR-derived MVO.19,20 Although we detected a positive correlation between high-sensitivity troponin T and the extent of 1-week MVO in our cohort (), this universal biomarker was not significantly associated with MVO in either the univariate or the multivariate logistic regression models. However, none of these are exclusively implicated in MVO pathophysiology. Scrutinizing biomarkers specifically related to the pathophysiology of this complication is therefore mandatory.
Although MVO is a multifactorial phenomenon with several mechanisms acting both simultaneously and sequentially in the genesis of MVO,2 endothelial cells play a pivotal role. In the context of reperfused STEMI, endothelial abnormalities, specifically decreased myocardial capillary density soon after ischemia onset, augmented endothelial permeability due to sudden swelling, and disruption of endothelial cell junctions leading to interstitial edema, have been reported to play a role in deficient cardiac microvascularization post-STEMI.6,7,21 Since endothelium seems to participate actively in MVO pathophysiology, our goal was to determine whether biomarkers specifically implicated in endothelial integrity are linked to the appearance of CMR-derived MVO and the resultant cardiac structure in reperfused STEMI.
EpCAM is independently associated with MVO after reperfused STEMIUnder physiological conditions, endothelial cells control nutrients and oxygen diffusion and maintain coagulation, leukocyte migration and platelet activation under control. However, their disruption could exert deleterious effects, including edema, erythrocyte and leukocyte extravasation, as well as disturbed vascular hemostasis.22 Endothelial structure and communication is mediated via tight adherens and gap junctions. EpCAM, a type I transmembrane superficial glycoprotein, is found in the basolateral membrane of multiple normal epithelial cells.8,23 This protein is widely implicated in cancer development due to its overexpression in neoplastic cells. Several studies have pointed to the association of heightened EpCAM expression with metastasis in epithelial tumors and decreased patient survivorship.9 Indeed, some clinical trials are currently underway in a wide variety of carcinomas to evaluate the efficacy of EpCAM-directed blocking antibodies (ie, adecatumumab or edrecolomab) as monotherapy or in combination therapy.
To our knowledge, this is the first study evaluating the role of EpCAM in the cardiovascular setting. According to our data, lower EpCAM expression correlates significantly with greater MVO at 1 week, as well as with depressed long-term systolic invasive function.
Possible interference of EpCAM in MVO via angiogenesis promotionAngiogenesis has been reported to participate in MVO repair. Several studies performed in both clinical and experimental models have highlighted the rapid overexpression of proangiogenic markers in both serum and infarcted myocardium.7,24–26 Indeed, experimental studies aimed at promoting angiogenesis have resulted in increased microvascular density, reduced infarct size, and preserved systolic function.7,27,28
The involvement of EpCAM in promoting angiogenesis has been demonstrated in different scenarios. First, in a cohort of 98 glioma samples, EpCAM overexpression correlated with cancer malignancy and angiogenesis, as reflected by a heightened microvessel density.29 Second, in breast cancer, EpCAM seems to promote cancer invasion since specific ablation of this molecule leads to lower vessel formation, probably due to its interference with interleukin-8.30 Last, in patients with nonalcoholic steatohepatitis, a positive correlation has been found between 2 proangiogenic molecules (vascular endothelial growth factor and angiopoietin-2) and EpCAM.31 According to these previous results, we could hypothesize that EpCAM may promote angiogenesis in the infarcted myocardium, resulting in decreased MVO and better ventricular remodeling. However, further research both at the bench and bedside is necessary to corroborate this issue.
Although this new biomarker could be incorporated into our daily armamentarium to early detect MVO in STEMI patients, this was not the objective of our research. Further research in a larger cohort of STEMI patients is mandatory to confirm the role of EpCAM levels on MVO appearance as well as their specific role in microvascular dysfunction.
Study limitationsThis study should be interpreted in the context of certain limitations. First, as an observational study, we cannot rule out selection bias or unmeasured confounding factors; second, the lack of serial measurements precludes assessing the significance of dynamic changes in circulating EpCAM over time. Last, infarct size, MVO, and edema were quantified by manual planimetry and there are some discrepancies about the reproducibility of this technique.
CONCLUSIONSOur study illustrates for the first time that circulating EpCAM values after reperfused STEMI are associated with CMR-derived MVO in the acute phases and long-term adverse ventricular remodeling. Although further studies are necessary to corroborate the results, these findings contribute to a better understanding of MVO pathophysiology and could be helpful in biochemical assessment of the extent of MVO.
FUNDINGThis study was funded by Instituto de Salud Carlos III and Fondos Europeos de Desarrollo Regional FEDER [research grants PI17/01836, PI20/00637 and CIBERCV16/11/00486, and a postgraduate contract FI18/00320 to C. Ríos-Navarro].
AUTHORS’ CONTRIBUTIONSC. Ríos-Navarro, and J. Gavara contributed equally to this work. C. Ríos-Navarro performed research, collected the data, performed the analysis, wrote the paper, and revised the final manuscript. J. Gavara conducted research, collected the data, performed the analysis, wrote the paper, and revised the final manuscript. J. Núñez conceived and designed the analysis, collected the data, and revised the final manuscript. E. Revuelta-López conducted research, collected the data, and revised the final manuscript. J.V. Monmeneu conducted research, collected the data, and revised the final manuscript. M.P. López-Lereu conducted research, collected the data, and revised the final manuscript. E. de Dios conducted research, collected the data, and revised the final manuscript. N. Pérez-Solé conducted research, collected the data, and revised the final manuscript. J.M. Vila collected the data and revised the final manuscript. R. Oltra collected the data and revised the final manuscript. F.J. Chorro collected the data, obtained funding, and revised the final manuscript. A. Bayés-Genís conceived and designed the analysis, obtained funding, drafted the paper, and revised the final manuscript. V. Bodi conceived and designed the analysis, obtained funding, drafted the paper, and revised the final manuscript.
CONFLICTS OF INTERESTThe authors have no conflicts of interest to declare.
- -
MVO is associated with worse prognosis after STEMI. MVO is a multifactorial phenomenon in which endothelial cells play a pivotal role. EpCAM participates in endothelium physiology and its involvement is understudied in cardiovascular diseases. Exploring EpCAM as a predictor of extensive MVO is crucial to gain greater insight into MVO pathophysiology and provide new therapeutic alternatives.
- -
Circulating EpCAM values at 24hours after coronary revascularization are negatively associated with CMR-derived MVO at 1 week. Higher EpCAM values also correlate with long-term LV remodeling indices, as reflected by a reduced LVEF and increased LV end-systolic volume. These are preliminary results and future studies are needed to confirm EpCAM as a biomarker, and eventually as a biotarget in STEMI pathophysiology.
Supplementary data associated with this article can be found in the online version, at https://doi.org/10.1016/j.rec.2021.04.006