Asian desert dust has recently been recognized as a trigger for acute myocardial infarction. The inflow of dust from the Sahara into Spain impairs air quality due to an increase in particulate matter concentrations in the ambient air. The aim of the present study was to elucidate whether Saharan dust events are associated with the incidence of acute coronary syndrome (ACS) in patients living near North Africa, the major global dust source.
MethodsWe prospectively collected data on hospitalizations due to ACS in 2416 consecutive patients from a tertiary care hospital (Canary Islands, Spain) from December 2012 to December 2017. Concentrations of particulate matter with an aerodynamic diameter 10 microns or smaller (PM10) and reactive gases were measured in the European Air Quality Network implemented in the Canary Islands. We applied the time-stratified case crossover design using conditional Poisson regression models to estimate the impact of PM10 Saharan dust events on the incidence of ACS.
ResultsThe occurrence of Saharan dust events observed 0 to 5 days before the onset of ACS was not significantly associated with the incidence of ACS. Incidence rate ratios (IRR) of PM10 levels 1, 2, 3, 4 and 5 days before ACS onset (for changes in 10μg/m3) were 1.27 (95%CI, 0.87-1.85), 0.92 (95%CI, 0.84-1.01), 0.74 (95%CI, 0.45-1.22), 0.98 (95%CI, 0.87-1.11), and 0.95 (95%CI, 0.84-1.06), respectively.
ConclusionsExposure to Saharan desert dust is unlikely to be associated with the incidence of ACS.
Keywords
The inhalation of air pollutants related to combustion has become a global threat for human health. According to the World Health Organization, particulate matter with an aerodynamic diameter smaller than 10 microns (PM10) and particulate matter with an aerodynamic diameter smaller than 2.5 microns (PM2.5) has a more negative impact on health than gaseous pollutants.1 In Europe, where particulate matter (PM) constitution is mostly dominated by combustion-related components (eg, black carbon, organic carbon, sulphate, nitrate),2 15% to 28% of total cardiovascular mortality is attributed to air pollution.3
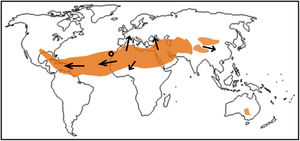
Health effects related to the inhalation of desert dust particles blowing in the ambient air—due to dust storms—is an emerging topic of global interest.4,5 This kind of mineral dust is by far the most important contributor to PM10 and PM2.5 concentrations in large subtropical regions, including North Africa, the Middle East, and parts of Asia4. Review reports have highlighted the existence of an imbalance between the areas most exposed to desert dust (North Africa) and the areas most studied in terms of health effects, mainly Europe and Asia.5 For example, Kojima et al.6 studied exposure to Asian dust and reported that these dust events are likely to be a potential trigger for the onset of acute myocardial infarction (AMI) in patients of the Kumamoto Prefecture (Japan). Globally, there is a lack of studies near the dust sources.5
Global dust emission ranges from 1500 to 2000 Tgyr−17. North Africa is the largest contributor to the global dust budget, accounting for 50% to 70% of global emissions. North African dust is regularly transported over the North Atlantic (resulting in typical concentrations 10s to 100s μg/m3), and episodically over the Mediterranean and Europe (typical concentrations ∼10s μg/m3).7,8
The Canary Islands are located in the North Atlantic (figure 1), under the influence of Atlantic trade winds, a feature that contributes to the occurrence of low background levels of PM10 and PM2.5 (∼15 and 8 μg/m3, respectively), ie, ∼ good air quality conditions. However, the Islands are very close to North Africa (∼500km), and receive frequent impacts of dusty air from the Sahara Desert, a scenario that leads to increases in PM10 and PM2.5 concentrations, which can reach values higher than 100s μg/m3. These PM concentrations are much higher than those occurring in Europe and are higher than the 50μg/m3 for PM10 recommended as the daily limit value in the Air Quality Guideline of the World Health Organization.1 These features offer an ideal opportunity to investigate the effects of dust on cardiovascular disease in populations living near major dust sources.9 In the present study, we designed a time-stratified case-crossover study to elucidate the association between exposure to Saharan dust and the incidence of acute coronary syndrome (ACS) in patients living near North Africa, the major global dust source.
METHODSStudy area
The Canary Islands are a volcanic archipelago situated in the eastern North Atlantic (figure 1). This study was performed in Tenerife, the largest island (2034.38km2). Meteorology is characterized by trade winds (March to August), which contribute to the rapid dispersion of local air pollutants and help to keep fairly good air quality in most of the archipelago. Although dust events may occur through the year, there are 2 dust seasons,10 segregated by meteorology: a) November to March, and b) July to August.
Patient dataThe study was carried out in a tertiary care hospital (Tenerife, Spain), which provides medical care for the residents in the northern part of the island of Tenerife, serving a population of 343 025 inhabitants. The northern side of Tenerife includes many residential areas, so many of their inhabitants commute each morning to work in other parts of the islands (mostly to the capital, Santa Cruz, and the southern part of Tenerife), and are thus exposed to air quality conditions throughout the island. Our study included all patients diagnosed with ACS, with or without AMI, from December 2012 to December 2017 at that institution. AMI was defined according to current guidelines as the presence of symptoms of myocardial ischemia and an increase in markers of myocardial necrosis.11,12
A number of clinical variables were prospectively recorded in each patient, including coronary risk factors, age, sex, previous vascular disease, presence of asthma or chronic obstructive pulmonary disease, chronic kidney disease, atrial fibrillation, number of diseased coronary vessels (recorded from the coronary angiography), left ventricular ejection fraction, Killip class, troponin I levels, coronary intervention (percutaneous transluminal coronary angioplasty or coronary artery bypass surgery), hospital stay, in-hospital mortality and 1-year mortality.
This study was approved by the Clinical Research Ethics Committee of a tertiary care hospital (Hospital Universitario de Canarias).
Air quality, desert dust, and meteorological variablesData on meteorology, concentrations of PM10, PM2.5-10, PM2.5 and reactive gasesous pollutants (NOx, O3, and SO2) were prospectivelly collected daily from December 2012 to December 2017. These data were provided by the air quality network of the Canary Islands, which is part of the European Air Quality Network, in which particulate (PM10 and PM2.5) and gaseous pollutants are monitored following the mandatory reference methods and procedures established by the European Union legislation (Directive 2008/50/EC). The network provides hourly resolution data, which are transmitted to the European Environmental Agency. We determined and analyzed daily average values. To obtain a comprehensive view of the impact of Saharan dust events on air quality, we initillay worked with the data of several air quality stations, located in the North (Balsa Zamora, residental background), North-East (Depósito Tristán and Tena Artigas, residential background) and South (El Río, rural) of Tenerife. Because of the rather low background of PM and because Saharan dust events prompt high PM concentrations across the island, the time series of PM at these sites exibited a high correlation. Thus, we selected the records with the highest data availability (Tena Artigas station) for inclusion in the statistical analysis with the medical data. During the study period, the time series of daily PM10 concentrations of Tena Artigas (availability=98.4%) exibited a correlation coeficient within the range 0.76 to 0.84 with the other 3 stations during the study period (December 2012 to December 2017). The occurrence of Saharan dust events was detected with the validated past forecasts of the WMO SDS-WAS (World Meteorological Organization's Sand and Dust Storm – Warning Advisory and Assessment System), whose regional node for Northern Africa, Middle East and Europe is managed by the Meteorological State Agency of Spain and the Barcelona Super Computing Center. The WMO SDS-WAS dust forecast system is constituted by a weather forecast model that also includes a module for simulating the dust (cycle emissions, transport, and deposition).13 This dust forecast for the Canary Islands was validated by García-Castrillo and Terradellas.14
Statistical analysisQuantitative and categorical variables are respectively described as median [interquartile range] and number (percentage). We used time-series regression analyses, which are commonly used to study the association between aggregated exposures and health outcomes. The outcome is a count (usually the number of events per day) and the main unit of analysis is the day and not the individual person. Because usual individual confounders (eg, age, sex, diabetes) do not change significantly from day to day, these factors have no impact on effect estimates of environment variables. To control for seasonality and long-term trends, we used a time-stratified case crossover design, with the strata being the day of the week between the month.15,16 The idea was to compare the exposure of a case immediately prior to the event with that same person's exposure at otherwise similar “reference” times. Because our strata was the day of the week within months, exposures associated with an event occurring 1 day of the week, for example, a Monday, were compared with exposures on the rest of the Mondays in the same month and were used as references. These strata were expected to control for individual covariates and slow or regular changes in underlying risk, such as season, trends over time, or day of the week.15,16
A conditional logistic regression model is usually used to analyze the impact of environment variables on clinical events. However, due to the influence of unmeasured causes of clinical events that vary over time, observed event counts usually have wider variation than that predicted by a Poisson distribution.15,16 This overdispersion, when using a logistic regression model, is not taken into account because outcomes are binary and therefore over-dispersion is not apparent. However, the assumption of independence between case-control sets in a conditional logistic model implicitly assumes no overdispersion of counts.16 Moreover, conditional logistic regression assumes that observations are independent. However, observations close in time are probably more similar than those distant in time17 and autocorrelation is likely to be present. In such a scenario, the usual conditional logistic regression model cannot adjust for overdispersion and autocorrelation, both frequent causes of underestimating uncertainty or type 1 error.16
To overcome all these methodological limitations, following the method published by Armstrong et al.,16 we used a conditional Poisson regression model to control for overdispersion and autocorrelation. The dependent variable was the number of ACS diagnosed at the institution per day. To perform this analysis, data matrix had to be modified (). We calculated incidence rate ratios (IRR) with 95% confidence intervals (95%CI). To determine the influence of PM10, we adjusted for the following pollutants and environment variables: PM2.5-10, PM2.5, NO2, SO2, O3, temperature, and humidity. The maximum model was constructed with PM10, the previously described pollutants and environment variables and the 2-way interactions between PM10 and all other variables. All these interactions were assessed and removed if statistical significance was not found. We also took into account the possibility that the impact of the particles was delayed a few days. Thus, we studied the single-day lag effect from day 0 to day 5. We also adjusted these different lag effects for each other, developing a lag-stratified distributed lag model.16 However, in this last model, lag-terms are likely to be highly correlated. To reduce the collinearity of these lag-terms, which results in imprecise estimates, we imposed some constraints to the distributed lag model, namely that effect estimates for days 1 and 2 are the same, and effect estimates for days 3 to 5 are also the same.16 We repeated all analyses, calculating the incidence of AMI instead of ACS. Diagnoses of the model were tested. P values <.05 were considered statistically significant. All analyses were performed using STATA v.15 (StataCorp, United States).
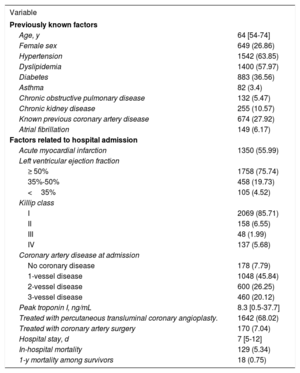
RESULTSStudy population, acute coronary syndrome, PM10, and dust eventsDuring the study period, 2416 patients were diagnosed with ACS at the aforementioned institution. The median age was 64 (54-74) years and 649 participants (26.86%) were women. A total of 1350 (55.88%) had AMI, 185 (7.67%) were admitted in III or IV Killip class and 129 (5.34%) patients died during the hospital admission. These and other variables are described in table 1.
Population characteristics
| Variable | |
|---|---|
| Previously known factors | |
| Age, y | 64 [54-74] |
| Female sex | 649 (26.86) |
| Hypertension | 1542 (63.85) |
| Dyslipidemia | 1400 (57.97) |
| Diabetes | 883 (36.56) |
| Asthma | 82 (3.4) |
| Chronic obstructive pulmonary disease | 132 (5.47) |
| Chronic kidney disease | 255 (10.57) |
| Known previous coronary artery disease | 674 (27.92) |
| Atrial fibrillation | 149 (6.17) |
| Factors related to hospital admission | |
| Acute myocardial infarction | 1350 (55.99) |
| Left ventricular ejection fraction | |
| ≥ 50% | 1758 (75.74) |
| 35%-50% | 458 (19.73) |
| <35% | 105 (4.52) |
| Killip class | |
| I | 2069 (85.71) |
| II | 158 (6.55) |
| III | 48 (1.99) |
| IV | 137 (5.68) |
| Coronary artery disease at admission | |
| No coronary disease | 178 (7.79) |
| 1-vessel disease | 1048 (45.84) |
| 2-vessel disease | 600 (26.25) |
| 3-vessel disease | 460 (20.12) |
| Peak troponin I, ng/mL | 8.3 [0.5-37.7] |
| Treated with percutaneous transluminal coronary angioplasty. | 1642 (68.02) |
| Treated with coronary artery surgery | 170 (7.04) |
| Hospital stay, d | 7 [5-12] |
| In-hospital mortality | 129 (5.34) |
| 1-y mortality among survivors | 18 (0.75) |
Values are expressed as No. (%) or median [interquartile range].
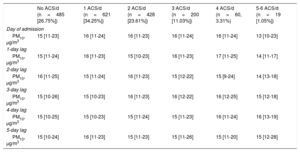
In the study period, there were 485 days (26.75%) in which there was no ACS, 621 days (34.25%) in which there was 1 ACS, 428 days (23.61%) in which there were 2 ACS, 200 days (11.03%) in which there were 3 ACS, 60 days (3.31%) in which there were 4 ACS, 15 days (0.83%) in which there were 5 ACS, and 4 days (0.22%) in which there were 6 ACS. The median PM10 level was 15μg/m3 (11-24). For those days without ACS, the PM10 concentration was 15μg/m3 (11-23). For days with 1, 2, 3, 4, 5 or 6 ACS, PM10 levels were 16μg/m3 (11-24), 16μg/m3 (11-23), 16μg/m3 (11-24), 16μg/m3 (11-24), and 13μg/m3 (10-23), respectively. Table 2 shows PM10 concentrations for different numbers of ACS/d and different day-lags.
PM10 concentrations based on the number of ACS per day. Data are presented for different day-lags
| No ACS/d (n=485 [26.75%]) | 1 ACS/d (n=621 [34.25%]) | 2 ACS/d (n=428 [23.61%]) | 3 ACS/d (n=200 [11.03%]) | 4 ACS/d (n=60, 3.31%) | 5-6 ACS/d (n=19 [1.05%]) | |
|---|---|---|---|---|---|---|
| Day of admission | ||||||
| PM10, μg/m3 | 15 [11-23] | 16 [11-24] | 16 [11-23] | 16 [11-24] | 16 [11-24] | 13 [10-23] |
| 1-day lag | ||||||
| PM10, μg/m3 | 15 [11-24] | 16 [11-23] | 15 [10-23] | 16 [11-23] | 17 [11-25] | 14 [11-17] |
| 2-day lag | ||||||
| PM10, μg/m3 | 16 [11-25] | 15 [11-24] | 16 [11-23] | 15 [12-22] | 15 [9-24] | 14 [13-18] |
| 3-day lag | ||||||
| PM10, μg/m3 | 15 [10-26] | 15 [10-23] | 16 [11-23] | 16 [12-22] | 16 [12-25] | 15 [12-18] |
| 4-day lag | ||||||
| PM10, μg/m3 | 15 [10-25] | 15 [10-23] | 15 [11-24] | 15 [11-23] | 16 [11-24] | 16 [13-19] |
| 5-day lag | ||||||
| PM10, μg/m3 | 15 [10-24] | 16 [11-23] | 15 [11-23] | 15 [11-26] | 15 [11-20] | 15 [12-28] |
ACS, acute coronary syndromes; n, number of days; PM10, particulate matter with an aerodynamic diameter <10μg/m3.
Data are presented as median [interquartile range].
shows the daily PM10 concentrations in Tenerife during the study period. This time series of PM10 shows the regular low background of this region (∼15 μg/m3) and sharp peak events due to the arrival of dusty air from North Africa, when PM10 reached values between 40 and 350μg/m3. shows the time series of dust concentrations in Tenerife provided by the WMO SDS-WAS modelling, where the peak dust events (up to ∼320μg/m3) led to the high PM10 episodes, as can be clearly observed.
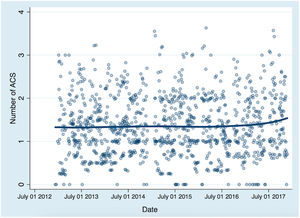
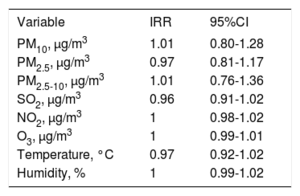
Influence of Saharan dust on the incidence of acute coronary syndromeOn the same day of the ACS (with no lag-effect), the IRR for each 10μg/m3 of PM10 was 1.01 (95%CI, 0.80-1.28). The results of the Poisson regression showing IRR of PM10 and other confounding factors are shown in table 3. No long-term trends between the study period and the predicted number of ACS were observed (figure 2).
Poisson regression analysis. No day-lag effect
| Variable | IRR | 95%CI |
|---|---|---|
| PM10, μg/m3 | 1.01 | 0.80-1.28 |
| PM2.5, μg/m3 | 0.97 | 0.81-1.17 |
| PM2.5-10, μg/m3 | 1.01 | 0.76-1.36 |
| SO2, μg/m3 | 0.96 | 0.91-1.02 |
| NO2, μg/m3 | 1 | 0.98-1.02 |
| O3, μg/m3 | 1 | 0.99-1.01 |
| Temperature, °C | 0.97 | 0.92-1.02 |
| Humidity, % | 1 | 0.99-1.02 |
95%CI, 95% confidence interval; IRR, incidence rate ratios; NO2, nitrogen dioxide; O3, ozone; PM10, particulate matter with an aerodynamic diameter <10μg/m3; SO2, sulphur dioxide.
IRR of PM variables was calculated for changes of 10μg/m3.

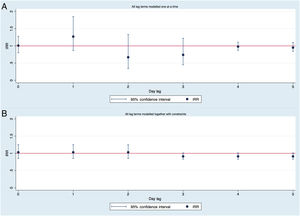
Study of possible day-lag effects showed that PM10 concentrations were not associated with the number of ACS in any of the previous 5 days. The IRR of PM10 levels of 1, 2, 3, 4 and 5 days (for changes in 10μg/m3) were 1.27 (95%CI, 0.87-1.85), 0.92 (95%CI, 0.84-1.01), 0.74 (95%CI, 0.45-1.22), 0.98 (95%CI, 0.87-1.11), and 0.95 (95%CI, 0.84-1.06), respectively. No association between PM10 and the number of ACS was found when these different lag-effects were adjusted by each other in a model with constraints (effect estimates for day-lag 0, 1 and 2 are the same, and for day-lag 3, 4 and 5 are the same). Figure 3 shows the IRR, which results from modelling lagged associations between PM10 and the number of ACS. Interactions were not statistically significant in any of the models and were eliminated.

IRR calculated modelling lagged associations between PM10 concentrations and number of ACS. A: without controlling for other lag-effects, B: controlling for different lag-effects with constraints. IRR for changes in 10μg/m3 of PM10. ACS, acute coronary syndrome; IRR, incidence rate ratios; PM10, particulate matter smaller than 10-micron aerodynamic diameter.
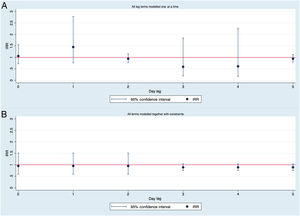
A total of 1350 patients were diagnosed with AMI. Based on the Poisson regression model adjusted for autocorrelation and overdispersion, PM10 levels had no influence on the number of AMI. For 10μg/m3 of PM10, the IRR was 1.1 (95%CI, 0.71-1.55). The number of AMI was not associated with the PM10 concentrations of any of the previous 5 days. No association between PM10 and the number of ACS was found when these different lag-effects were adjusted by each other in a model with constraints (figure 4).

IRR calculated modelling lagged associations between PM10 concentrations and number of acute myocardial infarction. A: without controlling for other lag-effects, B: controlling for different lag-effects with constraints. IRR for changes in 10μg/m3 of PM10. IRR, incidence rate ratios; PM10, particulate matter smaller than 10-micron aerodynamic diameter.
This study found that desert dust is not a potential trigger for the onset of ACS in patients exposed to Saharan dust in Tenerife-Spain. Recently, special attention has been paid to nonanthropogenic air pollution originating from natural dust storms, which may constitute a health risk.5,18 Most environmental research analyzing the effects of air pollution on cardiovascular health focuses on anthropogenic air pollution (ie, linked to combustion of fossil fuels, such as. transport and industry). In the current study, we analyzed the possibility that Saharan dust produced by natural phenomena is a trigger of ACS.
In general, a distinction is made between particles smaller than 10 microns in diameter (PM10, thoracic particles that can penetrate into the lower respiratory system), particles smaller than 2.5 microns (PM2.5, so-called fine or respirable particles that can penetrate into the gas-exchange region of the lung), and ultrafine particles smaller than 100nm (0.1 microns) that typically make a low contribution to particle-PM mass (ie, PM10 and PM2.5) but are the most abundant and have a high grade of lung penetration.19 Most anthropogenic combustion related-particle occurs in the ultrafine and PM2.5 fractions, whereas a significant fraction of mineral dust occurs in the coarse range (2.5-10 microns) of PM10. For example, during Saharan dust events, most of the PM10 is constituted by coarse dust particles (70%-80%, ie, PM2.5/PM10=0.2-0.3). In contrast, in cities polluted by combustion sources in Europe, PM10 is mostly produced by combustion particles (PM2.5/PM10=0.8-0.9).2 Coarse particles are more likely to be deposited in the bronchial passages and thereby induce respiratory conditions such as asthma, chronic obstructive pulmonary disease, and pneumonia.19
Articles published to date providing information on health-related PM research have focused on the impact of anthropogenically generated—mostly combustion—PM.3,20–22 The conclusions of these studies were highly concordant and showed that PM derived from combustion is clearly a threat to human health. For example, a recent study by Bañeras et al.23 performed in an urban area of northern Spain, without a natural source of dust, found that PM10 and PM2.5 were associated with the incidence of AMI. PM from urban areas is derived from combustion emissions.2 The influence of PM10 derived from combustion on cardiovascular pathophysiology is likely to differ from that of PM10 derived from natural sources.5
Studies based on the influence of PM derived from nonanthropogenic sources are scarce and the results are discordant. A study in the USA showed an association between PM10 derived from dust storms and mortality,24 while another study analyzing 13 southern European countries found no association between PM10 concentrations derived from the desert and hospital admissions or mortality.25
Recently, 2 reports have examined the relationship of dust storms with ACS.6,25 Vodonos et al.26 showed that there was an impact of PM10 (1 day-lag) during dust storm days on the incidence of ACS (OR, 1.007; 95%CI, 1.002-1.012), while there was no significant effect during nondust storm days (OR, 1.011; 95%CI, 0.998-1.025). The authors hypothesized that traffic- and industry-related particles have more toxic effects on human health26 than nonanthropogenic sources. A similar hypothesis was proposed by Kojima et al.6 These authors, who studied the effect of Asian dust on the incidence of AMI in the Kumamoto Prefecture (south-western Japan), concluded that the occurrence of Asian dust events the day before leads to AMI (OR, 1.46; 95%CI, 1.09-1.95). They controlled for PM2.5 but did not control for other possible confounding factors such as PM10 or PM2.5-10. There is an “environmental” agreement to consider a dust event based on the mean PM10 concentrations over 24hours.5 Moreover, it is hard to believe that Asian dust can be a risk factor the day before the AMI (1 day-lag effect) but almost a protector factor the same day of the AMI (0 day-lag effect), as can be deduced from the confidence intervals of their .6 Statistically significant but incongruent results may occur due to the performance of multiple comparisons, especially in the presence of an underestimated uncertainty, which occurs when overdispersion and autocorrelation is not taken into account.
Due to the ambiguous language in relation to the so-called dust event, the confusion about the type of particles constituting a dust event and the existence of possible unmeasured or uncontrolled confounding factors, epidemiological associations between desert dust and ACS are fairly controversial and inconclusive. In this context, we thought that studying the impact of Saharan dust events in West Africa, where dust events are more frequent and intense than anywhere else in the world,4,5 could shed light on this issue. We considered a dust event as PM10 concentrations,5 controlled for the existence of possible confounding factors (mainly other PM and pollutants) and used a novel and adequate statistical process that allowed us not to underestimate type 1 errors.15–17 In addition, this study is based in a single tertiary hospital, which serves the entire population in the region, thus eliminating selection bias. Likewise, the exposure analyzed in our study comes from nonanthropogenic sources with most of the dust storm originating from the Saharan desert.
LimitationsThis study has some limitations. First, we used outdoor air pollution concentrations measured at fixed point monitors, whereas people spend most of the time indoors. Second, exposure measurement error is an inherent disadvantage of time-series studies, because the average of selected fixed monitoring stations does not reflect the true average exposure of the population. Therefore, there is some evidence that exposure measurement error in time-series analysis could bias estimates downward.27 Using Poisson regression analysis allowed us to control for overdispersion and autocorrelation, which are frequent causes of underestimating type 1 error. However, to achieve this, the data matrix had to be modified and a stratified analysis by individual variables could not be performed since these variables no longer make sense in that new data matrix. Finally, we cannot rule out insufficient statistical power to show associations. This lack of statistical power is not trivial and causes a challenge in this kind of study.28 With a study period of 5 years and more than 2000 events, we have studied the influence of changes of 10μg/m3 PM10 on the incidence of ACS, with the median PM10 in our territory being 15 [11-24] μg/m3. That is, an increase of 10 units of PM10, would be equivalent to moving from a day with relatively little PM10 (imagine 11 units, within the first quartile of PM10) to a day with relatively high PM10 (imagine 21, within almost the third quartile from PM10). Even so, the confidence intervals are not excessively wide and none of the associations evaluated were statistically significant. Nevertheless, the associations between PM and cardiovascular events are generally very small, usually in the third decimal place of the RR, and therefore we cannot rule out a lack of statistical power.
CONCLUSIONSThis negative study, the first to assess the impact of Saharan dust events as a potential trigger for the onset of ACS, shows that African dust is unlikely to be associated with the incidence of ACS. Efforts should focus on reducing emissions derived from combustion.
- –
Saharan dust transport may greatly increase the ambient levels of particulate matter recorded in air quality monitoring networks. This is especially relevant in southern Europe and in some Atlantic islands.
- –
Most studies have been performed in regions (southern Europe and east Asia) distant from dust sources.
- –
Globally, the highest dust concentrations occur in North Africa and no studies on the effects of dust on health effects have been performed in the region.
- –
Studies on dust and health effects have mostly been epidemiological, associating cardiovascular mortality with dust.
- –
In this prospective, observational study, the occurrence of Saharan dust events observed 0 to 5 days before the acute coronary syndrome onset was not significantly associated with the incidence of acute coronary syndrome.
- –
In air quality studies, the use of appropriate statistical techniques is highly important to control for seasonality and autocorrelation of observations.
- –
The replication and publication of rigorous studies, even those with “negative” results, enables clarification of the relationships and avoids potential biases.
None declared.
We thank the World Meteorological Organization's Sand and Dust Storm – Warning Advisory and Assessment System program, comanaged by the Agencia Española de Meteorología and Barcelona Super Computing Center, for providing dust modelling and the Department of Environment of the Government of the Canary Islands for providing air quality data.
Supplementary data associated with this article can be found in the online version available at https://doi.org/10.1016/j.rec.2020.02.003.