To investigate the relationship between in-hospital mortality due to acute myocardial infarction and type of hospital, discharge service, and treatment provided.
MethodsRetrospective analysis of 100 993 hospital discharges with a principal diagnosis of myocardial infarction in hospitals of the Spanish National Health Service. In-hospital mortality was adjusted for risk following the models of the Institute for Clinical Evaluative Sciences (Canada) and the Centers for Medicare & Medicaid Services (United States).
ResultsHospital characteristics are relevant to explain the variation in the individual probability of dying from myocardial infarction (median odds ratio: 1.3561). The risk-adjusted in-hospital mortality in cluster 3 and especially in cluster 4 hospitals (500 beds to 1000 beds and medium-high complexity) was significantly lower than in hospitals with less than 200 beds. Cluster 5 (more than 1000 beds), which includes a diverse group of hospitals, had a higher mortality rate than clusters 3 and 4. The adjusted mortality in the groups with the best and worst outcomes was 6.74% (cluster 4) and 8.49% (cluster 1), respectively. Mortality was also lower when the cardiology unit was responsible for the discharge or when angioplasty had been performed.
ConclusionsThe typology of the hospital, treatment in a cardiology unit, and percutaneous coronary intervention are significantly associated with the survival of a patient hospitalized for myocardial infarction. We recommend that the Spanish National Health Service establish health care networks that favor percutaneous coronary intervention and the participation of cardiology units in the management of patients with acute myocardial infarction.
Keywords
.
INTRODUCTIONIn Spain and the majority of the developed countries, heart disease1 constitutes a considerable health care burden as it is responsible for 22% of overall mortality and is the most common cause of in-hospital morbidity.1–3 Improvements in its treatment have contributed to the increase in life expectancy, with returns on the investment made in terms of cost-effectiveness.4 These achievements are due in large part to new therapies and management strategies and to good clinical administration practices.5,6
In contrast to the efforts devoted to investigating the efficacy of technological innovations,7 the relevance of the organization and administration of clinical services to their effectiveness has warranted less attention.8 However, the study of the outcomes in health care services is gaining in interest, especially with regard to the provision of cardiology services.9–13
The objective of the RECALCAR project is to investigate the relationship between organizational and administrative aspects of the cardiology units of the Spanish National Health Service (NHS) and patient outcomes. Among other activities, RECALCAR has analyzed the episodes of discharges from NHS hospitals recorded in the minimum basic data set in 2009-2010. In this article, we report the results obtained from the use of the minimum basic data set concerning the relationship between the characteristics of the hospital, the care provided (clinical services and procedures), and the in-hospital mortality due to acute myocardial infarction (AMI).
METHODSFor a more detailed description of the methodology used, the reader can consult the supplementary material.
Spanish National Health Service DatabasesOf all the discharges from Spanish NHS hospitals corresponding to 2009-2010, included in the minimum basic data set and coded according to the ICD-9-CM (International Classification of Diseases, Ninth Revision, Clinical Modification),14 we selected the 100 993 episodes in which the “principal diagnosis” was AMI (codes 410.*1 of the ICD-9-CM, which include AMI with and without persistent ST segment elevation, with the exception of postindex care episodes).
Risk-adjustment of In-hospital Mortality Due to Acute Myocardial InfarctionTo improve data consistency and eliminate entries with problems in terms of the quality of the diagnosis,15,16 we excluded patients under 35 years or over 94 years of age, those whose stay was less than 1 day, and those treated in hospitals with fewer than 25 episodes a year (1319, 3445, and 1061 cases, respectively). This resulted in a sample of 95 177 episodes, with a crude in-hospital mortality rate of 7.26%.
The in-hospital mortality has been adjusted for risk, according to the model published15 by the Institute for Clinical Evaluative Sciences (ICES) of Ontario, Canada, in 1999, using SPSS 15.0 and considering the risk factors described in Table 1. The adjustment coefficients and the factors ultimately included in the model were derived from our own data and were used to estimate the expected mortality and to calculate the risk-adjusted in-hospital mortality ratio as the ratio of observed to expected mortality. However, the actual probability of a patient dying is considered to be a combination of his or her individual risk factors (case history) and the quality of the care provided (hospital-specific functionality).17–19 In addition to the patients’ demographic and clinical variables, hierarchical models of risk adjustment (multilevel models)20–22 take into consideration a specific effect at the “hospital” level. Applying this approach, we applied a multilevel logistic regression model using MLwiN 2.25 and the same variables as the 1999 ICES model.
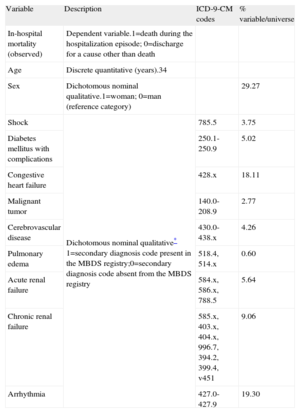
Description of the Variables (Institute for Clinical Evaluative Sciences, 1999)15
| Variable | Description | ICD-9-CM codes | % variable/universe |
| In-hospital mortality (observed) | Dependent variable.1=death during the hospitalization episode; 0=discharge for a cause other than death | ||
| Age | Discrete quantitative (years).34 | ||
| Sex | Dichotomous nominal qualitative.1=woman; 0=man (reference category) | 29.27 | |
| Shock | Dichotomous nominal qualitative* 1=secondary diagnosis code present in the MBDS registry;0=secondary diagnosis code absent from the MBDS registry | 785.5 | 3.75 |
| Diabetes mellitus with complications | 250.1-250.9 | 5.02 | |
| Congestive heart failure | 428.x | 18.11 | |
| Malignant tumor | 140.0-208.9 | 2.77 | |
| Cerebrovascular disease | 430.0-438.x | 4.26 | |
| Pulmonary edema | 518.4, 514.x | 0.60 | |
| Acute renal failure | 584.x, 586.x, 788.5 | 5.64 | |
| Chronic renal failure | 585.x, 403.x, 404.x, 996.7, 394.2, 399.4, v451 | 9.06 | |
| Arrhythmia | 427.0-427.9 | 19.30 |
ICD-9-CM, International Classification of Diseases, Ninth Revision, Clinical Modification; MBDS, minimum basic data set.
Using the multilevel model, the in-hospital mortality ratio (risk-standardized mortality ratio [RSMR]) was calculated as the ratio of the predicted mortality (which considers, on an individual basis, the functionality of the hospital in which the patient is being treated) to the expected mortality (which considers a standard functionality according to the average of all the hospitals), multiplied by the crude mortality rate.18,23 Thus, if the RSMR of a hospital is higher than the crude mortality rate, the probability of a patient dying in that hospital is greater than the average of the hospitals considered.
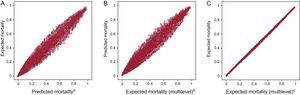
The results obtained show high correlation between the different estimations of mortality: expected (ICES, 1999), predicted (multilevel), and expected (multilevel), with Pearson correlation coefficients between 0.990 and 1 (P<.01) (Fig. 1), as well as good fit and discrimination, both in the ICES model of 1999 (Table 2) and with the multilevel model (Table 3), although the results are better with the latter.
. A, expected mortality (Institute for Clinical Evaluative Sciences, 1999). B, predicted mortality (multilevel). C, expected mortality (multilevel). ML, multilevel. aPearson correlation coefficient=0.99. bPearson correlation coefficient=0.99. cPearson correlation coefficient=1.")
Correlation between mortality estimates (P<.01). A, expected mortality (Institute for Clinical Evaluative Sciences, 1999). B, predicted mortality (multilevel). C, expected mortality (multilevel). ML, multilevel. aPearson correlation coefficient=0.99. bPearson correlation coefficient=0.99. cPearson correlation coefficient=1.
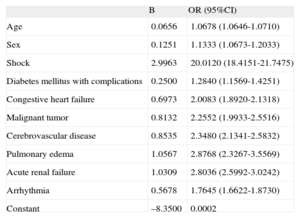
Adjustment of the Logistic Regression Model for In-hospital Mortality Due to Acute Myocardial Infarction in 2009-2010 (Institute for Clinical Evaluative Sciences, 1999)15
| B | OR (95%CI) | |
| Age | 0.0656 | 1.0678 (1.0646-1.0710) |
| Sex | 0.1251 | 1.1333 (1.0673-1.2033) |
| Shock | 2.9963 | 20.0120 (18.4151-21.7475) |
| Diabetes mellitus with complications | 0.2500 | 1.2840 (1.1569-1.4251) |
| Congestive heart failure | 0.6973 | 2.0083 (1.8920-2.1318) |
| Malignant tumor | 0.8132 | 2.2552 (1.9933-2.5516) |
| Cerebrovascular disease | 0.8535 | 2.3480 (2.1341-2.5832) |
| Pulmonary edema | 1.0567 | 2.8768 (2.3267-3.5569) |
| Acute renal failure | 1.0309 | 2.8036 (2.5992-3.0242) |
| Arrhythmia | 0.5678 | 1.7645 (1.6622-1.8730) |
| Constant | –8.3500 | 0.0002 |
95%CI, 95% confidence interval; B, regression coefficient; OR, odds ratio.
The variable “chronic renal failure” is not significant.
Calibration: Hosmer-Lemeshow chi-square=92.558; degrees of freedom=8; P<.001.
Discrimination: area under the receiver operating characterisctic curve=0.864 (95%CI, 0.860-0.868); P<.001.
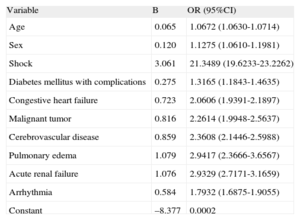
Adjustment of the Multilevel Logistic Regression Model for In-hospital Mortality Due to Acute Myocardial Infarction in 2009-2010 (Institute for Clinical Evaluative Sciences variables 1999)15
| Variable | B | OR (95%CI) |
| Age | 0.065 | 1.0672 (1.0630-1.0714) |
| Sex | 0.120 | 1.1275 (1.0610-1.1981) |
| Shock | 3.061 | 21.3489 (19.6233-23.2262) |
| Diabetes mellitus with complications | 0.275 | 1.3165 (1.1843-1.4635) |
| Congestive heart failure | 0.723 | 2.0606 (1.9391-2.1897) |
| Malignant tumor | 0.816 | 2.2614 (1.9948-2.5637) |
| Cerebrovascular disease | 0.859 | 2.3608 (2.1446-2.5988) |
| Pulmonary edema | 1.079 | 2.9417 (2.3666-3.6567) |
| Acute renal failure | 1.076 | 2.9329 (2.7171-3.1659) |
| Arrhythmia | 0.584 | 1.7932 (1.6875-1.9055) |
| Constant | –8.377 | 0.0002 |
95%CI, 95% confidence interval; B, regression coefficient; OR, odds ratio.
The variable “chronic renal failure” is not significant.
Intercept variance corresponding to the “hospital” level=0.102; intrahospital correlation coefficient=0.0301; median OR=1.3561.
Discrimination: area under the receiver operating characteristic curve for predicted mortality=0.871 (95%CI, 0.866-0.875); P<.001 and for expected mortality=0.864 (95%CI, 0.864-0.869); P<.001.
The weights of the adjustment variables are nearly the same in both models and similar to those of the adjustment model used as a reference.15 The variable with the greatest weight as a predictor of mortality is the presence of shock, followed by others related to heart failure (acute pulmonary edema, acute renal failure). In contrast to the reference model, “chronic renal failure” is not significant in terms of the adjustment.
The estimation according to the multilevel model indicates that approximately 3% of the total variance is explained by the differences between hospitals (intrahospital correlation coefficient=0.0301) and that the characteristics of the hospitals in which the patients are being treated help to explain the variation in the individual probability of dying from AMI (median odds ratio=1.3561).
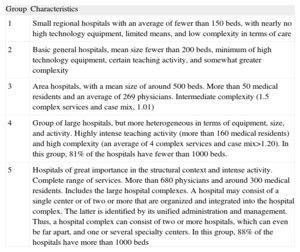
Analysis of Risk-adjusted In-hospital Mortality Due to Acute Myocardial InfarctionWe studied the existence of statistically significant differences between the means of the RSMR, which resulted in a better fit than the risk-adjusted mortality ratio, corresponding to the following aspects: a) hospital typologies, according to the cluster classification developed by the Spanish Ministry of Health (Table 4)14; b) hospital services responsible for discharging the patients treated for AMI, and c) procedures carried out (angioplasty and/or fibrinolysis).
Classification of Hospitals of the Spanish National Health Services According to Complexity
| Group | Characteristics |
| 1 | Small regional hospitals with an average of fewer than 150 beds, with nearly no high technology equipment, limited means, and low complexity in terms of care |
| 2 | Basic general hospitals, mean size fewer than 200 beds, minimum of high technology equipment, certain teaching activity, and somewhat greater complexity |
| 3 | Area hospitals, with a mean size of around 500 beds. More than 50 medical residents and an average of 269 physicians. Intermediate complexity (1.5 complex services and case mix, 1.01) |
| 4 | Group of large hospitals, but more heterogeneous in terms of equipment, size, and activity. Highly intense teaching activity (more than 160 medical residents) and high complexity (an average of 4 complex services and case mix>1.20). In this group, 81% of the hospitals have fewer than 1000 beds. |
| 5 | Hospitals of great importance in the structural context and intense activity. Complete range of services. More than 680 physicians and around 300 medical residents. Includes the large hospital complexes. A hospital may consist of a single center or of two or more that are organized and integrated into the hospital complex. The latter is identified by its unified administration and management. Thus, a hospital complex can consist of two or more hospitals, which can even be far apart, and one or several specialty centers. In this group, 88% of the hospitals have more than 1000 beds |
Source: Spanish Ministry of Health, Social Services, and Equality.14
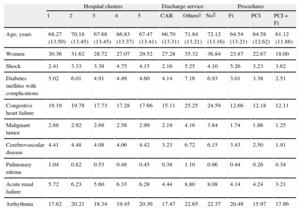
The distribution of the risk-adjustment variables according to the independent variables analyzed is shown in Table 5.
Distribution of the Risk-adjustment Variables According to the Independent Variables Analyzed
| Hospital clusters | Discharge service | Procedures | |||||||||
| 1 | 2 | 3 | 4 | 5 | CAR | Othersa | Nob | Fi | PCI | PCI+Fi | |
| Age, years | 68.27 (13.50) | 70.18 (13.45) | 67.68 (13.45) | 66.83 (13.37) | 67.47 (13.41) | 66.70 (13.31) | 71.84 (13.21) | 72.12 (13.16) | 64.54 (13.21) | 64.58 (12.62) | 61.12 (11.88) |
| Women | 30.36 | 31.62 | 28.72 | 27.07 | 29.52 | 27.28 | 35.32 | 36.84 | 23.87 | 22.67 | 18.00 |
| Shock | 2.41 | 3.33 | 3.38 | 4.75 | 4.15 | 2.16 | 5.25 | 4.10 | 5.26 | 3.23 | 3.62 |
| Diabetes mellitus with complications | 5.02 | 6.01 | 4.91 | 4.49 | 4.60 | 4.14 | 7.16 | 6.93 | 3.01 | 3.38 | 2.51 |
| Congestive heart failure | 19.19 | 19.78 | 17.73 | 17.28 | 17.66 | 15.11 | 25.25 | 24.59 | 12.66 | 12.18 | 12.11 |
| Malignant tumor | 2.68 | 2.92 | 2.69 | 2.58 | 2.99 | 2.19 | 4.16 | 3.84 | 1.74 | 1.86 | 1.25 |
| Cerebrovascular disease | 4.41 | 4.48 | 4.08 | 4.06 | 4.42 | 3.23 | 6.72 | 6.15 | 3.43 | 2.50 | 1.91 |
| Pulmonary edema | 1.04 | 0.82 | 0.53 | 0.48 | 0.45 | 0.38 | 1.10 | 0.96 | 0.44 | 0.26 | 0.34 |
| Acute renal failure | 5.72 | 6.23 | 5.60 | 6.33 | 6.28 | 4.44 | 8.80 | 8.08 | 4.14 | 4.24 | 3.21 |
| Arrhythmia | 17.62 | 20.21 | 18.34 | 19.45 | 20.36 | 17.47 | 22.65 | 22.37 | 20.49 | 15.97 | 17.86 |
CAR, cardiology; Fi, fibrinolysis; PCI, percutaneous coronary intervention (angioplasty);
Analysis of variance, P<.05 for differences in age by clusters, services and procedures.
Chi-square, P<.05 for the distribution of all the risk factors among clusters, services and procedures, except in the case of the association between clusters and malignant tumor and cerebrovascular disease.
The data are expressed as percentages or mean (standard deviation).
There are statistically significant differences between the 3 groupings considered in the mean age of patients (analysis of variance, P<.05), as well as in the distribution of risk factors (chi-square, P<.05), except for the association of hospital cluster with malignant tumor and cerebrovascular disease. The distribution of the procedures according to clusters is presented in Table 6.
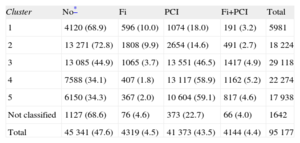
Distribution of Angioplasty Procedures and Fibrinolysis According to Hospital Clusters
| Cluster | No* | Fi | PCI | Fi+PCI | Total |
| 1 | 4120 (68.9) | 596 (10.0) | 1074 (18.0) | 191 (3.2) | 5981 |
| 2 | 13 271 (72.8) | 1808 (9.9) | 2654 (14.6) | 491 (2.7) | 18 224 |
| 3 | 13 085 (44.9) | 1065 (3.7) | 13 551 (46.5) | 1417 (4.9) | 29 118 |
| 4 | 7588 (34.1) | 407 (1.8) | 13 117 (58.9) | 1162 (5.2) | 22 274 |
| 5 | 6150 (34.3) | 367 (2.0) | 10 604 (59.1) | 817 (4.6) | 17 938 |
| Not classified | 1127 (68.6) | 76 (4.6) | 373 (22.7) | 66 (4.0) | 1642 |
| Total | 45 341 (47.6) | 4319 (4.5) | 41 373 (43.5) | 4144 (4.4) | 95 177 |
Fi, fibrinolysis; PCI, percutaneous coronary intervention (angioplasty).
Chi-square for the association between complexity (cluster) and PCI; P<.001.
The data are expressed as no. (%).
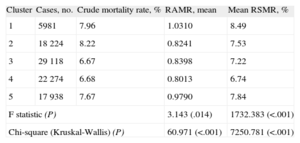
Significant differences were observed between the means of the RSMR related to cluster type (Table 7), to the services responsible for discharging the patients (Table 8), and to the type of procedure performed (Table 9). The F statistic provided by analysis of variance was significant in every case (P<.05), and when differences in the error variances were detected, the Kruskall-Wallis test was applied and the null hypothesis rejected. Tables 7–9 show the results obtained for the risk-adjusted mortality ratio, as additional information to enable comparison with other studies that use this method of adjustment.
Comparison of the Difference Between the Mean Risk-adjusted Mortality Ratio and the Mean Risk-standardized Mortality Ratio According to Cluster
| Cluster | Cases, no. | Crude mortality rate, % | RAMR, mean | Mean RSMR, % |
| 1 | 5981 | 7.96 | 1.0310 | 8.49 |
| 2 | 18 224 | 8.22 | 0.8241 | 7.53 |
| 3 | 29 118 | 6.67 | 0.8398 | 7.22 |
| 4 | 22 274 | 6.68 | 0.8013 | 6.74 |
| 5 | 17 938 | 7.67 | 0.9790 | 7.84 |
| F statistic (P) | 3.143 (.014) | 1732.383 (<.001) | ||
| Chi-square (Kruskal-Wallis) (P) | 60.971 (<.001) | 7250.781 (<.001) | ||
RAMR, risk-adjusted mortality ratio; RSMR, risk-standardized mortality ratio.
Episodes corresponding to hospitals not included in clusters 1 to 5 were excluded.
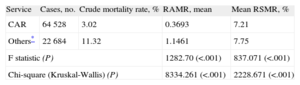
Comparison of the Difference Between the Mean Risk-adjusted Mortality Ratio and the Mean Risk-standardized Mortality Ratio According to Service Responsible for Discharge
| Service | Cases, no. | Crude mortality rate, % | RAMR, mean | Mean RSMR, % |
| CAR | 64 528 | 3.02 | 0.3693 | 7.21 |
| Others* | 22 684 | 11.32 | 1.1461 | 7.75 |
| F statistic (P) | 1282.70 (<.001) | 837.071 (<.001) | ||
| Chi-square (Kruskal-Wallis) (P) | 8334.261 (<.001) | 2228.671 (<.001) | ||
CAR, cardiology; RAMR, risk-adjusted mortality ratio; RSMR, risk-standardized mortality ratio.
Episodes corresponding to hospitals not included in clusters 1 to 5 were excluded.
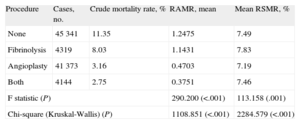
Comparison of the Difference Between the Mean Risk-adjusted Mortality Ratio and the Mean Risk-standardized Mortality Ratio According to Procedures
| Procedure | Cases, no. | Crude mortality rate, % | RAMR, mean | Mean RSMR, % |
| None | 45 341 | 11.35 | 1.2475 | 7.49 |
| Fibrinolysis | 4319 | 8.03 | 1.1431 | 7.83 |
| Angioplasty | 41 373 | 3.16 | 0.4703 | 7.19 |
| Both | 4144 | 2.75 | 0.3751 | 7.46 |
| F statistic (P) | 290.200 (<.001) | 113.158 (.001) | ||
| Chi-square (Kruskal-Wallis) (P) | 1108.851 (<.001) | 2284.579 (<.001) | ||
RAMR, risk-adjusted mortality ratio; RSMR, risk-standardized mortality ratio.
The analysis according to clusters (Table 7) showed that the hospitals in cluster 3 and, especially, cluster 4 had lower mortality (RSMR, 7.22% and 6.74%, respectively) than those in clusters 1 (8.49%), 2 (7.53%), and 5 (7.84%). The association between the RSMR and the clusters follows the same sequence as the crude mortality rate: higher in the less complex hospitals (approximately 8% for clusters 1 and 2). No revascularization procedure was carried out in 47.6% of the cases, whereas angioplasty was performed in 43.5% and fibrinolysis in 4.5% (Table 7). There is a clear association between complexity and the use of an interventional approach, and most of the angioplasties reported for the hospitals in clusters 1 and 2 were probably performed in a referral hospital with greater complexity.
The analysis according to the services responsible for patient discharge (Table 8) excludes those carried out by intensive care units (6.8% of all discharges), as this is an intermediate service. In all, 69% of the discharges were carried out by the cardiology services, which obtain better outcomes than all other services, excluding intensive care (RSMR, 7.22% and 7.84%, respectively) (Table 8).
The analysis according to the procedures performed shows better outcomes for angioplasty (RSMR, 7.19% for angioplasty and 7.83% for fibrinolysis) (Table 9). The group that did not undergo a revascularization procedure had more advanced mean age and higher proportions of women and comorbidities (Table 4).
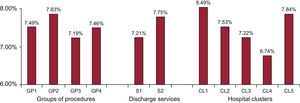
DISCUSSIONThis study demonstrates that, in the Spanish NHS, the probability of in-hospital survival after AMI is associated with the characteristics of the hospital, as well as with whether the discharge is carried out by the cardiology service and whether angioplasty has been performed (Fig. 2).
. CL1, cluster 1; CL2, cluster 2; CL3, cluster 3; CL4, cluster 4; CL5, cluster 5; GP1, no revascularization procedure; GP2, fibrinolysis; GP3, angioplasty; GP4, angioplasty+fibrinolysis; S1, cardiology; S2, other services.")
Risk-standardized mortality ratio according to groups of procedures performed, services responsible for patient discharge, and hospital clusters (P<.01). CL1, cluster 1; CL2, cluster 2; CL3, cluster 3; CL4, cluster 4; CL5, cluster 5; GP1, no revascularization procedure; GP2, fibrinolysis; GP3, angioplasty; GP4, angioplasty+fibrinolysis; S1, cardiology; S2, other services.
The recommendations of clinical practice guidelines24–26 and national agencies27–30 have promoted the development of health care networks to guarantee access of patients with AMI to angioplasty as the treatment of choice for acute coronary syndrome with ST segment elevation. In non-ST-segment elevation acute coronary syndrome, the guidelines recommend an invasive strategy in patients with moderate to high risk.31,32 Thus, AMI patients can be expected to have greater possibilities of survival if they have rapid access to centers at which interventional techniques can be performed.
The studies carried out in Spain reveal substantial differences between regions and between hospitals in the management of patients with AMI.33–40 The PRIAMHO I study found no significant differences in the mortality associated with access to a catheterization laboratory,41 whereas the PRIAMHO II study demonstrated that the improvement in 1-year mortality was related to better access, a more widespread use of reperfusion, and better therapeutic management at discharge.42 The IBERICA study reported a lower 28-day mortality rate among the AMI patients who were admitted to coronary care units,43 and a lower mortality due to AMI 30 days after hospital admission has been associated with the opening of a catheterization laboratory.44 The probability of an AMI patient dying during the hospital stay has been estimated to be 25% higher in hospitals that do not have an intensive care unit.35 Studies carried out by the Spanish Agencia de Evaluación de Tecnologías Sanitarias (Agency for the Evaluation of Heath Care Technologies) found a higher in-hospital mortality rate in AMI patients who did not undergo an interventional coronary procedure,45 but they did not report differences in mortality related to the technological level of the centers.16 The GYSCA study found that the treatment received by patients with non-ST elevation acute coronary syndrome admitted to hospitals with no catheterization laboratory differed more widely from that recommended by the guidelines; these investigators observed no significant differences in in-hospital mortality, but the incidence of readmission was significantly higher.38 The MASCARA study found no relationship between the performance of primary percutaneous coronary intervention in patients with ST-elevation acute coronary syndrome and survival at 6 months.36
The analysis of the RSMR estimated according to clusters results in a curve showing that mortality is significantly reduced as the size and complexity of the hospital increases; cluster 4, which corresponds to hospitals of over 500 beds and with a high level of complexity, obtains the best outcomes, followed by cluster 3 (more than 500 beds, intermediate complexity). The lack of association between complexity and better outcomes observed in cluster 5 may be due to several causes. Hospital complexes constitute a highly heterogeneous group, occasionally made up of several hospitals of different complexity (Table 4), a circumstance that makes it difficult to compare them with the other facilities. Use of a more specific grouping based on the characteristics of the units in which AMI is treated might produce different results in terms of the association between complexity and the RSMR. The size of the hospital may not be directly related to its technological capabilities, and the organizational complexity could result in poorer outcomes in hospitals with a large number of beds, having the same negative effect as it has on their efficacy.46
The study demonstrates an association between the cardiology unit as the service that discharges the patient and lower risk-adjusted in-hospital mortality, as well as between angioplasty and lower mortality, findings that corroborate the relationship between structure35,43 and processes45 and mortality. The variable that best discriminates the standardized mortality ratio is the hospital typology (cluster); in addition to the higher probability of care being provided in a cardiology service and including angioplasty, this classification probably captures other factors that this study does not analyze—such as the availability of an on-call cardiologist, a critical care unit,35,43 and a catheterization laboratory41,42—and other unknown aspects.
The findings indicate that a policy based on the regionalization of services,1,29,47 concentrating services and patients in hospitals with a certain complexity in which primary angioplasty can be performed,29,30,42 may reduce mortality without an increase (or even with a reduction) in costs. Thus, it is necessary to collect data on the structure and processes that are more specific to the complexity and the quality of cardiology care than the generic classification of hospitals according to clusters offered by the Spanish Ministry of Health, Social Services, and Equality.
In contrast to certain findings from prospective studies,36,38,41,42 we found a robust association between indicators of structure and process and the in-hospital mortality. In comparison with other studies, this is the first in Spain to consider all discharges of AMI patients from the Spanish NHS, employing a multilevel approach. The greater number of centers and cases considered and the use of validated risk adjustment methods may explain the differences in the findings.
LimitationsAs weaknesses of this study we can consider that it is a retrospective analysis, based on administrative data, and has the limitations inherent in procedures for determining risk-adjusted mortality. However, the use of administrative records to estimate outcomes in health services has been validated by comparing them with data from the medical records18 and has been applied to research on health service outcomes.9,11,12 The data from the minimum basic data set, which are subjected to quality auditing, provide valid information (Álvarez M. Análisis de la calidad del conjunto mínimo básico de datos estatal. Resultados del plan de auditorías 2011. Ministerio Sanidad, Servicios Sociales e Igualdad. XV Jornadas de la Sociedad Española de Documentación Clínica. Palma de Mallorca, Spain, 14-15 June 2012). The reliability of studies of this type enables the public comparison of hospitals in terms of outcomes.9 In contrast to the model developed by the Centers for Medicare & Medicaid Services, the mortality analyzed in the present study does not refer to a standardized period of time, but to the duration of the episode; in Spain, the organization of administrative data does not permit the consideration of time horizons with these characteristics. The use of the same personal identifiers for recording hospital discharges and deaths would enable follow-up of mortality outcomes.
With respect to the adjustment models, there are confounding factors that are impossible to identify, but that may have a significant impact. The secondary diagnoses employed as risk adjustment variables may correspond to conditions that are present on admission or to complications that, occasionally, may reflect inadequate treatment.18 Nevertheless, the models used in this study compare favorably with models published elsewhere15–17 in terms of their predictive capacity.
Studies that have evaluated the relationship between the duration of the hospital stay and mortality have shown a bias in favor of shorter stays,48 which in our study are the hospitals with worse outcomes (see supplementary material). This study, like other similar reports,6,9,15–19 includes episodes of AMI with and without ST segment elevation. Given that these two conditions differ in terms of prognosis and treatment, distinguishing between them may provide additional data. Another weakness, intrinsic in the methodology of studies of this type, is that there is no differentiation between primary angioplasty and procedures involving other types of angioplasty.
CONCLUSIONSThe most relevant conclusion of this study is probably that, in the Spanish NHS, the differences between hospitals help to explain the variation in the individual probability of dying from AMI. The type of hospital, the provision of care by a cardiology service, and the performance of a percutaneous coronary intervention are variables that, in this study, are independently and significantly associated with the survival of AMI patients admitted to NHS hospitals. We recommend the creation of care networks that favor percutaneous coronary intervention and the participation of cardiology services in the management of patients with AMI.
FUNDINGThis work for this report was funded by an unconditional grant from Menarini.
CONFLICTS OF INTERESTNone declared.
The authors thank the Spanish Ministry of Health, Social Services, and Equality for the facilities it has made available to the Spanish Society of Cardiology for the development of the RECALCAR study, with special gratitude to the General Directorate of Public Health, Quality, and Innovation and to Dr. María Ángeles Gogorcena and Dr. Mercedes Álvarez of the Spanish Health Information Institute.