The SCORE table indiscriminately recommends the use of total cholesterol (SCORE-TC) or atherogenic index (SCORE-AI) for calculating cardiovascular (CV) risk. We evaluated reliability and agreement between both methods and the clinical implications for the identification of high CV risk. Observational study (n=8942) in a 40- to 65-year-old population. Spearman's Rho correlation was 0.987 (P<.001), the agreement intraclass correlation coefficient was 0.671 (IC 95% 0.413–0.796; with Bland–Altman's method, the average of the differences between models was 0.74. Kappa index was poor, 0.297 (P<.001) and positive specific agreement was 0.31. Discrepancies fitted individuals with high CV risk with SCORE-TC and not-high with SCORE-AI (4.7%) and 5.8% (n=518) of individuals were classified as high-risk according to SCORE-TC vs. 1.1% (n=95) according to SCORE-AI. Poor agreement was found between SCORE-TC and SCORE-IA for identification of high cardiovascular risk individuals.
Keywords
To prioritize interventions in patients in primary cardiovascular (CV) prevention, we need to stratify their CV risk. In Spain, the adjusted REGICOR and SCORE functions are used for this purpose.1 However, in an earlier study, we concluded that discrepancies exist between the two charts.2
The SCORE project3 recommends risk calculation on the basis of total cholesterol (TC) or atherogenic index (AI), making no distinction between them, and this is accepted in European and Spanish clinical practice guidelines.4, 5, 6 Risk is considered high at values ≥5%.4, 5, 6 In the present study we aim to determine the consistency of the two calculations (SCORE-TC vs. SCORE-AI),3 the extent to which they agree when detecting high CV risk, and the profile of discrepant patients.
MethodsThe method used in this cross-sectional observational study was published earlier.2 Some 33,440 individuals participated within a program of preventive activities in the autonomous Comunidad Valenciana region of Spain. We analyzed 8942 individuals who initially presented high TC (≥200mg/dL). We enrolled patients aged 40–65 years,3 with no history of established CV disease, and with data on the CV risk calculation variables required by SCORE.3 We calculated the correlation between SCORE function values measured with TC and AI, modifying results in patients with diabetes to meet SCORE project recommendations.3 We used Spearman's Rho correlation coefficient for ordinal quantitative variables and studied the intraclass correlation coefficient (ICC) for agreement between the measures. We used the Bland–Altman technique to analyze data for individual differences.7 We studied agreement in the diagnosis of high risk (≥5%) for SCORE-TC versus SCORE-AI using the Kappa coefficient and the specific indices of agreement in positive and negative results. We described the profile of discrepant patients.
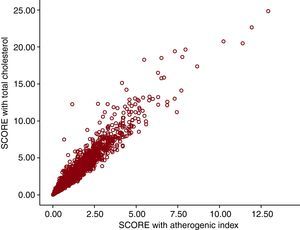
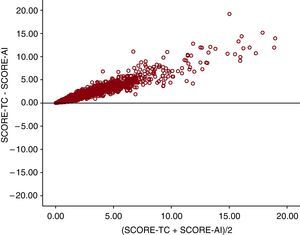
ResultsThe distribution of patients by risk (high or non-high) for each model and the agreement and discrepant profiles in high CV risk between the two models are in Table 1, Table 2, respectively. Spearman's Rho correlation coefficient was 0.987 (Figure 1) (P<.001). The Bland–Altman agreement plot (Figure 2) shows that as SCORE values increase, discrepancy increases too, although the mean difference was 0.74. The ICC was 0.671 (95% confidence interval, 0.413–0.796; P<.001). With SCORE-TC, high risk was present in 5.8% (n=518) of patients versus 1.1% (n=95) identified with SCORE-AI. The Kappa index was 0.297 (P<.001) (Table 1) and specific agreements were 0.310 for the positive and 0.976 for the negative result.
Table 1. Distribution of Patients According to SCORE High-Risk Classification Based on Total Cholesterol or Atherogenic Index.
| SCORE-TC | Total | ||
| High risk | Non-high risk | ||
| SCORE-AI | |||
| High risk | 95 (1.1) | 0 | 95 (1.1) |
| Non-high risk | 423 (4.7) | 8424 (94.2) | 8847 (98.9) |
| Total | 518 (5.8) | 8424 (94.2) | 8942 (100) |
TC, total cholesterol; AI, atherogenic index. K=0.297. Data express n (%).
Table 2. Characteristics of Agreement and Discrepant Patient Profiles in the Identification of High Risk Using the Two SCORE Function Methods.
| Patients with high risk with SCORE-TC and non-high risk with SCORE-AI (n=423) | Patients with high risk with SCORE-TC and high risk with SCORE-AI (n=95) | Total (n=8942) | |
| Age (years) | 60.9±3.6 | 62.4±2.7 | 51.3±7.3 |
| Men | 362.0 (85.6) | 76.0 (79.5) | 5357.0 (59.9) |
| BMI, kg/m2 | 28.8±4.1 | 32.2±13.3 | 27.7±4.7 |
| Smokers | 222.0 (52.2) | 55.0 (57.7) | 2477.0 (27.7) |
| Diabetes mellitus | 107.0 (25.3) | 56.0 (59.0) | 322.0 (3.6) |
| High blood pressure | 139.0 (32.9) | 45.0 (47.4) | 1288.0 (14.4) |
| Dyslipidemia | 92.0 (21.7) | 29.0 (30.8) | 1028.0 (11.5) |
| Baseline glucose level (mg/dL) | 119.2±44.1 | 149.3±43.2 | 97.3±24.3 |
| Total cholesterol (mg/dL) | 244.4±50.4 | 221.8±45.2 | 223.3±39.6 |
| LDL cholesterol (mg/dL) | 154.3±36.6 | 141.1±42.4 | 139.2±36.3 |
| HDL cholesterol (mg/dL) | 54.3±15.1 | 54.2±16.9 | 59.5±16.9 |
| Triglycerides (mg/dL) | 155.3±75.4 | 151.0±105.8 | 124.3±81.4 |
| AI | 4.76±1.49 | 4.48±1.38 | 4.02±1.29 |
| Systolic BP (mmHg) | 145.0±17.1 | 163.5±17.7 | 127.3±17.1 |
| Diastolic BP (mmHg) | 84.2±10.8 | 89.7±11.3 | 78.2±10.9 |
AI, atherogenic index; BMI, body mass index; BP, blood pressure; HDL, high-density lipoprotein; LDL, low-density lipoprotein;TC, total cholesterol.
Data express n (%) or mean±standard deviation.

Figure 1. SCORE function cardiovascular risk values: Spearman's Rho correlation coefficient for values calculated with total cholesterol total or atherogenic index (Rho=0.987; P<.001).

Figure 2. Bland–Altman agreement for the two methods of calculating cardiovascular risk using total cholesterol (TC) or atherogenic index (AI).
DiscussionOur data confirm the high degree of consistency between SCORE-TC and SCORE-AI calculations,3 as Spearman's coefficient, the ICC and Bland–Altman results are all good. However, correlation coefficients are not the best means of expressing agreement because even if two measures are closely related, they may not give the same result. This is fundamental when studying the diagnosis of patients as being at high risk or not, due to the prognostic consequences entailed.
The Kappa index for high CV risk diagnosis is low because of the many discrepancies that point in the same direction: SCORE-TC diagnoses high risk when SCORE-AI diagnoses non-high risk. The Bland–Altman method graphs this, showing that as SCORE function values increase, discrepancies increase too.
The influence of the imbalance between positive and negative results depends on the prevalence of the condition being studied (in this case, ≥5% risk). This implies that simply because of the greater prevalence of high risk, we obtain a higher Kappa index score. Given that in Spain the incidence of ≥5% risk may be lower than elsewhere, this could partly explain why we obtain such low agreement.
Over 80% of patients with high CV risk measured with SCORE-TC would not, in daily clinical practice, be identified as such with SCORE-AI. This discrepant group represents 5% of the sample. These patients present many CV risk-factors and have little control over them. Among men the evidence is clearest in the use of statins in primary prevention to reduce CV mortality.8
The opposite interpretation is equally valid: the SCORE-TC method classifies as high-risk many patients (4.7%; n=423) who SCORE-AI would not identify as such. This would justify fewer therapeutic interventions in the Spanish population, which typically has higher high-density lipoprotein (HDL) cholesterol levels than other Europeans.9 We should remember that the CV risk tables for countries with low incidence were largely based on populations in Belgium and Italy, where mean CV risk is approximately 30% greater than in Spain.10, 11
We cannot recommend one method (SCORE-TC or SCORE-AI) over the other, since we would need to conduct a cohort study to do so. However, our data do demonstrate that the number of high-risk patients is five times greater with SCORE-TC than with SCORE-AI, and that the discrepancies in high CV risk classification are worrying.
One possible explanation could lie in the fact that our sample presents a high global mean for HDL cholesterol—nearly 60mg/dL—which the Adult Treatment Panel III considers a protective CV risk factor.12 This might be due to the fact that, despite worrying changes, the traditional Mediterranean diet continues to hold sway in Spain.13, 14
An adjusted SCORE function has recently been published for Spain,15 so it seems appropriate to determine whether we should use this new chart to calculate CV risk with TC or AI.
We conclude that in the Spanish population, which typically presents high levels of HDL cholesterol, a lack of agreement exists between the SCORE-TC and SCORE-AI methods when used to detect high-risk patients in that SCORE-TC overestimates and SCORE-AI underestimates high CV risk.
Conflicts of interestNone declared.
Received 23 March 2010
Accepted 20 June 2010
Corresponding author: Cátedra Medicina de Familia, Departamento Medicina, Universidad Miguel Hernández, Ctra Valencia-Alicante s/n. 03550 – San Juan de Alicante, Alicante, Spain. atencion.primaria@umh.es