Estimate leptin reference values and calculate leptinemia cutoff values for identifying cardiometabolic abnormalities in Spain.
MethodsCross-sectional study carried out between 2008 and 2010 in 11 540 individuals representing the Spanish population aged ≥ 18 years. Data were obtained by standardized physical examination and analyses were performed at a central laboratory. Leptinemia was measured using ELISA. Cardiometabolic abnormality was defined as the presence of at least two of the following: high blood pressure, high triglycerides, reduced high density lipoprotein cholesterol, high insulin resistance values, and elevated C-reactive protein and glucose.
ResultsLeptin values were higher in women than men (geometric mean, 21.9 and 6.6 ng/mL; P<.001). The median [interquartile range] was 24.5 [14.1-37.0] ng/mL in women, and 7.2 [3.3-14.3] ng/mL in men. In the multivariate analysis, leptin was significantly associated with anthropometric measures, insulin, and C-reactive protein, and inversely associated with age, smoking, and physical activity in women (r2=0.53; P<.001) and in men (r2=0.61; P<.001). The leptin values that identified cardiometabolic abnormality were 23.75 ng/mL in women (area under the curve, 0.722; sensitivity, 72.3%; specificity, 58.7%) and 6.45 ng/mL in men (area under the curve, 0.716; sensitivity, 71.4%; specificity, 60.2%).
ConclusionsThese results facilitate the interpretation of leptin values in clinical and population studies. Leptin has moderate sensitivity and specificity for identifying cardiometabolic abnormalities.
Keywords
Leptin, a peptide described in 1994, is synthesized by adipocytes, and its serum concentration reflects the body's energy reservoir1. Leptin acts on the hypothalamic receptors and influences the expression of different neuropeptides that regulate energy balance by decreasing food intake and increasing energy expenditure and sympathetic tone in response to normal weight gain1.
Traditionally, body mass index (BMI) has been used to assess the degree of obesity. However, BMI has limitations in detecting adiposity in individuals with BMI<302–4; recent studies have highlighted the usefulness of leptin for improving the accuracy of BMI in assessing the percentage of body fat when dual-energy X-ray absorptiometry (DXA) is not available, and may represent a future marker for obesity.5 The association between leptin and hypertension has also been studied,6,7 and it has been suggested that it may activate the sympathetic nervous system, increasing blood pressure8,9 or even increasing risk of hypertension.10–12 Leptin has also been found to be related to biological cardiovascular risk factors13 and to the development of cardiovascular disease.14–20 Finally, it has been reported that consumption of fiber and vegetables, physical activity, and smoking are inversely associated with leptinemia.21–24
There are few population-based studies, particularly in samples of a reasonable size and representing entire countries, on the link between leptin concentrations and obesity and other cardiovascular risk factors.14–16,25–32 This information could be relevant for more precise estimates of fat mass and its potential role in mediating cardiometabolic risk. Moreover, there are no studies that explore the ability of leptin to predict cardiometabolic abnormality. Therefore, the aim of this study was to estimate the leptin reference values and calculate leptinemia cutoff values for identifying cardiometabolic abnormalities in women and men from the general population of Spain.
PARTICIPANTS AND METHODSData were obtained from The Nutrition and Cardiovascular Risk in Spain Study, the methodology of which was previously described.33 In brief, the study was conducted between June 2008 and October 2010, and included 12 948 people representing the noninstitutionalized Spanish population aged ≥ 18 years. Participants were selected by stratified cluster sampling. Data on sociodemographic and lifestyle variables were collected via telephone interview, and personal interviews, physical examinations, and collection of blood and urine samples were performed during two home visits. Data collection staff received training in the study's procedures.
Written informed consent was obtained from all participants. The study was approved by the Clinical Research Ethics Committees of Hospital Universitario La Paz (Madrid), and Hospital Clinic (Barcelona).
Study VariablesWe used reported data on age, sex, educational level, smoking and diagnosed morbidity. In addition, we obtained a computerized dietary history on normal food consumption during the previous year, and calculated the number of kcal/day and the Healthy Eating Index (HEI).34 The following cutoff points were considered: poor diet (< 59.5), adequate (59.5-63.7), good (63.8-65.5), very good (65.6-67.5) and excellent (> 67.5).
Physical activity was measured using the EPIC Study questionnaire, which combines physical activity at work and during leisure time (Cambridge index).35 This index has been shown to accurately estimate cardiovascular risk and all-cause mortality.36 We also evaluated compliance with physical activity guidelines from the European Union and the World Health Organization (EU/WHO)37, which recommend ≥ 2.5hours of moderate intensity activity or ≥ 1 hour of vigorous intensity activity per week.
We measured each individual's weight, height, and waist circumference using electronic scales (Seca 841; precision, 0.1 kg), portable extendable stadiometers (KaWe44 444Seca), and non-elastic flexible measuring tapes with buckles, respectively. Blood pressure was measured using validated automatic devices (Omron Model M6) according to standard procedures.38
Samples of blood and urine were obtained from each participant at home after 12hours fasting. We measured glucose, C-reactive protein (CRP), glycosylated hemoglobin (HbA1c), insulin, total cholesterol, triglycerides, high-density lipoprotein cholesterol (HDL-C), and low-density lipoprotein cholesterol (LDL-C), which was calculated using Friedewald formula. Serum leptin was measured by enzyme immunoassay using two monoclonal antibodies (DBC, Diagnosis Biochem Canada, Inc.), automated using a BEST2000 robot. The sensitivity of this test was 0.5 ng/mL, and the intra- and inter-assay variation coefficients were 7.47% and 9.6%, respectively. These analyses were carried out using standardized methods at a central laboratory.
Cardiovascular Risk FactorsThe BMI was calculated as weight in kilos divided by the square of height in meters. Abdominal obesity was defined as waist circumference > 102cm in men and > 88cm in women. Hypertension was defined as blood pressure ≥ 140/90mmHg or if the patient was taking antihypertensive medication; diabetes mellitus as casual blood glucose ≥ 126mg/dL, HbA1c ≥ 6.5%, or treatment with oral antidiabetic agents or insulin; hyperlipidemia as LDL-C ≥ 115mg/dL or lipid-lowering drug treatment, and smoking as any level of tobacco consumption.
According to the harmonized definition,39 the diagnosis of metabolic syndrome requires meeting at least 3 of the following 5 criteria: waist circumference ≥ 102cm for men and ≥ 88 cm for women; fasting glucose ≥ 100mg/dL; blood pressure ≥ 130/85mmHg; triglycerides ≥ 150mg/dL, and HDL-C<40mg/dL in men, and<50mg/dl in women. Insulin resistance was estimated using the Homeostasis Model Assessment-Insulin Resistance (HOMA-IR)40 and the following formula: insulin (mU/mL) × (glucose [mg/dL]/405). Insulin resistance was defined as HOMA-IR ≥ the 75th percentile (p75) and high leptin as ≥ p75 in our sex-stratified population, as in previous studies.20
Cardiometabolic abnormality was defined as the presence of 2 or more of the following: high blood pressure (systolic ≥ 130 and/or diastolic ≥ 85mmHg or undergoing antihypertensive treatment); high triglycerides (≥ 150mg/dL); low HDL-C (< 40mg/dL in men and<50mg/dL in women or undergoing lipid-lowering therapy); high glucose (≥ 100mg/dL or antidiabetic treatment); insulin resistance (HOMA-IR > 4.05, p90) and elevated CRP (> 0.74mg/dL, p90).41
Statistical AnalysisAnalyses were performed in 11 540 participants with complete data for all variables. The normality of the variables studied was verified by performing logarithmic transformation for leptin, triglycerides, insulin, PCR, and HOMA-IR, due to their skewed distributions.
Leptin levels were expressed as the geometric mean (standard deviation) the standard error of the mean and percentiles. We used the Student-Fisher t-test to compare means, and the chi-square test to compare proportions.
We used multiple linear regression to perform a multivariate analysis including age, BMI, waist circumference, blood pressure, glucose, cholesterol, log-triglycerides, HDL-C, LDL-C, fibrinogen, log-insulin, log-CRP, log-HOMA-IR, tobacco consumption, food intake (kcal/day), HEI, and the Cambridge index of physical activity. Variables were selected from the results of the bivariate analysis.
Receiver Operating Characteristic (ROC) curves were constructed to assess the ability of leptin to identify cardiometabolic abnormalities and metabolic syndrome by calculating the area under the curve and the 95% confidence intervals (95% CI); leptin values with highest sensitivity and specificity, and their 95% CI, are indicated.
Analyses were performed separately in men and women. Individual observations were weighted to represent the Spanish population. We considered P<.05 as the threshold of statistical significance. All analyses were performed using SPSS v19.0.
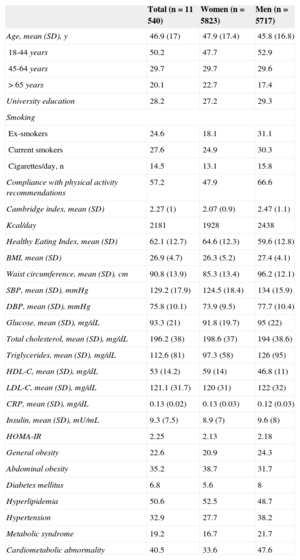
RESULTSThe main demographic and clinical characteristics of the study participants are shown in Table 1.
General Characteristics of the Sample
| Total (n=11 540) | Women (n=5823) | Men (n=5717) | |
|---|---|---|---|
| Age, mean (SD), y | 46.9 (17) | 47.9 (17.4) | 45.8 (16.8) |
| 18-44 years | 50.2 | 47.7 | 52.9 |
| 45-64 years | 29.7 | 29.7 | 29.6 |
| > 65 years | 20.1 | 22.7 | 17.4 |
| University education | 28.2 | 27.2 | 29.3 |
| Smoking | |||
| Ex-smokers | 24.6 | 18.1 | 31.1 |
| Current smokers | 27.6 | 24.9 | 30.3 |
| Cigarettes/day, n | 14.5 | 13.1 | 15.8 |
| Compliance with physical activity recommendations | 57.2 | 47.9 | 66.6 |
| Cambridge index, mean (SD) | 2.27 (1) | 2.07 (0.9) | 2.47 (1.1) |
| Kcal/day | 2181 | 1928 | 2438 |
| Healthy Eating Index, mean (SD) | 62.1 (12.7) | 64.6 (12.3) | 59.6 (12.8) |
| BMI, mean (SD) | 26.9 (4.7) | 26.3 (5.2) | 27.4 (4.1) |
| Waist circumference, mean (SD), cm | 90.8 (13.9) | 85.3 (13.4) | 96.2 (12.1) |
| SBP, mean (SD), mmHg | 129.2 (17.9) | 124.5 (18.4) | 134 (15.9) |
| DBP, mean (SD), mmHg | 75.8 (10.1) | 73.9 (9.5) | 77.7 (10.4) |
| Glucose, mean (SD), mg/dL | 93.3 (21) | 91.8 (19.7) | 95 (22) |
| Total cholesterol, mean (SD), mg/dL | 196.2 (38) | 198.6 (37) | 194 (38.6) |
| Triglycerides, mean (SD), mg/dL | 112.6 (81) | 97.3 (58) | 126 (95) |
| HDL-C, mean (SD), mg/dL | 53 (14.2) | 59 (14) | 46.8 (11) |
| LDL-C, mean (SD), mg/dL | 121.1 (31.7) | 120 (31) | 122 (32) |
| CRP, mean (SD), mg/dL | 0.13 (0.02) | 0.13 (0.03) | 0.12 (0.03) |
| Insulin, mean (SD), mU/mL | 9.3 (7.5) | 8.9 (7) | 9.6 (8) |
| HOMA-IR | 2.25 | 2.13 | 2.18 |
| General obesity | 22.6 | 20.9 | 24.3 |
| Abdominal obesity | 35.2 | 38.7 | 31.7 |
| Diabetes mellitus | 6.8 | 5.6 | 8 |
| Hyperlipidemia | 50.6 | 52.5 | 48.7 |
| Hypertension | 32.9 | 27.7 | 38.2 |
| Metabolic syndrome | 19.2 | 16.7 | 21.7 |
| Cardiometabolic abnormality | 40.5 | 33.6 | 47.6 |
BMI, body mass index; CRP, C-reactive protein; DBP, diastolic blood pressure; HDL-C, high density lipoprotein cholesterol; HOMA-IR, Homeostasis Model Assessment-Insulin Resistance; LDL-C, low density lipoprotein cholesterol; SBP, systolic blood pressure: SD, standard deviation.
Unless otherwise indicated, values are expressed as mean (standard deviation) or percentages.
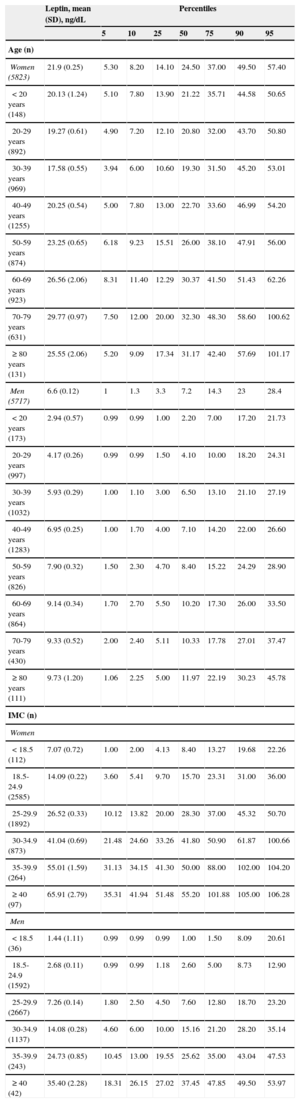
Leptin concentrations were approximately 3 times higher in women than in men (geometric mean 21.9 and 6.6 ng/mL, respectively) and increased with increasing BMI and age (Table 2); the median was 24.5 [14.1-37.0] ng/mL in women and 7.2 [3.3-14.3] ng/mL in men. Mean leptin in men for each age group was as follows: 18-44 years, 5.2 ng/mL; 45-64 years, 8.1 ng/mL, and ≥ 65 years, 9.4 ng/mL. For women, the values were 18.7 ng/mL, 23.1 ng/mL, and 28.4 ng/ml, respectively.
Leptin Values by Age, Sex, and BMI in Spain
| Leptin, mean (SD), ng/dL | Percentiles | |||||||
|---|---|---|---|---|---|---|---|---|
| 5 | 10 | 25 | 50 | 75 | 90 | 95 | ||
| Age (n) | ||||||||
| Women (5823) | 21.9 (0.25) | 5.30 | 8.20 | 14.10 | 24.50 | 37.00 | 49.50 | 57.40 |
| <20 years (148) | 20.13 (1.24) | 5.10 | 7.80 | 13.90 | 21.22 | 35.71 | 44.58 | 50.65 |
| 20-29 years (892) | 19.27 (0.61) | 4.90 | 7.20 | 12.10 | 20.80 | 32.00 | 43.70 | 50.80 |
| 30-39 years (969) | 17.58 (0.55) | 3.94 | 6.00 | 10.60 | 19.30 | 31.50 | 45.20 | 53.01 |
| 40-49 years (1255) | 20.25 (0.54) | 5.00 | 7.80 | 13.00 | 22.70 | 33.60 | 46.99 | 54.20 |
| 50-59 years (874) | 23.25 (0.65) | 6.18 | 9.23 | 15.51 | 26.00 | 38.10 | 47.91 | 56.00 |
| 60-69 years (923) | 26.56 (2.06) | 8.31 | 11.40 | 12.29 | 30.37 | 41.50 | 51.43 | 62.26 |
| 70-79 years (631) | 29.77 (0.97) | 7.50 | 12.00 | 20.00 | 32.30 | 48.30 | 58.60 | 100.62 |
| ≥ 80 years (131) | 25.55 (2.06) | 5.20 | 9.09 | 17.34 | 31.17 | 42.40 | 57.69 | 101.17 |
| Men (5717) | 6.6 (0.12) | 1 | 1.3 | 3.3 | 7.2 | 14.3 | 23 | 28.4 |
| <20 years (173) | 2.94 (0.57) | 0.99 | 0.99 | 1.00 | 2.20 | 7.00 | 17.20 | 21.73 |
| 20-29 years (997) | 4.17 (0.26) | 0.99 | 0.99 | 1.50 | 4.10 | 10.00 | 18.20 | 24.31 |
| 30-39 years (1032) | 5.93 (0.29) | 1.00 | 1.10 | 3.00 | 6.50 | 13.10 | 21.10 | 27.19 |
| 40-49 years (1283) | 6.95 (0.25) | 1.00 | 1.70 | 4.00 | 7.10 | 14.20 | 22.00 | 26.60 |
| 50-59 years (826) | 7.90 (0.32) | 1.50 | 2.30 | 4.70 | 8.40 | 15.22 | 24.29 | 28.90 |
| 60-69 years (864) | 9.14 (0.34) | 1.70 | 2.70 | 5.50 | 10.20 | 17.30 | 26.00 | 33.50 |
| 70-79 years (430) | 9.33 (0.52) | 2.00 | 2.40 | 5.11 | 10.33 | 17.78 | 27.01 | 37.47 |
| ≥ 80 years (111) | 9.73 (1.20) | 1.06 | 2.25 | 5.00 | 11.97 | 22.19 | 30.23 | 45.78 |
| IMC (n) | ||||||||
| Women | ||||||||
| <18.5 (112) | 7.07 (0.72) | 1.00 | 2.00 | 4.13 | 8.40 | 13.27 | 19.68 | 22.26 |
| 18.5-24.9 (2585) | 14.09 (0.22) | 3.60 | 5.41 | 9.70 | 15.70 | 23.31 | 31.00 | 36.00 |
| 25-29.9 (1892) | 26.52 (0.33) | 10.12 | 13.82 | 20.00 | 28.30 | 37.00 | 45.32 | 50.70 |
| 30-34.9 (873) | 41.04 (0.69) | 21.48 | 24.60 | 33.26 | 41.80 | 50.90 | 61.87 | 100.66 |
| 35-39.9 (264) | 55.01 (1.59) | 31.13 | 34.15 | 41.30 | 50.00 | 88.00 | 102.00 | 104.20 |
| ≥ 40 (97) | 65.91 (2.79) | 35.31 | 41.94 | 51.48 | 55.20 | 101.88 | 105.00 | 106.28 |
| Men | ||||||||
| < 18.5 (36) | 1.44 (1.11) | 0.99 | 0.99 | 0.99 | 1.00 | 1.50 | 8.09 | 20.61 |
| 18.5-24.9 (1592) | 2.68 (0.11) | 0.99 | 0.99 | 1.18 | 2.60 | 5.00 | 8.73 | 12.90 |
| 25-29.9 (2667) | 7.26 (0.14) | 1.80 | 2.50 | 4.50 | 7.60 | 12.80 | 18.70 | 23.20 |
| 30-34.9 (1137) | 14.08 (0.28) | 4.60 | 6.00 | 10.00 | 15.16 | 21.20 | 28.20 | 35.14 |
| 35-39.9 (243) | 24.73 (0.85) | 10.45 | 13.00 | 19.55 | 25.62 | 35.00 | 43.04 | 47.53 |
| ≥ 40 (42) | 35.40 (2.28) | 18.31 | 26.15 | 27.02 | 37.45 | 47.85 | 49.50 | 53.97 |
BMI, body mass index; SD, standard deviation.
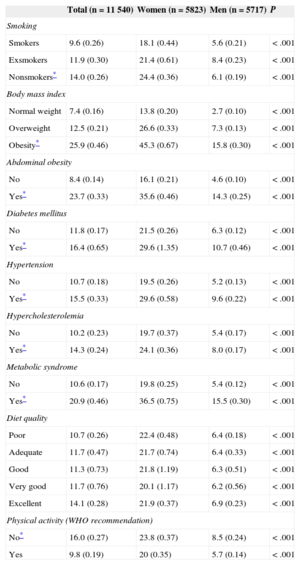
Smokers were observed to have lower leptin levels than nonsmokers (9.55 compared to 13.98 ng/mL) (Table 3). Individuals with obesity (general and abdominal), hypertension, diabetes mellitus, hypercholesterolemia, and metabolic syndrome had higher leptin values than those with normal weight (P<.001). We observed no differences in leptin levels as a function of the diet quality index. Leptin was 40% lower in individuals who adhered to physical activity recommendations (P<.001).
Leptin Values Stratified by Cardiovascular Risk Factors and Sex
| Total (n=11 540) | Women (n=5823) | Men (n=5717) | P | |
|---|---|---|---|---|
| Smoking | ||||
| Smokers | 9.6 (0.26) | 18.1 (0.44) | 5.6 (0.21) | < .001 |
| Exsmokers | 11.9 (0.30) | 21.4 (0.61) | 8.4 (0.23) | < .001 |
| Nonsmokers* | 14.0 (0.26) | 24.4 (0.36) | 6.1 (0.19) | < .001 |
| Body mass index | ||||
| Normal weight | 7.4 (0.16) | 13.8 (0.20) | 2.7 (0.10) | < .001 |
| Overweight | 12.5 (0.21) | 26.6 (0.33) | 7.3 (0.13) | < .001 |
| Obesity* | 25.9 (0.46) | 45.3 (0.67) | 15.8 (0.30) | < .001 |
| Abdominal obesity | ||||
| No | 8.4 (0.14) | 16.1 (0.21) | 4.6 (0.10) | < .001 |
| Yes* | 23.7 (0.33) | 35.6 (0.46) | 14.3 (0.25) | < .001 |
| Diabetes mellitus | ||||
| No | 11.8 (0.17) | 21.5 (0.26) | 6.3 (0.12) | < .001 |
| Yes* | 16.4 (0.65) | 29.6 (1.35) | 10.7 (0.46) | < .001 |
| Hypertension | ||||
| No | 10.7 (0.18) | 19.5 (0.26) | 5.2 (0.13) | < .001 |
| Yes* | 15.5 (0.33) | 29.6 (0.58) | 9.6 (0.22) | < .001 |
| Hypercholesterolemia | ||||
| No | 10.2 (0.23) | 19.7 (0.37) | 5.4 (0.17) | < .001 |
| Yes* | 14.3 (0.24) | 24.1 (0.36) | 8.0 (0.17) | < .001 |
| Metabolic syndrome | ||||
| No | 10.6 (0.17) | 19.8 (0.25) | 5.4 (0.12) | < .001 |
| Yes* | 20.9 (0.46) | 36.5 (0.75) | 15.5 (0.30) | < .001 |
| Diet quality | ||||
| Poor | 10.7 (0.26) | 22.4 (0.48) | 6.4 (0.18) | < .001 |
| Adequate | 11.7 (0.47) | 21.7 (0.74) | 6.4 (0.33) | < .001 |
| Good | 11.3 (0.73) | 21.8 (1.19) | 6.3 (0.51) | < .001 |
| Very good | 11.7 (0.76) | 20.1 (1.17) | 6.2 (0.56) | < .001 |
| Excellent | 14.1 (0.28) | 21.9 (0.37) | 6.9 (0.23) | < .001 |
| Physical activity (WHO recommendation) | ||||
| No* | 16.0 (0.27) | 23.8 (0.37) | 8.5 (0.24) | < .001 |
| Yes | 9.8 (0.19) | 20 (0.35) | 5.7 (0.14) | < .001 |
WHO, World Health Organization.
Values are expressed as geometric mean (standard error).
The mean values of leptin in p75 were 14.3 ng/mL in men, and 37 ng/mL in women. The value of HOMA-IR in p75 was 2.64 (2.8 in men, 2.5 in women). The p75 of the CRP values was 0.34mg/dL (0.30mg/dL in men, 0.37mg/dL in women).
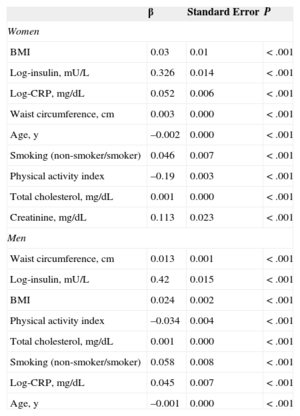
Table 4 shows the results of the multivariate analysis using multiple linear regression for variables that were significantly and independently associated with log-leptin. The anthropometric measures, insulin, total cholesterol, and CRP were significantly and directly associated with leptin, whereas age, smoking, and physical activity showed significant inverse association with leptin in women (r2=0.53; P<.001) and men (r2=0.61; P<.001).
Multiple Linear Regression Analysis Including Factors That Were Significantly and Independently Associated With Log-leptin in Women and Men
| β | Standard Error | P | |
|---|---|---|---|
| Women | |||
| BMI | 0.03 | 0.01 | < .001 |
| Log-insulin, mU/L | 0.326 | 0.014 | < .001 |
| Log-CRP, mg/dL | 0.052 | 0.006 | < .001 |
| Waist circumference, cm | 0.003 | 0.000 | < .001 |
| Age, y | –0.002 | 0.000 | < .001 |
| Smoking (non-smoker/smoker) | 0.046 | 0.007 | < .001 |
| Physical activity index | –0.19 | 0.003 | < .001 |
| Total cholesterol, mg/dL | 0.001 | 0.000 | < .001 |
| Creatinine, mg/dL | 0.113 | 0.023 | < .001 |
| Men | |||
| Waist circumference, cm | 0.013 | 0.001 | < .001 |
| Log-insulin, mU/L | 0.42 | 0.015 | < .001 |
| BMI | 0.024 | 0.002 | < .001 |
| Physical activity index | –0.034 | 0.004 | < .001 |
| Total cholesterol, mg/dL | 0.001 | 0.000 | < .001 |
| Smoking (non-smoker/smoker) | 0.058 | 0.008 | < .001 |
| Log-CRP, mg/dL | 0.045 | 0.007 | < .001 |
| Age, y | –0.001 | 0.000 | < .001 |
BMI, body mass index; CRP, C-reactive protein.
Women, r2=0.53; men, r2=0.61.
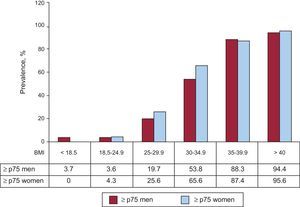
Leptin tended to increase with increasing BMI, although 7.6% of men and 4.3% of women with BMI<25 have high leptin (≥ p75) (Figure 1). Conversely, 80.3% of overweight men and 74.4% of overweight women, and 46.2% and 34.4% with mild obesity (BMI 30-34.9) had low leptin (

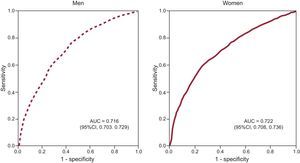
The ROC curve analysis showed that the leptin cutoff values to maximize sensitivity and specificity in identifying cardiometabolic abnormalities were 6.45 ng/ml in men (area under the curve, 0.716; sensitivity, 71.4%; 95%CI, 70.06%-73.74%; specificity, 60.2%, 95%CI, 58.82%-62.32%) and 23.75 ng/mL in women (area under the curve, 0.722; sensitivity, 72.3%; 95%CI, 70.40%-74.41%; specificity, 58.7%; 95%CI, 56.96%-60.07%) (Figure 2). We also calculated the leptin cutoff values that maximized sensitivity and specificity in identifying metabolic syndrome. In men these were 8.95 ng/mL (area under the curve, 0.768; 95%CI, 0.754-0.781), with 76.7% sensitivity and 65.7% specificity; in women they were 27.25 ng/mL (area under the curve, 0.748; 95%CI, 0.732-0.765) with 74.7% sensitivity and 62.7% specificity.
 and 23.75 ng/mL for women (area under the curve, 0.722; sensitivity, 72.3; specificity, 58.7%). AUC, area under the curve.")
Leptin receiver operating characteristics curves for identifying cardiometabolic abnormalities in men and women. The leptin cutoff value that maximizes sensitivity and specificity is 6.45 ng/mL for men (area under the curve, 0.716; sensitivity, 71.4%; specificity, 60.2%) and 23.75 ng/mL for women (area under the curve, 0.722; sensitivity, 72.3; specificity, 58.7%). AUC, area under the curve.
This is the first population-based study that provides data on leptin reference values representing an entire European country, which facilitates interpretation of leptin results in clinical and population studies. We observed significant differences in leptin levels between the sexes. Leptin was significantly and directly associated with anthropometric measures, insulin, total cholesterol and CRP, and inversely associated with age, smoking, and physical activity. Finally, leptin has moderate sensitivity and specificity for identifying cardiometabolic abnormality in both sexes.
The only national baseline studies have been conducted in the United States based on the National Health and Nutrition Examination Survey (NHANES). An analysis of NHANES 1988-199425 reported lower leptin values than our results, which may be due to the fact that these American data are from two decades ago, when the prevalence of obesity was lower than today. Nonetheless, Sierra-Johnson et al20 reported lower leptin values than the Spanish figures, using data from NHANES III study. They established values >p75 (>7.6 ng/dL in men, 23.6 ng/dL in women) as denoting “high leptin”; these values are also lower than those obtained for the same percentile in our study (14.3 ng/dL in men, 37 ng/dL in women). More recent studies in North America (1998-2009)5 reported higher mean leptin than in our study, which may be due to the increased prevalence of obesity in the United States. Moreover, these differences may be conditioned by ethnic differences, since leptin is higher in African American women and lower in Asian women27–29,31.
To our knowledge, there are no published studies that explore the ability of leptin to identify cardiometabolic abnormality, and our results indicate that leptin might be useful for this. Recent studies in Spain have reported an association between leptin and other markers of inflammation and metabolic syndrome, diabetes mellitus and obesity42. The reported prevalence (40.5%) of cardiometabolic abnormality is approximately 20% higher than that of metabolic syndrome described in Spain,43 perhaps due to the inclusion of insulin resistance and CRP, which extend the criteria with respect to metabolic syndrome only.
Regarding its relationship with blood pressure, the available studies report that high levels of leptin are associated with blood pressure and the onset of hypertension.6,7,10–12 We observed a general association with hypertension in both sexes that was not maintained in the multivariate analysis, whereas other studies found this association only in men11 or only in women.44 These discrepancies could be explained by methodological differences and overfitting of the mathematical models that treat obesity as a confounder, when it may actually behave as an intermediate variable in the development of hypertension. Some authors suggest that only Mendelian randomization could demonstrate that leptin is a mediator of hypertension.45
Our results on the association between leptin and inflammatory markers of cardiovascular risk such as CRP and metabolic markers such as LDL-C and insulin resistance are consistent with those of previous studies.13,27,28 Note that, as with leptin, the degree of insulin resistance is higher in our population than in Asian populations.27,28
In relation to diet, our data are consistent with NHANES III,46 where no relationship was observed between eating patterns and leptin, although leptin was higher in the group with the highest consumption of vegetables, where lower caloric intake was reported. As in this study, other studies have also indicated that leptin is inversely associated with smoking and physical activity.24,47
The positive association between leptin and anthropometric measures, insulin, cholesterol, and CRP, and the inverse association with age and lifestyle variables such as smoking and physical activity are consistent with those described in previous population-based studies in different settings.25–28
Like other studies in the general population, ours has some limitations. First, we excluded 11% of the sample when eliminating participants without complete information. Second, we may have underestimated leptin values, especially in older individuals, by excluding the institutionalized population, which is often older and has higher leptin. Moreover, as in other population surveys, we cannot rule out some selection bias, because the main reason for not participating in the study was the requirement to give blood. The overall survey response rate is among the highest in similar surveys carried out in Europe.48 Finally, we cannot rule out some selection bias due to the use of telephone surveys, although it is estimated that about 80% of the Spanish population have a landline.49
CONCLUSIONSThis study reports reference values for leptin in the general adult population in Spain. We observed much higher leptin in women than in men, and associations with various biological and lifestyle variables could help explain the variable behavior of obesity as a mediator of cardiovascular disease. Furthermore, the reasonable ability of leptin to predict cardiometabolic abnormality and metabolic syndrome in both sexes may be of interest for clinical practice as an indicator of overall cardiovascular risk.
FUNDINGData for this analysis came from the ENRICA study, funded by Sanofi-Aventis.
This work was funded by grant FIS P113/02321 (Instituto de Salud Carlos III, Spain) and the Chair in Epidemiology and Control of Cardiovascular Risk, Universidad Autónoma de Madrid, Spain.
This study is led by an independent scientific committee.
CONFLICTS OF INTERESTM.T. Aguilera is employed by Sanofi-Aventis; however, this company does not sell any products related to leptin and obesity.