Diabetes mellitus is associated with an enhanced risk for cardiovascular disease and its prevalence is increasing. Diabetes induces metabolic stress on blood and vascular cells, promoting platelet activation and vascular dysfunction. The level of vascular cell activation can be measured by the number and phenotype of microparticles found in the circulation. The aim of this study was to investigate the effect of a platelet-inhibitory dose of aspirin on the number and type of microparticles shed to the circulation.
MethodsForty-three diabetic patients were enrolled in the study and received a daily dose of 100mg of aspirin for 10 days to cover the average platelet life-span in the circulation. Before and after the intervention period, circulating microparticles were characterized and quantified by flow cytometry.
ResultsType 1 diabetic patients had about twice the number of tissue factor-positive circulating microparticles (derived both from platelets and monocytes) and endothelial-derived E-selectin positive microparticles than type 2 diabetic patients. Aspirin therapy significantly inhibited platelets since cyclooxygenase 1 derived thromboxane generation levels were reduced by 99%. Microparticles derived from erythrocytes, activated monocytes, and smooth muscle cells were significantly reduced after 10 days of aspirin administration.
ConclusionsThese results indicate that: a) vascular and blood cells in type 1 diabetic patients are exposed to more sustained stress shown by their specific microparticle origin and levels; b) aspirin therapy inhibits vascular wall cell activation and microparticle shedding, and c) the effects of aspirin are similar in type 1 and 2 diabetes.
Keywords
Diabetes mellitus (DM) is largely associated with microvascular and macrovascular complications and an enhanced risk of cardiovascular disease (CVD).1 Because of the increasing prevalence of DM worldwide, it has been estimated that approximately 552 million people will have DM in 2030, of whom more than 95% will have type 2 DM (DM2).2 A number of mechanisms for the increased cardiovascular (CV) risk in DM have been proposed, including an increased tendency toward intracoronary thrombus formation, increased platelet reactivity, and worsened endothelial dysfunction.3 Because up to 80% of individuals with DM will die of CV causes, evidence-based therapies to reduce CVD are of the utmost importance.
The recommendation of low-dose aspirin for the primary prevention of CV events in adults with DM has been the subject of controversy.2,3 Aspirin is a nonsteroidal anti-inflammatory drug and is the most commonly used antiplatelet agent due to its low cost and relative lack of adverse effects when administered in low doses. Aspirin inhibits platelet thromboxane A2 formation, a potent vasoconstrictor and platelet agonist, through the acetylation of cyclooxygenase 1 in the serine-530 position, thus preventing the arachidonic acid binding to the enzymatic active site.4,5 Beyond the inhibitory effect on thromboxane formation, aspirin may have pleiotropic effects, involving antioxidant and anti-inflammatory effects,6 but the effects of aspirin on preventing cell activation from the vascular compartment and microparticle shedding still remain unclear.
Circulating microparticles (cMPs) are small phospholipid microvesicles of 0.1 to 1μm diameter, shed by activated endothelial or blood cells and defined by both size and expression of cell-specific antigens on their surface.7 Recent studies have shown that these cMPs play a key role in thrombosis, inflammation and angiogenesis,8,9 which are essential in the development of diabetic complications. Although present in the plasma of healthy individuals, elevated numbers of specific activated subsets of cMPs have been reported in vascular disorders.10–13 Circulating microparticles originate from cells and contain phosphatidylserine and distinct surface proteins depending on their cells of origin or parental cells. Circulating microparticles can originate from platelets, endothelial cells, leukocytes, erythrocytes, and smooth muscle cells.14 Some have strong procoagulant properties due to exposure of anionic phospholipids, such as phosphatidylserine, in a similar fashion as activated platelets, and provide a catalytic surface that may promote coagulation since phosphatidylserine facilitates the binding of the coagulation factors and the assembly of the coagulation complexes, accelerating the formation of thrombin.15 As reviewed,16 patients with DM and diabetic complications have different cellular cMPs patterns, and blood levels of platelet-derived cMPs, endothelial-derived cMPs, and total annexin V (AV)+ microparticles are significantly increased in type 1 DM (DM1). In DM2 patients, higher levels of total,17 platelet, leukocyte, monocyte, and endothelial-derived cMPs have been observed compared with those of matched controls.18–21
Thus, the aim of this study was to determine the effect of aspirin administration on microparticle shedding and phenotype in diabetic patients.
METHODSDiabetic PatientsA total of 43 primary care diabetic patients (men and women) aged between 41 and 73 years and treated according to international guidelines were recruited for the study in the outpatient clinic of the Hospital de la Santa Creu i Sant Pau in Barcelona, Spain. The patients included in the study had DM1 or DM2, and exclusion criteria were as follows: aspirin or ibuprofen ingestion within the last 10 days, contraindications to aspirin or beta-blocking agents, peptic ulcer and increased bleeding risk as well as a past history of cancer, inflammatory disorders, sepsis, infection, or pregnancy.
The study protocol was approved by the institutional review board of the hospital, and the trial was conducted according to the Declaration of Helsinki. All participants gave written consent before participation in the study. After screening and inclusion in the study, a medical record was administered to obtain lifestyle, medical and therapeutic data, and baseline measurements were performed. After that, patients were entered at the intervention period, when they were administered 100mg aspirin daily for 10 days. Blood samples were taken before (baseline) and after the intervention period with aspirin.
To ensure adherence to aspirin therapy and its efficacy, cyclooxygenase-1 inhibition was proven by measuring the inhibition of thromboxane B2 formation with a commercial enzyme immunoassay kit (Thromboxane B2 Express Eia Kit-Monoclonal, Cayman Chemical) following manufacturer's recommendations.
Control ParticipantsAs control participants, we included 38 moderate-high CV risk participants free of DM and CVD matched for sex, age, classical CV risk factors, and statin use. Controls were recruited from the SAFEHEART cohort,22 an open, multicenter, long-term prospective study. None of the control participants were undergoing aspirin therapy. Data on demographic and clinical characteristics, CV history, classic CV risk factors, and current treatment for hypercholesterolemia were obtained from all participants using a standardized report form at inclusion. The study was approved by the local ethics committee and was conducted according to the Declaration of Helsinki. Written informed consent was obtained from all participants prior to the study.
Blood SamplingVenous blood was drawn from the cubital vein without tourniquet using a 20-gauge needle after 10-14hours of fasting into 3.8% sodium citrate tubes. Blood cells were removed by low-speed centrifugation (250×g, 15minutes) at room temperature to avoid in vitro platelet activation. Platelet rich plasma was carefully aspirated, leaving an undisturbed layer of about 0.1cm on top of the cells. A second centrifugation step (11 000×g, 10min, room temperature) was made to ensure the complete removal of cells and platelets to obtain platelet poor plasma. A third centrifugation step (11 000×g, 2minutes, room temperature) was performed to ensure the complete removal of platelets and to obtain platelet free plasma. All samples were processed identically and within 60minutes after extraction. Platelet free plasma aliquots of 250μL were immediately frozen in liquid nitrogen and stored at −80°C until processing for isolation and quantification of cMPs.
Circulating Microparticle Isolation and QuantificationThe cMPs fraction was isolated from platelet free plasma by a 2-step high-speed centrifugation. Briefly, 250μL of frozen platelet free plasma aliquots were thawed on melting ice for 1 hour and centrifuged at 20 000×g for 30min at 30°C to pellet cMPs. The supernatants were discarded and the cMP enriched pellet was washed once with citrate-phosphate buffered saline solution (citrate-phosphate buffered saline; 1.4 mmol/L phosphate, 154 mmol/L NaCl, 10.9mM trisodium citrate, pH 7.4) before a second equal centrifugation step was made. Finally, the remaining cMP pellets were resuspended in 100μL citrate-phosphate buffered saline.
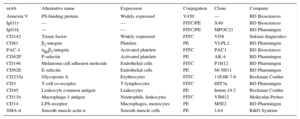
Triple-label flow cytometric analysis was performed as described by Suades et al.23 Briefly, 5μL of washed cMP suspensions were diluted in 30μL phosphate buffered saline buffer containing 2.5mM CaCl2 (Annexin Binding Buffer). Thereafter, combinations of 5μL of V450-conjgated AV (BD-horizon) with 2 specific monoclonal antibodies (mAb) (5μL each) (Table 1) labeled with fluorescein isothiocyanate or phycoerythrin, or the isotype-matched control antibodies were added. Samples were incubated 20minutes at room temperature in the dark and diluted with annexin binding buffer before being immediately analyzed on a FACSCantoII™ flow cytometer (except for microparticles from smooth muscle cells). Smooth muscle cell-derived microparticles were quantified as previously described.14 Summarizing, 5μL of the cMPs suspension were incubated for 20minutes at room temperature in the dark with 5μL AV-V450 and 5μL CD142-(tissue factor [TF])-fluorescein isothiocyanate in a final volume of 50μL annexin binding buffer. Circulating microparticles were fixed with 450μL annexin binding buffer/paraformaldehyde 2% for 30minutes and were centrifuged at 20 000×g for 30minutes to pellet cMPs. After elimination of the supernatant, cMPs were permeabilized with 20μL of annexin binding buffer/saponin 0.1% for 20minutes at room temperature in the dark. After permeabilizing, 5μL of smooth muscle actin-α-phycoerythrin were added to the cMPs suspension and incubated for 20minutes at room temperature in the dark and finally diluted with annexin binding buffer prior to flow cytometer analyses.
Cell Surface Molecules for Circulating Microparticles Identification and Characterization
| mAb | Alternative name | Expression | Conjugation | Clone | Company |
|---|---|---|---|---|---|
| Annexin V | PS-binding protein | Widely expressed | V450 | — | BD Biosciences |
| IgG1γ | — | — | FITC/PE | X40 | BD Biosciences |
| IgG1k | — | — | FITC/PE | MPOC21 | BD Pharmingen |
| CD142 | Tissue factor | Widely expressed | FITC | VD8 | Sekisui diagnostics |
| CD61 | β3-integrin | Platelets | PE | VI-PL2 | BD Pharmingen |
| PAC-1 | αIIbβ3-integrin | Activated platelets | FITC | PAC1 | BD Biosciences |
| CD62P | P-selectin | Activated platelets | PE | AK-4 | BD Pharmingen |
| CD146 | Melanoma cell adhesion molecule | Endothelial cells | FITC | P1H12 | BD Pharmingen |
| CD62E | E-selectin | Endothelial cells | PE | 68-5H11 | BD Pharmingen |
| CD235a | Glycoporin A | Erythrocytes | FITC | 11E4B-7-6 | Beckman Coulter |
| CD3 | T-cell co-receptor | T-lymphocytes | FITC | HIT3a | BD Pharmingen |
| CD45 | Leukocyte common antigen | Leukocytes | PE | Immu-19.2 | Beckman Coulter |
| CD11b | Macrophage-1 antigen | Neutrophils, leukocytes | FITC | VIM12 | Molecular Probes |
| CD14 | LPS-receptor | Macrophages, monocytes | PE | M5E2 | BD Pharmingen |
| SMA-α | Smooth muscle actin α | Smooth muscle cells | PE | 1A4 | R&D Systems |
FITC, fluorescein isothiocyanate; LPS, lipopolysaccharide; mAb, monoclonal antibody; PE, phycoerythrin; PS, phosphatidylserine; SMA, smooth muscle actin.
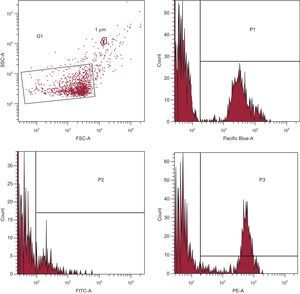
Acquisition was performed at 1minute per sample. Forward scatter, side scatter and fluorescence data were obtained with the settings in the logarithmic scale. Circulating microparticles were identified and quantified based on their forward scatter/side scatter characteristics according to their size, binding to AV, and reactivity to cell-specific mAb (Figure 1).
. G1 was set according to circulating microparticle size and granularity (defined as < 1μm). Annexin V+ circulating microparticles quantified in the Pacific Blue channel were selected (P1) from G1. Circulating microparticles binding fluorescein isothiocyanate+ (P2) and/or phycoerythrin+ (P3) labeled antibodies (see Table 1) were selected from P1 and quantified. FITC, fluorescein isothiocyanate; FSC, forward scatter; PE, phycoerythrin; SSC, side scatter.")
Gating and acquisition strategy for the detection of circulating microparticles in the FACS analysis. Gate limits were established before analyses using a Flow Check YG Size Range Calibration Kit (Polysciences; Warrington, Pennsylvania, United States). G1 was set according to circulating microparticle size and granularity (defined as < 1μm). Annexin V+ circulating microparticles quantified in the Pacific Blue channel were selected (P1) from G1. Circulating microparticles binding fluorescein isothiocyanate+ (P2) and/or phycoerythrin+ (P3) labeled antibodies (see Table 1) were selected from P1 and quantified. FITC, fluorescein isothiocyanate; FSC, forward scatter; PE, phycoerythrin; SSC, side scatter.
The contribution of granulocytes was inferred by subtracting agranulocytes (lymphocytes plus monocytes) from total leukocytes instead of labeling with specific mAb. Gate limits were established following the criteria previously described.23 The lower detection limit was placed as a threshold above the electronic background noise of the flow cytometer. To identify positive stained events, thresholds were also set based on samples incubated with the same final concentration of isotype-matched control antibodies after titration experiments. The AV binding level was corrected for autofluorescence using fluorescence signals obtained with microparticles in calcium-free phosphate buffered saline.
Data were analyzed with the FACSDiva software (version 6.1.3, Becton Dickinson). The cMP concentration (number of cMPs per μL of platelet free plasma) was determined according to Nieuwland's formula,15 based on the sample volume, flow cytometer flow rate, and the number of fluorescence-positive events (N), as follows: cMPs/μL = N x (Vf/Va) x (Vt/FR) x (1/Vi); where Vf(μL) is the final volume of washed cMP suspension, Va(μL) = volume of washed cMP suspension used for each labeling analysis, Vt(μL) = total volume of cMP suspension before fluorescence-activated cell sorting analysis, FR(μL/min) = flow rate of the cytometer at low mode (the average volume of microparticle suspension analyzed in 1minute), 1 is the μL unit of volume, and Vi(μL) = original volume of plasma used for microparticle isolation. Flow rate was measured before each experiment. To reduce background noise, buffers were prepared on the same day and filtered through 0.2μm pore size filters under vacuum.
Statistical AnalysisStatistical analyses were performed using the SPSS Statistical Analysis System (version 22.0). Descriptive statistics—mean ± standard deviation or no. (%)—were used to describe the baseline characteristics of the patients and the outcome variables. To analyze the changes after the aspirin therapy, a 2-tailed Student's t test for paired samples was performed with the data obtained before and after the intervention. One-way analysis of variance was used to compare the differences of changes in outcome variables according to the type of DM. Changes in cMPs after aspirin therapy were considered the primary outcome. P values were considered significant when<.05.
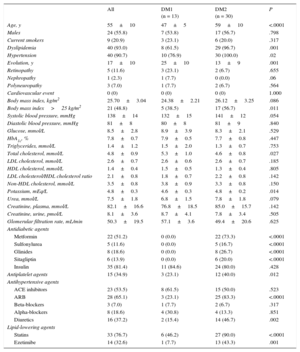
RESULTSBaseline CharacteristicsThe baseline characteristics of the 43 diabetic patients included in the study (13 with DM1 and 30 with DM2, with an average disease duration of 17 years) are shown in Table 2, and the baseline characteristics of control participants can be found in . The mean age of the diabetic population was 55 years, ∼56% were men, ∼21% were current smokers, ∼93% had dyslipidemia, and ∼91% were hypertensive. A ∼53% of the patients were receiving angiotensin-converting enzyme inhibitors, ∼65% angiotensin receptor blockers, ∼7% beta-blockers, ∼19% doxazosin, ∼37% diuretics, ∼77% statins, and ∼33% were receiving ezetimibe.
Baseline Characteristics of the 43 Diabetic Patients Studied
| All | DM1 (n = 13) | DM2 (n = 30) | P | |
|---|---|---|---|---|
| Age, y | 55±10 | 47±5 | 59±10 | <.0001 |
| Males | 24 (55.8) | 7 (53.8) | 17 (56.7) | .798 |
| Current smokers | 9 (20.9) | 3 (23.1) | 6 (20.0) | .317 |
| Dyslipidemia | 40 (93.0) | 8 (61.5) | 29 (96.7) | .001 |
| Hypertension | 40 (90.7) | 10 (76.9) | 30 (100.0) | .02 |
| Evolution, y | 17±10 | 25±10 | 13±9 | .001 |
| Retinopathy | 5 (11.6) | 3 (23.1) | 2 (6.7) | .655 |
| Nephropathy | 1 (2.3) | 1 (7.7) | 0 (0.0) | .06 |
| Polyneuropathy | 3 (7.0) | 1 (7.7) | 2 (6.7) | .564 |
| Cardiovascular event | 0 (0) | 0 (0) | 0 (0) | 1.000 |
| Body mass index, kg/m2 | 25.70±3.04 | 24.38±2.21 | 26.12±3.25 | .086 |
| Body mass index>25 kg/m2 | 21 (48.8) | 5 (38.5) | 17 (56.7) | .011 |
| Systolic blood pressure, mmHg | 138±14 | 132±15 | 141±12 | .054 |
| Diastolic blood pressure, mmHg | 81±8 | 80±8 | 81±9 | .840 |
| Glucose, mmol/L | 8.5±2.8 | 8.9±3.9 | 8.3±2.1 | .529 |
| HbA1c, % | 7.8±0.7 | 7.9±0.5 | 7.7±0.8 | .447 |
| Triglycerides, mmol/L | 1.4±1.2 | 1.5±2.0 | 1.3±0.7 | .753 |
| Total cholesterol, mmol/L | 4.8±0.9 | 5.3±1.0 | 4.6±0.8 | .027 |
| LDL cholesterol, mmol/L | 2.6±0.7 | 2.6±0.6 | 2.6±0.7 | .185 |
| HDL cholesterol, mmol/L | 1.4±0.4 | 1.5±0.5 | 1.3±0.4 | .805 |
| LDL cholesterol/HDL cholesterol ratio | 2.1±0.8 | 1.8±0.7 | 2.2±0.8 | .142 |
| Non-HDL cholesterol, mmol/L | 3.5±0.8 | 3.8±0.9 | 3.3±0.8 | .150 |
| Potassium, mEq/L | 4.8±0.3 | 4.6±0.3 | 4.8±0.2 | .014 |
| Urea, mmol/L | 7.5±1.8 | 6.8±1.5 | 7.8±1.8 | .079 |
| Creatinine, plasma, mmol/L | 82.1±16.6 | 76.8±18.5 | 85.0±15.7 | .142 |
| Creatinine, urine, pmol/L | 8.1±3.6 | 8.7±4.1 | 7.8±3.4 | .505 |
| Glomerular filtration rate, mL/min | 50.3±19.5 | 57.1±3.6 | 49.4±20.6 | .625 |
| Antidiabetic agents | ||||
| Metformin | 22 (51.2) | 0 (0.0) | 22 (73.3) | <.0001 |
| Sulfonylurea | 5 (11.6) | 0 (0.0) | 5 (16.7) | <.0001 |
| Glinides | 8 (18.6) | 0 (0.0) | 8 (26.7) | <.0001 |
| Sitagliptin | 6 (13.9) | 0 (0.0) | 6 (20.0) | <.0001 |
| Insulin | 35 (81.4) | 11 (84.6) | 24 (80.0) | .428 |
| Antiplatelet agents | 15 (34.9) | 3 (23.1) | 12 (40.0) | .012 |
| Antihypertensive agents | ||||
| ACE inhibitors | 23 (53.5) | 8 (61.5) | 15 (50.0) | .523 |
| ARB | 28 (65.1) | 3 (23.1) | 25 (83.3) | <.0001 |
| Beta-blockers | 3 (7.0) | 1 (7.7) | 2 (6.7) | .317 |
| Alpha-blockers | 8 (18.6) | 4 (30.8) | 4 (13.3) | .851 |
| Diuretics | 16 (37.2) | 2 (15.4) | 14 (46.7) | .002 |
| Lipid-lowering agents | ||||
| Statins | 33 (76.7) | 6 (46.2) | 27 (90.0) | <.0001 |
| Ezetimibe | 14 (32.6) | 1 (7.7) | 13 (43.3) | .001 |
ACE, angiotensin-converting enzyme; ARB, angiotensin receptor blockers; DM1, type 1 diabetes mellitus; DM2, type 2 diabetes mellitus; HbA1c, glycated hemoglobin; LDL, low-density lipoprotein; HDL, high-density lipoprotein.
Data are expressed as no. (%) or mean±standard deviation. P value from 1-way analysis of variance for quantitative variables and from chi-square analysis for qualitative variables.
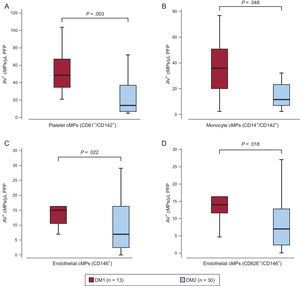
Patients with DM1 showed a mean of 25±10 years of disease evolution while DM2, showed a mean of 13±9 years of diabetes evolution (P = .001, 1-way analysis of variance). At baseline, DM1 patients had about twice TF+ cMPs from platelet and monocyte origin and endothelial-derived CD62E+/− cMPs than DM2 participants (Figure 2), possibly reflecting life-long exposure to metabolic stress. In fact, baseline levels of these cMPs correlated positively with the time of disease progression (Spearman's rho = 0.371, 0.402, 0.330 and 0.335, P = .014, .008, .029 and .025, for platelet- and monocyte-derived TF+ and endothelial-derived CD62E+/− cMPs, respectively).
 tissue factor positive (CD142+) circulating microparticles from platelet (CD61+) and B) monocyte origin (CD14+) and C) endothelial-derived (CD146+) circulating microparticles and D) activated endothelial cells (CD146+/CD62E+) circulating microparticles before the aspirin intervention according to the type of diabetes. AV, annexin V; cMPs, circulating microparticles; DM1, type 1 diabetes mellitus; DM2, type 2 diabetes mellitus; PFP, platelet free plasma. Lines within boxes represent median values, the upper and lower boxes lines represent the 25th and 75th percentiles, respectively, and the upper and lower bars outside the boxes represent the 10th and 90th percentiles, respectively. P value from the 1-way analysis of variance of the number of circulating microparticles depending on the type of diabetes.")
Differences in baseline annexin V+ circulating microparticles according to the type of diabetes. Box and whisker plots showing number of A) tissue factor positive (CD142+) circulating microparticles from platelet (CD61+) and B) monocyte origin (CD14+) and C) endothelial-derived (CD146+) circulating microparticles and D) activated endothelial cells (CD146+/CD62E+) circulating microparticles before the aspirin intervention according to the type of diabetes. AV, annexin V; cMPs, circulating microparticles; DM1, type 1 diabetes mellitus; DM2, type 2 diabetes mellitus; PFP, platelet free plasma. Lines within boxes represent median values, the upper and lower boxes lines represent the 25th and 75th percentiles, respectively, and the upper and lower bars outside the boxes represent the 10th and 90th percentiles, respectively. P value from the 1-way analysis of variance of the number of circulating microparticles depending on the type of diabetes.
Compared with controls, patients before the aspirin intervention had higher levels of all cMPs quantified except for erythrocyte-derived (CD235ab+), CD11b+/AV+, and overall TF (CD142+)-loaded cMPs, which were similar to control values ().
Inhibition of Platelet ActivationThromboxane B2 levels in serum (obtained in the same blood extraction than citrate tubes) were measured before and 10 days after the 100mg aspirin intervention as a measure of efficacy of aspirin. After aspirin therapy, cyclooxygenase 1 inhibition was above 99%, as the thromboxane B2 concentration at baseline was about 18.8+2.8 ng/mL and 0.26+0.19 ng/mL after the intervention, indicating the absence of aspirin pseudo-resistance and that compliance was excellent.
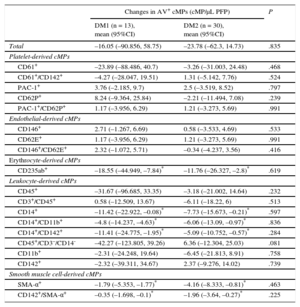
Aspirin-induced Changes in Circulating MicroparticlesThe overall effects of aspirin were similar in both types of DM (Table 3). Therefore, the changes in microparticle shedding after aspirin intervention were expressed considering together both types of DM.
Changes in Circulating Microparticles After the Aspirin Intervention According to the Type of Diabetes
| Changes in AV+ cMPs (cMP/μL PFP) | P | ||
|---|---|---|---|
| DM1 (n = 13), mean (95%CI) | DM2 (n = 30), mean (95%CI) | ||
| Total | –16.05 (–90.856, 58.75) | –23.78 (–62.3, 14.73) | .835 |
| Platelet-derived cMPs | |||
| CD61+ | –23.89 (–88.486, 40.7) | –3.26 (–31.003, 24.48) | .468 |
| CD61+/CD142+ | –4.27 (–28.047, 19.51) | 1.31 (–5.142, 7.76) | .524 |
| PAC-1+ | 3.76 (–2.185, 9.7) | 2.5 (–3.519, 8.52) | .797 |
| CD62P+ | 8.24 (–9.364, 25.84) | –2.21 (–11.494, 7.08) | .239 |
| PAC-1+/CD62P+ | 1.17 (–3.956, 6.29) | 1.21 (–3.273, 5.69) | .991 |
| Endothelial-derived cMPs | |||
| CD146+ | 2.71 (–1.267, 6.69) | 0.58 (–3.533, 4.69) | .533 |
| CD62E+ | 1.17 (–3.956, 6.29) | 1.21 (–3.273, 5.69) | .991 |
| CD146+/CD62E+ | 2.32 (–1.072, 5.71) | –0.34 (–4.237, 3.56) | .416 |
| Erythrocyte-derived cMPs | |||
| CD235ab+ | –18.55 (–44.949, –7.84)* | –11.76 (–26.327, –2.8)* | .619 |
| Leukocyte-derived cMPs | |||
| CD45+ | –31.67 (–96.685, 33.35) | –3.18 (–21.002, 14.64) | .232 |
| CD3+/CD45+ | 0.58 (–12.509, 13.67) | –6.11 (–18.22, 6) | .513 |
| CD14+ | –11.42 (–22.922, –0.08)* | –7.73 (–15.673, –0.21)* | .597 |
| CD14+/CD11b+ | –4.8 (–14.237, –4.63)* | –6.06 (–13.09, –0.97)* | .836 |
| CD14+/CD142+ | –11.41 (–24.775, –1.95)* | –5.09 (–10.752, –0.57)* | .284 |
| CD45+/CD3–/CD14- | –42.27 (–123.805, 39.26) | 6.36 (–12.304, 25.03) | .081 |
| CD11b+ | –2.31 (–24.248, 19.64) | –6.45 (–21.813, 8.91) | .758 |
| CD142+ | –2.32 (–39.311, 34.67) | 2.37 (–9.276, 14.02) | .739 |
| Smooth muscle cell-derived cMPs | |||
| SMA-α+ | –1.79 (–5.353, –1.77)* | –4.16 (–8.333, –0.81)* | .463 |
| CD142+/SMA-α+ | –0.35 (–1.698, –0.1)* | –1.96 (–3.64, –0.27)* | .225 |
95%CI, 95% confidence interval; AV, annexin V; CMPs, circulating microparticles; DM1, type 1 diabetes mellitus; DM2, type 2 diabetes mellitus; PFP, platelet free plasma; SMA, smooth muscle actin.
Used markers were CD61 for platelets, CD146 for endothelial cells, CD235ab for erythrocytes, CD45 for total leukocytes, and CD3 for lymphocytes and CD14 for monocytes origins accounting for agranulocytes. Granulocytes were inferred by subtracting the agranulocyte subpopulation from the leukocytes fraction and smooth muscle actin-α was used for smooth muscle cells. The other CDs were used as biomarkers of cell activation (see Table 1).
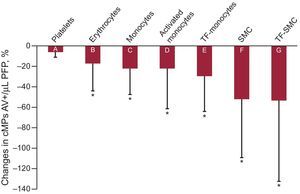
As depicted in Figure 3, after 10 days of aspirin, cMPs from erythrocyte origin (CD235a+/AV+) decreased by ∼17%. Monocyte-derived cMPs decreased by ∼22% (CD14+/AV+) and cMPs from activated monocytes also decreased (∼22 and 29% for CD11b+/CD14+/AV+ and CD142+/CD14+/AV+ cMPs, respectively). Furthermore, smooth muscle cell-derived cMPs decreased by ∼52% (smooth muscle actin-α+/AV+) and TF-expressing smooth muscle cell-derived cMPs (CD142+/smooth muscle actin-α+/AV+) also decreased by ∼54%.
 and CD11b (αM-integrin) were used as biomarkers of cell activation. AV, annexin V; cMPs, circulating microparticles; SMC, smooth muscle cell; TF, tissue factor. *P<.05, comparing before and after the intervention (Student t test for paired samples).")
Differences expressed in percentage of decrease in annexin V+ circulating microparticles between before and after the aspirin intervention. A: CD61+; B: CD235a+; C: CD14+; D: CD14+/CD11b+; E: CD14+/CD142+; F: smooth muscle actin-α+ and G: smooth muscle actin-α+/CD142+. CD61 was used as a biomarker of platelets, CD235a for erythrocytes, CD14 for monocytes and smooth muscle actin-α for smooth muscle cell origins. CD142 (tissue factor) and CD11b (αM-integrin) were used as biomarkers of cell activation. AV, annexin V; cMPs, circulating microparticles; SMC, smooth muscle cell; TF, tissue factor. *P<.05, comparing before and after the intervention (Student t test for paired samples).
Moreover, levels of CD11b+/CD14+/AV+, smooth muscle actin-α+/AV+ and CD142+/ smooth muscle actin-α+/AV+ after the aspirin intervention achieved similar concentrations of those of nondiabetic high-CV risk controls.
Plasma concentrations of total cMPs (AV+) and cMPs originated from platelets (CD61+/AV+), endothelial cells (CD146+/AV+), lymphocytes (CD3+/AV+) and granulocytes (CD45+/CD3-/CD14-/AV+) were not affected by the aspirin therapy. The aspirin intervention did not influence cMPs from activated platelets, endothelial cells, lymphocytes, or granulocytes.
DISCUSSIONCirculating microparticles are able to bind to circulating cells or endothelium and participate in intercellular communication through a broad spectrum of transmission of inflammatory information and cell activation, cell survival and apoptosis, endothelial function, vascular remodeling and angiogenesis, thus accelerating CVD progression. Therefore, strategies to decrease cMPs may delay CV complications.
Aspirin is given for the primary and secondary prevention of CVD in diabetic patients. While secondary prevention through low doses of aspirin seems demonstrated,24,25 the balance benefit/risk of aspirin administration for the primary prevention of CVD in these patients is still controversial,4–6,26–28 taking into account its collateral effects, especially upper gastrointestinal bleeding.
The main findings of this study are that 100mg/day of aspirin therapy decreases microparticle shedding and activation of erythrocyte, monocyte and smooth muscle cell origin in diabetic patients without a previous vascular event. To our knowledge, this is the first time that microparticle shedding from several cells of the vascular compartment after aspirin therapy has been investigated in diabetic patients.
Aspirin did not reduce the circulating platelet microparticles number or activated platelet shedding in diabetic individuals, in agreement with previously reported data showing that aspirin intake has no effect on platelet-derived cMPs in DM2.29 This lack of effect on platelet microparticle shedding has also been observed in healthy volunteers,30 in which 100mg aspirin was administered for 7 days and no differences in the number of platelet-derived cMPs were detected. There were no differences either in endothelial-derived cMPs or in TF+ cMPs or AV+ cMPs between aspirin- or placebo-treated healthy volunteers. This finding has also been shown in a case-control study in diabetic patients,17 in which diabetics administered aspirin therapy showed no significant differences in the number of platelet-derived cMPs compared with patients who were not undergoing this treatment. A study of stable coronary disease also showed that aspirin did not modify platelet-derived cMP levels in these patients.31
Here, we observed that TF+ cMPs of monocyte and smooth muscle cell origin decreased after aspirin therapy. Cell-derived microparticles promote thrombus formation in vivo in a TF-dependent manner,9,32 and high levels of TF+ cMPs in diabetic patients are reported to be involved in transcellular signaling or angiogenic processes other than the classical procoagulant function of TF+ microparticles shown previously.12 Moreover, TF+ monocyte-derived microparticles constitute the second largest pool of thrombogenic microparticles after microparticles originating from platelets.33 Additionally, we observed a decreased activated monocyte-derived (CD11b+/CD14+/AV+) microparticle shedding after the 10 days of aspirin therapy. Interestingly, high concentrations of cMPs derived from activated monocytes were detected in DM2 patients compared with control participants.21 A relationship between CD11b+ cMPs and the degree of CV risk and atherosclerotic plaque burden has previously been observed in participants with different grades of CVD burden.34
Additionally, we observed that at entry DM1 patients had about twice the TF+ cMPs of platelet and monocyte origin and endothelial-derived CD62E+/− cMPs than DM2 participants, attributable to lifelong exposure to metabolic stress in DM1 patients. These results are in accordance with those of Sabatier et al,17 who found that DM1 patients had significantly higher numbers of platelet and endothelial microparticles and demonstrated that DM1 and DM2 patients depicted distinct microparticle profile. Nevertheless, 90% of DM2 patients were under statin therapy, which may potentially contribute to the lower microparticle levels observed.
LimitationsThis study is not free of limitations. Diabetic patients are usually polymedicated, as shown in Table 1. Concomitant medication may affect microparticle shedding, but this issue is partially solved by the study design, as we quantified cMPs before and after the 10-day intervention for each patient, in which concomitant medication was not modified. It was not possible to obtain data on the effects of aspirin in our study controls (patients at high CV risk but without DM and CVD), because the 10-day aspirin intervention was not justified according to the ethics committee of our institution. Current guidelines do not specify a CV risk threshold after which aspirin should be used systematically in diabetic patients for primary CVD prevention. Although the investigated population corresponded to real life diabetic patients treated as per guidelines without clinical evidence of atherosclerotic disease attending a metabolism clinic, it may not be representative for the total diabetic population at high CVD risk.
CONCLUSIONSA 10-day intervention with aspirin in primary prevention of diabetic patients (treated as per guidelines) does not affect platelet microparticle shedding. Interestingly, cells that show a reduction of microparticle shedding, and hence passivation of activation, are smooth muscle cells and immune cells. These cell types showed a significantly reduced shedding of membrane vesicles carrying epitopes of cell activation.
In summary, our results indicate that: a) DM1 and DM2 patients have a different profile of microparticle shedding, reflecting more sustained stress in DM1 patients; b) aspirin therapy inhibits vascular wall cell activation and microparticle shedding, and, c) the effects of aspirin are similar in DM1 and DM2.
FundingG. Chiva-Blanch is a Sara Borrell postdoctoral fellow (CD13/00023) from Instituto de Salud Carlos III. This work has been possible due to funding received from the Spanish Ministry of Economy and Competitiveness (Plan Estatal de I+D+i 2013-2016, SAF2013-42962-R, to L. Badimon) and from the Red de Investigación Cardiovascular of Instituto de Salud Carlos III (RIC, RD12/0042/0027 to L. Badimon), with cofunding from European Union Funds and the ERDF (European Regional Development Fund) “A way of making Europe”.
CONFLICTS OF INTERESTNone declared.
We are indebted to diabetic patients for their participation in the study.