
Cardiac amyloidosis (CA) refers to an infiltrative process involving amyloid fibril deposition in the myocardium causing restrictive cardiomyopathy. While various types can affect the heart, the predominant forms are immunoglobulin light-chain (AL) amyloidosis and transthyretin (ATTR) amyloidosis. This review article explores the expanding field of imaging techniques used to diagnose AL-CA and ATTR-CA, highlighting their usefulness in prognostication and disease surveillance. Echocardiography is often the initial imaging modality to suspect CA and, since the incorporation of nonbiopsy criteria using bone scintigraphy, diagnosing ATTR-CA has become more attainable following exclusion of plasma cell dyscrasia. Cardiac magnetic resonance is progressively emerging as a vital tool for imaging CA, and is used in diagnosis, prognostication, and disease surveillance. The use of cardiac magnetic resonance in AL-CA is discussed, as it has been shown to accurately evaluate organ response to chemotherapy. As novel drug treatments emerge in the realm of ATTR-CA, the use of cardiovascular imaging surveillance to monitor disease progression is discussed, as it is gaining prominence as a critical consideration. The ongoing phase III trials investigating treatments for patients with ATTR-CA, will undoubtedly enhance our understanding of cardiac imaging surveillance.
Keywords
Cardiac amyloidosis (CA) involves an infiltrative process due to deposition of amyloid fibrils in the myocardium that ultimately causes restrictive cardiomyopathy. While several types of amyloidosis can affect the heart, 2 types predominate: immunoglobulin light-chain (AL) amyloidosis and transthyretin (ATTR) amyloidosis.1 Cardiac involvement is the leading cause of morbidity and mortality in systemic amyloidosis, regardless of the underlying pathogenesis of amyloid production.
AL-amyloidosis arises from a clonal plasma cell proliferative disorder in which misfolded immunoglobulin light chains are deposited as amyloid fibrils in multiple organs, including the heart, in up to 75% of cases.2,3 Cardiotoxicity in AL-CA results from amyloid fibril deposition in the myocardium, which has a direct toxic effect on myocytes.4,5 Due to the cardiotoxic effects of amyloid fibrils, prompt diagnosis and treatment initiation is key to improving prognosis. There is a 3- to 5-fold increased risk of death in patients with delays in the diagnosis of AL-CA.6 Treatment regimens use a combination of cytotoxic chemotherapeutic agents that target plasma cell clones and suppress the production of amyloidogenic immunoglobulin light chains. To date, advances in treatment have significantly improved patient outcomes, with successful chemotherapy followed by stem cell transplantation resulting in a median survival of more than 4 years.7
ATTR-amyloidosis is caused by misfolding of the liver-derived transthyretin protein. Transthyretin is a tetramer, which is a physiological transport protein for thyroxine and retinol. Disease occurs when this precursor protein misfolds into ATTR fibrils. ATTR-amyloidosis can either be wild-type (wt), occurring secondary to an acquired pathogenic process associated with aging, or hereditary, which occurs secondary to an inherited TTR gene mutation. ATTRwt amyloidosis occurs later in life, has a male predominance, and generally presents as restrictive cardiomyopathy8; in contrast, hereditary ATTR (ATTRv) amyloidosis presents at a younger age, often with a mixed phenotype involving polyneuropathy and cardiomyopathy.9 Initial treatment strategies revolve around stabilizing the transthyretin tetramer to prevent dissociation into amyloidogenic monomers and oligomers, followed by the development of gene silencers. At present, novel gene editing therapies are under investigation as they reduce transthyretin production, thereby suppressing the amyloid precursor protein.10,11
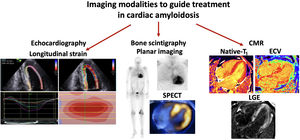
CA is a heterogenous and complex disease process. The clinical phenotype and treatment strategies vary significantly and depend on the underlying amyloid type. Advances in multimodality cardiac imaging have improved our understanding of how individuals respond to treatments, which has important implications for clinical care and prognosis. This review will therefore explore the role of cardiac imaging in diagnosing and monitoring changes over time in CA (figure 1).

Central illustration. Imaging modalities to monitor cardiac amyloidosis over time. Imaging modalities to guide treatment in cardiac amyloidosis include the use of echo, in particular global longitudinal strain with the typical “bull's eye pattern”on longitudinal strain polar maps. Positive bone scintigraphy in all patients with transthyretin cardiac amyloidosis and a proportion with light-chain cardiac amyloidosis. Typical cardiac magnetic resonance (CMR) findings consistent with cardiac amyloidosis include elevated native T1 values, elevated extracellular volume (ECV) and diffuse transmural late gadolinium enhancement (LGE) within the left ventricle+/- the right ventricle. SPECT, single-photon emission computed tomography.
Echocardiography is widely available and easily accessible and is often the first-line investigation in patients presenting with symptoms of heart failure. Typical features associated with CA include biventricular wall thickening, thickened valves, bi-atrial enlargement, diastolic dysfunction with eventual grade III or restrictive diastolic dysfunction, and elevated E:e’ reflective of increased left ventricular (LV) filling pressures. In the early stages of CA, the LV ejection fraction or radial function is generally preserved, but ultimately decreases with disease progression and increasing amyloid burden. Global longitudinal strain is (GLS) is commonly reduced (figure 1). Typically, longitudinal strain is disproportionately reduced in the basal segments in CA, causing a typical bull's eye pattern on longitudinal strain polar maps.12 Although apical sparing in longitudinal strain has 93% sensitivity and 82% specificity in diagnosing CA compared with LV hypertrophy, this pattern is not pathognomonic for the condition.13 This apical:basal strain gradient can therefore be useful in differentiating CA from other hypertrophic phenotypes, such as hypertensive cardiomyopathies or hypertrophic cardiomyopathy.14,15 Identification of these characteristic features can determine the presence of cardiac involvement in patients with known systemic AL-amyloidosis. However, due to the lack of tissue characterization by echocardiography, such identification lacks the sensitivity necessary to allow early diagnosis of cardiac infiltration.12
Current guidelines identify cardiac involvement in AL-amyloidosis as an interventricular septal thickness of>12mm on echo, due to no other identifiable cardiac cause, together with histological confirmation of AL-amyloidosis from any site.16 Although average GLS is not a guideline requirement for determining cardiac involvement in AL-amyloidosis, a reduced average is a sensitive prognostic marker,17 while a GLS>−10.2% at diagnosis has been associated with particularly poor survival.18
Prognosis of AL-CA at diagnosis is based on the Mayo classification, which stratifies patients into 3 prognostic categories (Mayo stage I-III) according to the cardiac biomarkers, N-terminal pro-B-type natriuretic peptide (NT-pro BNP) and troponin-T. A subsequent European modification of the Mayo staging in 2004 subdivided Mayo stage III into stage IIIa and IIIb, based on particularly high NT-pro BNP>8500 ng/L associated with a worse prognosis of 3 months.19 As cardiac biomarkers are affected by conditions such as renal impairment, use of echo-determined GLS has been suggested as an alternative method to risk stratify patients to the current modified Mayo classification.20,21 In a recent study, worsening GLS was correlated with increasing Mayo stage.21 The mean GLS associated with Mayo stage I at diagnosis was−21.1% compared with−12.1% in patients with Mayo stage IIIb (P<.0001). GLS quartiles correlating with survival were similarly determined, while the lowest 2 quartiles provided prognostic information beyond the Mayo classification (GLS−12.1 to−9.1%, 22-month and>−9%, 5-month survival) (table 1).
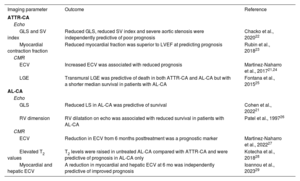
Summary of cardiovascular imaging modalities for determining prognosis in ATTR-CA and AL-CA
| Imaging parameter | Outcome | Reference |
|---|---|---|
| ATTR-CA | ||
| Echo | ||
| GLS and SV index | Reduced GLS, reduced SV index and severe aortic stenosis were independently predictive of poor prognosis | Chacko et al., 202022 |
| Myocardial contraction fraction | Reduced myocardial fraction was superior to LVEF at predicting prognosis | Rubin et al., 201823 |
| CMR | ||
| ECV | Increased ECV was associated with reduced prognosis | Martinez-Naharro et al., 201721,24 |
| LGE | Transmural LGE was predictive of death in both ATTR-CA and AL-CA but with a shorter median survival in patients with AL-CA | Fontana et al., 201525 |
| AL-CA | ||
| Echo | ||
| GLS | Reduced LS in AL-CA was predictive of survival | Cohen et al., 202221 |
| RV dimension | RV dilatation on echo was associated with reduced survival in patients with AL-CA | Patel et al., 199726 |
| CMR | ||
| ECV | Reduction in ECV from 6 months posttreatment was a prognostic marker | Martinez-Naharro et al., 202227 |
| Elevated T2 values | T2 levels were raised in untreated AL-CA compared with ATTR-CA and were predictive of prognosis in AL-CA only | Kotecha et al., 201828 |
| Myocardial and hepatic ECV | A reduction in myocardial and hepatic ECV at 6 mo was independently predictive of improved prognosis | Ioannou et al., 202329 |
AL-CA, immunoglobulin light-chain cardiac amyloidosis; ATTR-CA, transthyretin cardiac amyloidosis; CMR, cardiac magnetic resonance; ECV, extracellular volume; GLS, global longitudinal strain; LGE, late gadolinium enhancement; LS, longitudinal strain, LVEF, left ventricular ejection fraction; LS, longitudinal strain; RV, right ventricle, SV, stroke volume.
Cardiac magnetic resonance (CMR) is a highly sensitive tool in the diagnosis of CA. The expansion of the elevated extracellular volume (ECV) caused by accumulation of amyloid fibrils can be visualized following administration of gadolinium-based contrast agents. The resulting characteristic patterns of late gadolinium enhancement (LGE) are circumferential and diffuse and progress as the disease process becomes more advanced from subendocardial to transmural enhancement (figure 1). The ECV is quantified using pre- and postcontrast T1 mapping to generate an ECV map of the myocardium. Unlike ECV, T1 represents the combined intra- and extracellular space and is increased by water content, ie, therefore by edema. Although T1 and ECV are elevated in AL-CA and ATTR-CA and are predictive of prognosis, ECV is typically more accurate in representing the extracellular space, where amyloid fibrils accumulate.30
The elevated ECV associated with CA allows quantification of the amyloid burden in the myocardium.31 Using CMR as a tool to diagnose CA allows for improved insight in CA as a spectrum of increasing amyloid infiltration with associated edema and inflammation that cause various myocyte responses.32 As T1 decreases with myocardial hypertrophy, it is generally lower in ATTR-CA than in AL-CA.30 Similarly, native T1 values have emerged as a useful tool in differentiating CA from other hypertrophic phenotypes such as hypertrophic cardiomyopathy, although they are a less sensitive parameter than ECV, which is often the earliest finding.30,33 T2, a marker of myocardial edema, is also elevated in CA and is a predictor of mortality in AL-CA (table 1).28,30
Finally, an area under current investigation in CA is the use of longitudinal strain determined by CMR but its use as a diagnostic and surveillance tool is currently restricted by limited evidence.34
Bone scintigraphyATTR-CA is bone scintigraphy avid and, although the reason is unclear, it may be secondary to calcium distribution within ATTR amyloid fibrils.35 In patients with suspected ATTR-CA, therefore, once plasma cell dyscrasia has been ruled out, radionucleotide bone scintigraphy can be used to diagnose ATTR-CA with a high degree of certainty without histological proof.36 Three bone avid radiotracers are available to diagnose ATTR-CA by using bone scintigraphy. These include 99mTc-labeled pyrophosphate (PYP), most widely available in the US, while 99mTc-labeled 3,3-diphosphono-1,2-propanodicarboxylic acid (DPD) and 99mTc-labeled hydroxymethylene diphosphonate (HMDP) are used in Europe. Although all 3 facilitate the diagnosis of ATTR-CA, they each have different timing requirements from injection to imaging. To date, no direct comparison studies have been conducted that compare these radiotracers with each other.
Radionuclide bone scintigraphy scans to diagnose ATTR-CA are reported according to a derived scale (either the Perugini or Dorbala scale) ranging from 0 to 3, based on the level of radionucleotide uptake in the heart compared with the contralateral lung or whole body on planar images.37,38 In both systems, grades 0 to 1 indicates the absence of CA, while grades 2 to 3 (moderate to strong myocardial uptake) are diagnostic for its presence (figure 1). Once plasma cell dyscrasia has been ruled out, nonbiopsy criteria to diagnose ATTR-CA with radionucleotide bone scintigraphy has greater than 98% certainty.36
A proportion of patients with AL-CA may also have radionucleotide uptake in the heart on bone scintigraphy.35,39 In one study, a total of 40% of the patients with cardiac AL-amyloidosis had some radionucleotide uptake, of which 10% was Perugini grade 2 to 3 uptake.40 Bone scintigraphy cannot distinguish between subtypes of CA, highlighting the importance of ruling out plasma cell dyscrasia prior to completion. Equally, patients with suspected CA on CMR or echocardiography but no radionucleotide uptake, or only low uptake, in the heart on bone scintigraphy warrant urgent investigations as it likely represents AL-CA.41
Although not necessary to diagnose ATTR-CA, the addition of single-photon emission computed tomography (SPECT) images with scintigraphy improves interpretation of the DPD scan, particularly when early changes of CA are present, eg, Perugini grade 1.42 It also increases diagnostic specificity by distinguishing radiotracer blood pooling from true myocardial uptake, which is particularly useful in patients with renal impairment.43
Cardiac computed tomographyFactors such as the unavailability of CMR can hinder its use when monitoring treatment response in CA. Access can be further limited by restricted use of CMR according to local policies for certain patient cohorts, eg, advanced renal impairment and the challenges posed by cardiac devices when quantifying ECV. The potential to determine ECV using cardiac computed tomography (ECVCT) would therefore be a potential way of circumnavigating these issues, particularly as computed tomography scans may be more readily available in some centers. A recent article analyzed septal ECVCT in 72 patients with a diagnosis of CA secondary to AL (n=35) and ATTR (n=37).44 The mean ECVCT was found to be elevated at 42.7%±13.1% in the AL population and 55.8%±10.9% in patients with ATTR. During a mean follow-up of 5.3±2.4 years, increased cardiac amyloid burden as quantified by ECVCT was predictive of increased all-cause mortality in patients with ATTR but not in those with AL, after adjustment for age and septal wall thickness. Although the use of ECV determined by cardiac CT is at a preliminary stage, further studies are needed to investigate its use further, as it may become a useful modality for disease surveillance in the future.
MONITORING CHANGES OVER TIME IN CARDIAC AMYLOIDOSISATTR cardiac amyloidosisImaging changes detected in ATTR-CA in response to drug treatment have been determined by phase III randomized controlled trials (RCTs) investigating the efficacy of targeted therapies for both ATTR-CA and ATTR-familial amyloid polyneuropathy (FAP). The medication approved to treat ATTR-CA is currently limited to the TTR stabilizer tafamidis. Although alternative treatments are available, such as RNA interference-based therapy (eg, patisiran) and antisense oligonucleotide therapies (eg, inotersen), they are licensed for use in patients with neuropathy secondary to ATTRv (ie, ATTR-FAP).45,46 As many patients with ATTRv have concomitant ATTR-CA, some data describe medication effects on the heart through RCT subgroup analysis and retrospective studies.
Diflunisal is an nonsteroidal anti-inflammatory drug discovered to act as a TTR stabilizer binding to the thyroxine binding site of the TTR tetramer, stabilizing it from degrading to individual monomers.47 The drug was initially supported for use in patients with ATTR-FAP by a study in which patients receiving diflunisal had a reduced rate of polyneuropathy progression.48 A recent retrospective study detected improved survival in patients taking diflunisal with a diagnosis of ATTRwt-CA compared with those on no targeted treatment.49 Despite this difference in outcomes, however, the drug did not translate into changes in interventricular septal thickness and LV ejection fraction on echocardiography.
Although there are few data on echocardiographic changes in patients on targeted treatment for ATTR-CA, evidence suggests that surveillance of GLS and indexed stroke volume are the optimal echo parameters to monitor over time (table 2 and figure 2). In a recent RCT on ATTR-ACT, tafamidis was shown to reduce the risk of mortality and cardiovascular-related hospitalizations compared with placebo.50 This RCT included 441 participants, of whom 264 received tafamidis compared with 177 on placebo. Secondary analysis of echocardiographic changes in the ATTR-ACT trial showed a smaller rate of reduced stroke volume on echocardiography in patients receiving tafamidis compared with placebo after 30 months of treatment. Similarly, a retrospective study analyzing the effect of tafamidis on echo parameters showed a significant reduction in the progression of GLS in patients receiving tafamidis (n=23) by treatment month 12 compared with a matched placebo cohort (n=22) (P=.02).51 In that retrospective study, there was also a significantly lower reduction in myocardial work index and efficiency in the tafamidis group but no difference was noted in other echocardiographic parameters, such as change in LV ejection fraction or radial strain.51
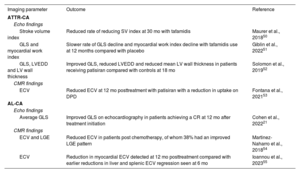
Summary of cardiovascular imaging modalities for disease surveillance in ATTR-CA and AL-CA
| Imaging parameter | Outcome | Reference |
|---|---|---|
| ATTR-CA | ||
| Echo findings | ||
| Stroke volume index | Reduced rate of reducing SV index at 30 mo with tafamidis | Maurer et al., 201850 |
| GLS and myocardial work index | Slower rate of GLS decline and myocardial work index decline with tafamidis use at 12 months compared with placebo | Giblin et al., 202251 |
| GLS, LVEDD and LV wall thickness | Improved GLS, reduced LVEDD and reduced mean LV wall thickness in patients receiving patisiran compared with controls at 18 mo | Solomon et al., 201952 |
| CMR findings | ||
| ECV | Reduced ECV at 12 mo posttreatment with patisiran with a reduction in uptake on DPD | Fontana et al., 202153 |
| AL-CA | ||
| Echo findings | ||
| Average GLS | Improved GLS on echocardiography in patients achieving a CR at 12 mo after treatment initiation | Cohen et al., 202221 |
| CMR findings | ||
| ECV and LGE | Reduced ECV in patients post chemotherapy, of whom 38% had an improved LGE pattern | Martinez-Naharro et al., 201854 |
| ECV | Reduction in myocardial ECV detected at 12 mo posttreatment compared with earlier reductions in liver and splenic ECV regression seen at 6 mo | Ioannou et al., 202355 |
AL-CA, immunoglobulin light-chain cardiac amyloidosis; ATTR-CA, transthyretin cardiac amyloidosis; CR, complete response; DPD, 99mTc-labeled 3,3-diphosphono-1,2-propanodicarboxylic acid; ECV, extracellular volume; GLS, global longitudinal strain; LGE, late gadolinium enhancement; LV, left ventricle; LVEDD, left ventricular end-diastolic volume, SV, stroke volume.
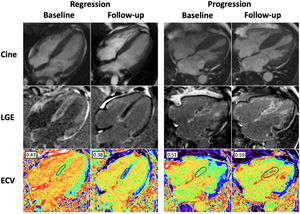
 by cardiac magnetic resonance. Use of cardiac magnetic resonance to determine cardiac amyloid regression and progression in ATTR-CA. The case images on the left represent treatment response in a patient receiving patisiran compared with a patient on the right who did not receive targeted treatment. Regression following patisiran treatment is exemplified by a reduction in late gadolinium enhancement (LGE) and extracellular volume (ECV) compared with baseline. Progression in the patient not receiving targeted ATTR drug treatment is illustrated by worsening biventricular LGE and increasing ECV when compared with baseline. Normal ECV range, 0.23-0.30.")
Changes over time in transthyretin cardiac amyloidosis (ATTR-CA) by cardiac magnetic resonance. Use of cardiac magnetic resonance to determine cardiac amyloid regression and progression in ATTR-CA. The case images on the left represent treatment response in a patient receiving patisiran compared with a patient on the right who did not receive targeted treatment. Regression following patisiran treatment is exemplified by a reduction in late gadolinium enhancement (LGE) and extracellular volume (ECV) compared with baseline. Progression in the patient not receiving targeted ATTR drug treatment is illustrated by worsening biventricular LGE and increasing ECV when compared with baseline. Normal ECV range, 0.23-0.30.
The APOLLO trial investigated the GLS strain longitudinal global efficacy of patisiran, an RNA–interference-based therapy that reduces hepatic production of TTR in patients with ATTRv-FAP.45 While that trial showed a significant improvement in neurological symptoms and quality of life in patients with ATTR-FAP,45 subgroup analysis was performed in trial participants (n=126) with predetermined echocardiographic features consistent with concurrent CA.52 At 18 months, patients receiving patisiran showed a significant reduction in mean LV wall thickness on echo (P=.017) and a higher incidence of absolute GLS improvement (ie,>−2% change) compared with the nontreatment control group (21.3% in the patisiran group vs 8% in controls).
The consensus document published in 2018 by Garcia-Pavia et al.56 recommends echocardiography as the surveillance imaging modality of choice for ATTR-CA with a repeat study advised every 6 to 12 months. Apart from cost and resource issues, lack of long-term surveillance data using CMR is a significant contributing factor to this surveillance recommendation. It is likely, however, that current drug treatment trials for ATTR-CA will provide increasing evidence to support the use of CMR as a surveillance tool in the future.46
A small prospective study similarly illustrated the potential usefulness of CMR in cardiac surveillance for patients on ATTR-CA therapies.53 The study analyzed the cardiac effect of patisiran in 16 patients compared with an untreated matched control group over 1 year using both CMR and DPD scintigraphy. By month 12, there was a significant overall reduction in ECV (adjusted mean value of −6.2 [95% confidence interval −9.5 to −3]; P=.001) in the treatment group compared with that in the control group (figure 2). This was deemed to reflect overall cardiac amyloid regression due to patisiran use. Among the total treatment group, 38% had a reduction in ECV by month 12, a phenomenon that did not occur in any control group participants. The study also found an overall reduction in cardiac uptake of 19.6% [IQR, 9.8, 27.1] on DPD scans secondary to patisiran. As radionucleotide uptake in soft tissue and bones can vary over time, it can alter the appearance of cardiac radiotracer uptake, making it an unpredictable modality for disease surveillance in clinical practice. As a result, the study concluded that bone scintigraphy should be reserved as a diagnostic tool only. This conclusion is supported by the consensus recommendation by Garcia-Pavia et al.56
Multiple phase III RCTs investigating the safety and efficacy of further targeted treatments in ATTR-CA are ongoing. These trials include investigation of the efficacy of the RNA-interference based therapy vutrisiran (HELIOS B, NCT04153149), TTR stabilizer acoramidis (ATTRibute-CM,NCT03860935) and antisense oligonucleotide therapy eplontersen (CARDIO-TTRansform, NCT04136171) in patients with ATTR-CA. A gene editing medication study “NTLA-2001” is similarly investigating the effect of hepatic TTR gene knock down in patients with ATTR-CA.11 Follow-up imaging with echocardiography and CMR substudies will provide invaluable insight into the cardiac changes that occur in response to drug treatment, as well as knowledge regarding optimal surveillance imaging modalities.
AL cardiac amyloidosisThe aim of treatment in AL-amyloidosis is cessation of free light-chain production to inhibit further organ damage and potentially allow organ function recovery. The median time to organ improvement is 10.2 months after initiation of chemotherapy, but only 25% to 50% of patients ever develop an organ response.5,57 In AL-amyloidosis, the optimal treatment regime often involves autologous stem cell transplant with prior chemotherapy induction.58 Due to the high morbidity associated with autologous stem cell transplant, only 20% of patients are generally eligible for this procedure. For 80% of the patients, treatment is based solely on chemotherapy, in which the preferred line of treatment consists of cyclophosphamide-bortezomib-dexamethasone and daratumumab, achieving a rate of complete response (CR) or very good partial response (VGPR) in 78% of patients.59 Alternative regimens consist of cyclophosphamide-bortezomib-dexamethasone alone or bortezomib-melphalan-dexamethasone.60
EchocardiographyMonitoring treatment response includes both the hematological and organ response, eg, cardiac response. Current guidelines defining cardiac response to treatment of AL-CA is based on the NT-proBNP response. A cardiac response is defined as>30% and a>300 ng/L reduction in NT-proBNP compared with the value at diagnosis.61 However, this is a nonspecific marker of mechanical stress on myocytes that is influenced by noncardiac factors such as renal impairment, which often hampers its interpretation. Further cardiac markers identifying treatment response are therefore necessary to improve patient surveillance. In a study by Cohen et al.,21 patients with a hematological CR following chemotherapy were found to have a significantly improved GLS on echo at 12 months postdiagnosis compared with those with a VGPR, partial response, or no response (table 2). A meaningful change in GLS was determined as a>−2% change to account for interoperator variability. In that study, improved GLS occurred only in patients with a CR and was not seen in any other hematological response group (ie, those with a VGPR or partial response).
In that study, an improvement in GLS on echo took a year to occur, while deteriorating GLS was noted as early as at 6 months in patients with no hematological response. As amyloid fibrils are relatively resistant to breakdown and reabsorption, time is needed in the absence of free light-chain deposition to allow this process of regression to occur. It was therefore hypothesized that up to 12 months is necessary, for the process of CA regression to occur and translate into an improved GLS. Patients with both an improved GLS combined with a hematological CR at 12 months had improved survival compared with those with a hematological CR alone. The median survival in this group with both a hematological CR and improved GLS was improved beyond the termination of the study at 50 months. Compared with a reduction in NT-proBNP alone, combined improvement in NT-proBNP and GLS was associated with increased survival.
Although cardiac response continues to be defined as a change in NT-proBNP, this study proposed the addition of “change in GLS” in response to chemotherapy as a potential marker of cardiac response. This proposal suggested that a change in GLS>−2% following chemotherapy represents an alternative definition to “cardiac response” from change in NT-proBNP. Similarly, no change in GLS would represent “stable cardiac disease” while deteriorating GLS shows “cardiac progression”.21
Cardiac magnetic resonanceThe use of CMR to monitor cardiac response to chemotherapy in patients with AL-CA is a promising area. A recent study analyzing ECV changes on CMR in response to chemotherapy determined that change in ECV was a powerful prognostic marker of survival.27 That study prospectively followed up 176 patients undergoing bortezomib-based chemotherapy for AL-CA with a CMR at 6, 12, and 24 months. A small proportion of patients (3%) had a reduction in ECV of>0.05 at 6 months, all of whom had an early hematological CR within the first 3 months of treatment. The incidence of patients with CA regression, as determined by reduced ECV, increased to 22% at 1 year and 38% at 2 years, all of whom had either a hematological CR or VGPR. Of the patients with cardiac progression, 63% at 1 year and 80% at 2 years had a hematological partial response or no response.
In that study, 25 patients died during follow-up, of whom none had a reduced ECV or cardiac regression determined on CMR at any time point. Cardiac response using CMR at 6 months was shown to be a prognostic survival marker, even after adjustment for hematological response, NT-proBNP, and change in GLS (P<.01).53 The study exemplifies the heterogeneity of cardiac responses within each hematological response group. As CR and VGPR represent low amyloid levels as a response to treatment, the study confirms that these hematological responses are necessary for cardiac regression, allowing a rate of amyloid clearance that exceeds the rate of deposition within the myocardium. CMR can improve predicted outcomes within the CR and VGPR groups by identifying patients with stable or improving ECV as having better predicted survival compared with those with worsening ECV. Ultimately, the study provides evidence for the potential usefulness and added value obtained by monitoring patients on treatment for AL-CA using ECV and T1 mapping derived by CMR (figure 3).
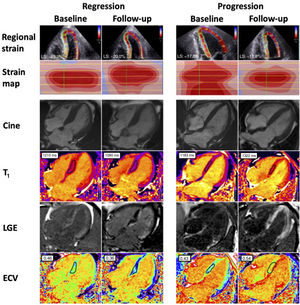
 by echocardiography and cardiac magnetic resonance. Use of cardiac magnetic resonance to determine cardiac amyloid regression and progression in AL-CA. The case images on the left represent amyloid regression after the achievement of a complete response postchemotherapy compared with a patient on the right showing evidence of amyloid progression. Regression following chemotherapy is exemplified by improvement in global longitudinal strain pn echocardiography, reduction in native T1 values, late gadolinium enhancement (LGE) and extracellular volume (ECV) compared with baseline. Progression is illustrated by worsening global longitudinal strain, native T1 values, biventricular LGE and increasing ECV compared with baseline. Normal global longitudinal strain<−16%. Normal range for native T1 (1.5T clinical scanner) is 950-1100ms. Normal ECV range, 0.23-0.30.")
Changes over time in immunoglobulin light-chain cardiac amyloidosis (AL-CA) by echocardiography and cardiac magnetic resonance. Use of cardiac magnetic resonance to determine cardiac amyloid regression and progression in AL-CA. The case images on the left represent amyloid regression after the achievement of a complete response postchemotherapy compared with a patient on the right showing evidence of amyloid progression. Regression following chemotherapy is exemplified by improvement in global longitudinal strain pn echocardiography, reduction in native T1 values, late gadolinium enhancement (LGE) and extracellular volume (ECV) compared with baseline. Progression is illustrated by worsening global longitudinal strain, native T1 values, biventricular LGE and increasing ECV compared with baseline. Normal global longitudinal strain<−16%. Normal range for native T1 (1.5T clinical scanner) is 950-1100ms. Normal ECV range, 0.23-0.30.
As understanding of the underlying pathophysiology responsible for CA increases, the number of potential treatment targets and therapeutic options will grow. The last decade has seen the development of gene silencing therapies for the treatment of ATTR, and following successful trial results, the first gene editing agent (NTLA-2001) is currently being tested in a phase I trial, with expansion to phase III expected in the next few years.10 Advances in cardiac imaging have contributed to ATTR being diagnosed earlier in the disease course, which has translated into improved survival.62 This will ultimately influence the design of future clinical trials, with a greater number of patients being recruited and for longer follow-up durations to ensure adequate power to evaluate the efficacy of novel agents. These changes will significantly increase the cost of clinical trials, and the question remains as to whether imaging parameters can be leveraged as surrogates to enable more cost-effective assessment of novel medicines.63,64
CMR-derived ECV as a surrogate for amyloid burden represents an important discovery, especially with the prospect of antibody therapies that facilitate the removal of amyloid fibrils being in advanced stages of development.65–67 Serial ECV measurements will potentially enable clinicians to visualize the removal of amyloid fibrils and subsequent disease regression following the administration of these novel agents. With a constantly expanding armamentarium of treatments, the ability to recognize responders and nonresponders is likely to enable individually tailored treatments in the future, which will in turn improve outcomes.64
CONCLUSIONAdvances in imaging techniques have transformed the treatment landscape of both diagnosis and monitoring treatment response in CA. The increased sensitivity of echocardiography, bone scintigraphy and CMR have contributed to earlier diagnosis and treatment initiation and have improved subsequent outcomes.64 Furthermore, the development of multiparametric mapping techniques has enhanced our understanding of how individual patients respond to treatment. Each breakthrough results in a greater understanding of the disease process and in turn helps guide treatment strategies.
AUTHORS’ CONTRIBUTIONSN. Starr, A. Ioannou and A. Martinez-Naharro contributed to the research, writing, and figure composition of this review article.
FUNDINGAll authors report no external funding for this work.
CONFLICTS OF INTERESTA. Martinez-Naharro has received honoraria for lectures and educational events from Pfizer. N. Starr and A. Ioannou have nothing to declare.