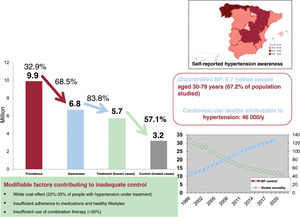

In Spain, 33% of adults aged 30 to 79 years (10 million) were hypertensive in 2019. Among them, 68% were diagnosed, 57% received drug therapy, and effective therapeutic coverage (control) reached 33%. Both diagnosis and control show geographical and social disparities. Approximately 46 000 cardiovascular deaths per year are attributable to hypertension. In recent decades, the control of hypertension has increased, due to improvements in lifestyle measures and increased use of polytherapy, coinciding with a reduction in stroke mortality. There are several modifiable determinants of the lack of hypertension control: a) white-coat phenomenon affects 22% to 33% of treated individuals, partly due to the limited availability of ambulatory blood pressure monitoring (ABPM) (49%) and self-measured BP (SMBP) (78%); b) inadequate patient adherence to medication and healthy lifestyles (weight loss, the most effective measure, is the least used, ≈40%); and c) insufficient use of polytherapy (≈55%). The remaining challenges include: a) technological aspects, such as measuring BP with more accurate techniques (ABPM, SMBP) and using cardiovascular-risk estimation tools (eg, SCORE); b) clinical challenges, such as reducing therapeutic inertia (≈59%), involving patients in their own management (medication adherence, ≈62%) and effectively implementing clinical guidelines); and c) public health challenges, such as reducing the burden of obesity (≈24%), monitoring progress with updated surveys, and setting national BP control targets.
Keywords
“That was indeed our last embrace. A few weeks later, back in Valencia, I received two telegrams from my father at the same time: one stated that my mother had suffered a severe brain hemorrhage; the other brought the news of her death. Through her high blood pressure, the history of Spain had killed her. Without a shadow of melodrama, and with the succinct objectivity of a medical certificate, I write these words” Descargo de conciencia, Pedro Laín Entralgo, 1976
Hypertension (blood pressure [BP] ≥140/90mmHg) is one of the main risk factors for cardiovascular disease worldwide.1–3 In addition, numerous studies have shown that lowering BP reduces cardiovascular risk.4–6BP is a biological trait that varies continuously in the population. Accordingly, beyond a systolic pressure of 115mmHg and a diastolic pressure of 75mmHg,4,5 there is no clear threshold above which cardiovascular risk increases.7 High BP affects approximately 1 billion adults worldwide, causes an estimated 10.8 million deaths every year, and is the main risk factor for loss of health (disability-adjusted life years) in individuals aged ≥49 years.3 Clinical practice guidelines typically define high BP as a pressure of ≥120/80mmHg,8,9 but for pragmatic purposes, they normally consider a person to have hypertension if, based on evidence from clinical trials, BP-lowering treatment can reduce their cardiovascular risk.
The recommended diagnostic threshold for hypertension is 140/90mmHg in Europe8,10,11 and 130/80mmHg in the United States.9 In recent decades, a greater understanding of the prognostic significance of high BP and hypertension—and the benefits and potential harms of treatment—has led to a gradual reduction in the thresholds used to diagnose hypertension. Thresholds also vary according to cardiovascular risk and underlying diseases or lesions.12 Treatment targets, in turn, are influenced by the availability of resources and individual and disease-related factors (“there are no diseases, just sick people”).
BP is highly variable and can be influenced by a range of everyday physical, psychological, and environmental factors. Measurement methods and conditions can lead to errors or misreadings, especially when judgments are based solely on isolated or office-based measurements.13 BP measurements are most accurate when averaged over multiple readings taken using standardized methods in nonclinical settings. Appropriate systems are ambulatory BP monitoring (ABPM) and self-measured (home) BP monitoring (SBPM) devices.14,15 Hypertension data also vary among different types of study. In population-based studies, for example, participants should be representative of the whole population in a specific region or country. Although clinical studies are easier to conduct, they generally include patients with a known diagnosis of hypertension (typically patients in worse health and more likely to seek medical care). Clinical trials, in contrast, typically enroll patients with specific health conditions who have access to certain health services. These patients are more likely to be diagnosed with hypertension, to receive pharmacologic treatment, and to achieve BP targets.16
The aims of this study were to review the latest epidemiological data on the magnitude and management (diagnosis, treatment, and control) of hypertension in Spain, explore associated risk factors and the impact of hypertension on mortality, and contextualize our findings within the international landscape.
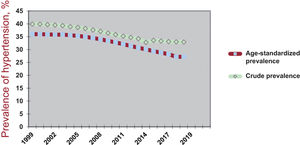
HYPERTENSION PREVALENCE AND DIAGNOSIS, TREATMENT AND EFFECTIVE TREATMENT COVERAGEThe findings of some of the most relevant clinical and population-based studies to analyze hypertension in Spain point to an increase in prevalence between 2010 and 201917–29 (table 1). The data, however, are crude and come from studies that have used different methodologies. Longer series based on data reported to the World Health Organization (WHO) over the last 2 decades (with interpolation of data for some years) have shown a progressive decline in the prevalence of hypertension among adults aged 30 to 79 years (figure 1).30
Magnitude and clinical management of hypertension (HTN) in Spain based on data from several surveys spanning the period 1990-2020
| Metric | Population-based and mixed-methods studies | Clinical studies | ||||||
|---|---|---|---|---|---|---|---|---|
| Year of survey | 199017,18 | - | 201019–21 | 201922–24 | 200225 | 200625 | 201025 | 2014-201826–28 |
| Age, y | 35-65 | — | ≥ 18 | ≥ 18 | ≥ 18 | ≥ 18 | ≥ 18 | 18-85 |
| Prevalence | 45% | — | 33% | 42% | — | — | — | 48% |
| Awareness | 45% | — | 59% | 77% | 100% | 100% | 100% | 100% |
| Treatment of known HTN | 72% | — | 80% | 92% | 100% | 100% | 100% | 94% |
| Total treatment | 32% | — | 47% | 71% | — | — | — | 94% |
| Control in patients with HTN under treatment | 16% | — | 49% | 65% | 36% | 41% | 46% | 63% |
| Total control | 5% | — | 23% | 46% | — | — | — | 58% |
| Year of survey | 199017,18 | 200029 | 201019–21 | — | 200225 | 200625 | 201025 | — |
|---|---|---|---|---|---|---|---|---|
| Age, y | 60-65 | ≥ 60 | ≥ 65 | — | ≥ 65 | ≥ 65 | ≥ 65 | — |
| Prevalence | 64% | 68% | 68% | — | — | — | — | — |
| Awareness | 50% | 65% | 69% | — | 100% | 100% | 100% | — |
| Treatment of known HTN | 78% | 85% | 89% | — | 100% | 100% | 100% | — |
| Total treatment | 39% | 55% | 61% | — | — | — | — | — |
| Control in patients with HTN under treatment | 30% | 30% | 40% | — | 33% | 38% | 40% | — |
| Total control | 12% | 17% | 24% | — | — | — | — | — |
—: studies or data not available. Control, blood pressure ≥140/90 mmHg or on medication.
Table produced using data from several surveys. Rates are averaged, crude, and rounded.
Total treatment and control rates are a percentage of total population of people with HTN. In all surveys, some of the management figures were inferred from other data.

Crude and age-standardized prevalence of hypertension among adults aged 30-79 years in Spain between 1999 and 2019.30–33
The number of people in Spain who are aware they have hypertension has increased significantly in recent years, as has the number of people with a known diagnosis who are receiving pharmacologic treatment and meeting their BP targets (table 1). Nonetheless, according to the most recent data available, just 77% of the Spanish population know that they are hypertensive and just 71% are receiving treatment. Approximately 63% to 65% of currently treated patients have their BP under control, with a somewhat lower rate observed among older patients (table 1). Effective treatment coverage, which refers to the percentage of patients with hypertension effectively controlled by treatment, is approximately 50% in Spain. Again, the rate is somewhat lower among older adults. While effective treatment coverage has improved significantly since the 1990s, there is still much room for improvement.
The most recent BP data for Spain are from the 2019 May Measurement Month initiative, a global BP screening awareness campaign led by the International Society of Hypertension and the World Hypertension League, with support from the Lancet Commission on Hypertension.22–24 The May Measurement Month is a mixed-methods study that measures BP in adult volunteers at diverse screening sites, such as pharmacies, health care centers, and outdoor public areas. The 2019 Spanish campaign showed that 77% of people with hypertension were aware of their condition, 71% were receiving treatment, and 46% had their BP under control (table 1).
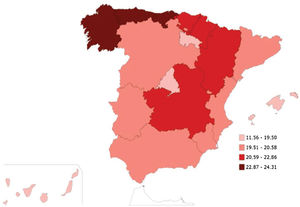
Awareness of high BP among the general public in Spain is largely consistent with findings from the 2017 Spanish Health Survey, in which 20.1% of the population aged ≥15 years stated they had hypertension, making it the most common self-reported chronic health condition that year.34 A similar rate, 19.9%, was observed in the 2020 European Health Survey.35 Hypertension diagnosis (figure 2)34 and control36 rates, however, vary considerably across the various regions in Spain.
 of known hypertension among individuals aged ≥15 years in Spain in 201734; data show by autonomous communities.")
Prevalence (%) of known hypertension among individuals aged ≥15 years in Spain in 201734; data show by autonomous communities.
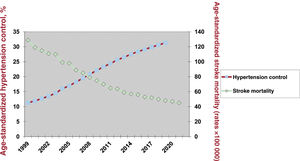
Based on hypertension data reported to the WHO in 2019 (or the closest available year prior),31–33 Spain ranks in the middle of the countries surveyed (table 2), with lower-than average prevalence rates and higher-than-average diagnosis, treatment, and control rates. Hypertension is more common in men, but women are more likely to be diagnosed and receive treatment. There are wide variations among countries, with prevalence rates of 45% or higher in Poland, Croatia, Iraq, Argentina, and Brazil, and very low control rates in Indonesia, Morocco, Nigeria, and Angola. Canada tops the ranking in terms of overall hypertension management, while Ethiopia takes last place. The DARIOS study detected regional variations in hypertension prevalence between adults aged 35 to 74 years in 10 autonomous communities in Spain.37 There are currently no known biological reasons why countries with the worst hypertension figures cannot match the performance of the top-ranking countries. If the main determinants of disease are largely economic and social, it follows that the remedies should also be economic and social.38
Age-standardized rates (%) showing the magnitude and management of hypertension in men and women aged 30-79 years in selected member and nonmember OECD countries in 2019
| Country | Prevalence (♂/♀) | Diagnosis (♂/♀) | Treatment (♂/♀) | Control (♂/♀) |
|---|---|---|---|---|
| Germany | 30 (34/25) | 72 (72/71) | 63 (61/65) | 45 (43/48) |
| Spain | 27 (34/21) | 65 (61/72) | 54 (51/58) | 31 (30/35) |
| Italy | 34 (39/29)a | 62 (59/65) | 54 (51/58) | 28 (25/33) |
| Portugal | 32 (37/28) | 69 (64/75) | 63 (57/71) | 45 (38/52) |
| United Kingdom | 26 (30/23) | 59 (60/58) | 48 (47/48) | 30 (31/29) |
| Slovenia | 45 (50/41)a | 63 (57/71) | 52 (45/60) | 23 (18/28) |
| Russia | 44 (47/41)a | 74 (67/81) | 50 (43/57) | 18 (14/21)a |
| The Ukraine | 43 (45/42)a | 65 (54/73) | 49 (36/59) | 14 (10/17)a |
| Turkey | 33 (31/34) | 62 (53/69) | 58 (51/64) | 32 (28/36) |
| China | 27 (30/24) | 52 (48/56)a | 39 (35/45)a | 16 (14/18)a |
| India | 31 (32/31) | 37 (32/42)a | 30 (25/35)a | 15 (11/19)a |
| Iran | 26 (27/26) | 59 (49/69) | 48 (38/58) | 24 (19/30) |
| Iraq | 48 (48/48)a | 61 (56/67) | 44 (39/48) | 13 (11/15)a |
| Israel | 29 (33/25) | 63 (61/66) | 53 (50/57) | 27 (24/31) |
| Japan | 31 (40/23) | 67 (66/68) | 48 (46/51) | 26 (24/30) |
| Ethiopia | 27 (25/30) | 34 (30/37)a | 16 (16/16)a | 6 (6/7)a |
| Morocco | 35 (35/36)a | 43 (34/52)a | 29 (20/37)a | 10 (6/14)a |
| Nigeria | 36 (33/39)a | 47 (42/51)a | 29 (27/30)a | 11 (11/11)a |
| Canada | 22 (24/20) | 78 (80/75) | 73 (76/71) | 61 (64/57) |
| United States | 32 (34/29) | 80 (78/83) | 70 (66/73) | 48 (45/51) |
| Mexico | 32 (33/31) | 58 (47/68) | 50 (39/60) | 28 (21/34) |
| Argentina | 48 (54/41)a | 58 (53/65) | 41 (35/48)a | 15 (11/19)a |
| Brazil | 45 (48/42)a | 67 (62/73) | 62 (54/70) | 33 (28/39)) |
| Australia | 29 (32/26) | 50 (58/61)a | 48 (47/50) | 26 (25/27) |
| All WHO countries | 33 | 54 | 42 | 21 |
WHO, World Health Organization.
Higher- or lower-than-average figures compared with general average for data reported to the World Health Organization.
Rates are adjusted for age according to the European standard population. People were considered to have hypertension if their blood pressure was ≥140/90 mmHg or they were on hypertensive medication. Treatment and control rates are percentage of total population with hypertension. The countries shown are a selection of countries with different levels of socioeconomic development from all 5 continents.
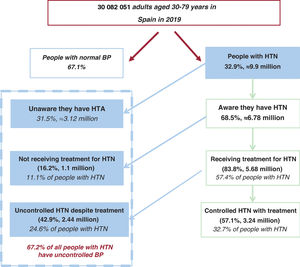
Crude epidemiological and clinical data on the burden and management of hypertension in adults aged 30 to 79 years in Spain (based on data reported to the WHO around 2019) are summarized in figure 3 and figure 4.31–33 Approximately 32.9% of the population studied (almost 10 million people according to the National Institute of Statistics)39 have hypertension; 6.8 million are aware they are hypertensive (diagnosis coverage rate, 68.5%), 5.7 million with a known diagnosis are receiving treatment (treatment coverage rate, 83.8%), and 3.2 million receiving treatment have their BP under control (effective treatment coverage rate, 57.1%). Overall, just 32.7% of all people with hypertension in Spain have controlled BP. In other words, 67.2% (6.7 million people) have uncontrolled BP: 31.5% are undiagnosed, 11.1% are untreated, and 24.6% are uncontrolled despite treatment (figure 3).
 among adults aged 30-79 years in Spain in 2019.30–33,39 Numbers are rounded. Controlled blood pressure (BP), <140/<90 mmHg. People with HTN had a BP ≥140/90 mmHg or were on antihypertensive medication.")
Flow chart showing magnitude and management of hypertension (HTN) among adults aged 30-79 years in Spain in 2019.30–33,39 Numbers are rounded. Controlled blood pressure (BP), <140/<90 mmHg. People with HTN had a BP ≥140/90 mmHg or were on antihypertensive medication.
.30–34,39 The illustration also shows geographic variations in hypertension awareness and the inverse relationship between age-standardized blood pressure (BP) control (↑) and stroke mortality (↓) over time.")
Central illustration. Burden of hypertension, diagnosis and treatment coverage, risk factors, and attributable cardiovascular mortality among adults aged 30-79 years in Spain (data for 2019).30–34,39 The illustration also shows geographic variations in hypertension awareness and the inverse relationship between age-standardized blood pressure (BP) control (↑) and stroke mortality (↓) over time.
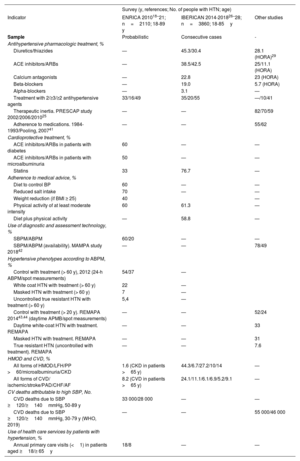
Several pharmacological, preventive, technological, and health service indicators used to assess hypertension are potentially useful in clinical and public health settings (table 3), but they are largely underreported and need updating.40
Frequency (%) of epidemiological indicators of potential use for monitoring hypertension clinical practice and public health settings in Spain
| Survey (y, references; No. of people with HTN; age) | |||
|---|---|---|---|
| Indicator | ENRICA 201018–21; n=2110; 18-89 y | IBERICAN 2014-201826–28; n=3860; 18-85y | Other studies |
| Sample | Probabilistic | Consecutive cases | - |
| Antihypertensive pharmacologic treatment, % | |||
| Diuretics/thiazides | — | 45.3/30.4 | 28.1 (HORA)29 |
| ACE inhibitors/ARBs | — | 38.5/42.5 | 25/11.1 (HORA) |
| Calcium antagonists | — | 22.8 | 23 (HORA) |
| Beta-blockers | — | 19.0 | 5.7 (HORA) |
| Alpha-blockers | — | 3.1 | — |
| Treatment with 2/≥3/≥2 antihypertensive agents | 33/16/49 | 35/20/55 | —/10/41 |
| Therapeutic inertia. PRESCAP study 2002/2006/201025 | — | — | 82/70/59 |
| Adherence to medications. 1984-1993/Pooling, 200741 | — | — | 55/62 |
| Cardioprotective treatment, % | |||
| ACE inhibitors/ARBs in patients with diabetes | 60 | — | — |
| ACE inhibitors/ARBs in patients with microalbuminuria | 50 | — | — |
| Statins | 33 | 76.7 | — |
| Adherence to medical advice, % | |||
| Diet to control BP | 60 | — | — |
| Reduced salt intake | 70 | — | — |
| Weight reduction (if BMI ≥ 25) | 40 | — | |
| Physical activity of at least moderate intensity | 60 | 61.3 | — |
| Diet plus physical activity | — | 58.8 | — |
| Use of diagnostic and assessment technology, % | |||
| SBPM/ABPM | 60/20 | — | — |
| SBPM/ABPM (availability). MAMPA study 201842 | — | — | 78/49 |
| Hypertensive phenotypes according to ABPM, % | |||
| Control with treatment (> 60 y), 2012 (24-h ABPM/spot measurements) | 54/37 | — | |
| White coat HTN with treatment (> 60 y) | 22 | — | |
| Masked HTN with treatment (> 60 y) | 7 | — | |
| Uncontrolled true resistant HTN with treatment (> 60 y) | 5,4 | — | |
| Control with treatment (> 20 y). REMAPA 201443,44 (daytime APMB/spot measurements) | — | — | 52/24 |
| Daytime white-coat HTN with treatment. REMAPA | — | — | 33 |
| Masked HTN with treatment. REMAPA | — | — | 31 |
| True resistant HTN (uncontrolled with treatment). REMAPA | — | — | 7.6 |
| HMOD and CVD, % | |||
| All forms of HMOD/LFH/PP >60/microalbuminuria/CKD | 1.6 (CKD in patients >65 y) | 44.3/6.7/27.2/10/14 | — |
| All forms of CVD/ ischemic/stroke/PAD/CHF/AF | 8.2 (CVD in patients >65 y) | 24.1/11.1/6.1/6.9/5.2/9.1 | — |
| CV deaths attributable to high SBP, No. | |||
| CVD deaths due to SBP ≥120/≥140mmHg, 50-89 y | 33 000/28 000 | — | — |
| CVD deaths due to SBP ≥120/≥140mmHg, 30-79 y (WHO, 2019) | — | — | 55 000/46 000 |
| Use of health care services by patients with hypertension, % | |||
| Annual primary care visits (<1) in patients aged ≥18/≥ 65y | 18/8 | — | — |
—: unavailable data. ACE, Angiotensin-converting enzyme; ABPM, ambulatory blood pressure monitoring; ARA-II, angiotensin II receptor antagonists; BMI, body mass index; BP, blood pressure; CHF, congestive heart failure; CKD, chronic kidney disease; CVD, cardiovascular disease; SBPM, home blood pressure self-monitoring; HTN, hypertension; LVH, left ventricular hypertrophy; PAD, peripheral arterial disease; PP, pulse pressure; SBP, systolic blood pressure; WHO, World Health Organization.
The percentages are rounded.
The prevalence of hypertension in the Spanish IBERICAN clinical study was 48%.26,27 This study analyzed cardiovascular and renal risk factors in 8066 adults aged 18 to 85 years between 2014 and 2018. Hypertension risk increased with the presence of comorbidities and risk factors such as obesity and diabetes and decreased with increasing physical activity. In total, 55% of the patients were being treated with a single antihypertensive medication. The most common agents used, either alone or in combination, were diuretics and angiotensin-converting enzyme (ACE) inhibitors or angiotensin II receptor blockers (ARBs); 58% of patients under treatment reached their BP target of <140/90mmHg. The population-based di@bet.es study, which analyzed 5048 patients aged ≥18 years randomly recruited from health care centers, found that 88.3% of patients with known hypertension were on pharmacologic treatment in 2010; 55.9% were being treated with a single agent while the rest (44.1%) had been prescribed at least 2 agents.36 The most common monotherapy agents were ACE inhibitors, followed by ARBs and diuretics. The most widely used combinations were diuretics with either an ARB (28.7%) or an ACE inhibitor (15.7%). According to data from 2010, 60% of patients with hypertension and diabetes were on cardioprotective therapy; the corresponding percentage for those with hypertension and microalbuminuria was 50% (table 3).20,21 Of the patients with hypertension identified in the 2014-2018 IBERICAN study, 76.7% were being treated with statins.26–28 Therapeutic inertia (no action taken to modify treatment in patients with inadequately controlled BP) among primary care physicians in the PRESCAP studies25 fell from 82% in 2002 to 59% in 2010, while patient-reported adherence to pharmacologic treatments increased slightly from 55% in the period 1984 to 1993 to 62% in 200741 (table 3). Adherence to preventive medical advice among patients with hypertension was modest in 2010 (≈60%).20 In the IBERICAN study (2014-2018), 58.8% of patients with hypertension reported following dietary and physical activity recommendations (table 3).26–28 The most effective advice (weight reduction) was the least followed.20 According to 2010 data from the Spanish population-based study, ENRICA, BP was assessed using SBPM in 60% of patients and ABPM in 20%.20 In the more recent MAMPA study, 78% and 49% of primary care physicians in Spain reported having access to SBPM and ABPM devices, respectively.42 Geographic variability in the use of these devices was notable, with regional rates ranging from 54% to 96% for SBPM.45 The main reasons cited for the lower use of ABPM were limited availability and a lack of specific training.
Table 3 shows the prevalence of different hypertension phenotypes according to data from the Spanish clinical practice ABPM Registry (published in 2016)43 and the ABPM section of the population-based ENRICA study (2014-2018).46 ABPM has been found to nearly double BP control rates compared with spot measurements taken in clinical or home settings (52%-54% vs 24%-37%),43,46 suggesting that ineffective BP control in primary care is not as common as believed. The prevalence of true resistant hypertension (hypertension after white coat effects have been ruled out) ranged from 5% to 8% a decade ago44,47 (table 3).
Additional data shown in table 3 include the prevalence of hypertension-mediated organ damage and cardiovascular disease in individuals with hypertension (higher in the IBERICAN primary care study than in the general population)28 and the frequency of visits made by patients with hypertension to their primary care physician (at most, once a year).
FACTORS CONTRIBUTING TO THE HIGH BURDEN OF UNCONTROLLED HYPERTENSIONSeveral notable factors contribute to inadequate BP control in Spain. The first is the white coat effect, responsible for approximately 20% to 30% of all falsely identified cases of inadequate BP control.47 These cases may or may not be linked to insufficient use of ABPM or SBPM (table 3).20,42
The second factor contributing to inadequate BP in Spain is poor adherence to heart-healthy lifestyles with a BP-lowering effect.20 Just 40% of adults surveyed in a nationwide study, for example, consumed less than 2.4g of sodium a day, while 60% did not follow weight loss advice. Six of every 10 adults surveyed, however, did engage in physical activity of at least moderate intensity (table 3). Medication adherence among adults with hypertension has increased over time, from rates ranging from 46.4% (based on tablet counts) to 55.5% (based on self reports) in the 1980s and 1990s to 62% in 2007.41
The third notable factor underlying inadequate BP control in Spain is insufficient use of combination therapy. In the IBERICAN study (2014-2018), around 55% of individuals with hypertension were being treated with more than 1 antihypertensive medication.26–28 In the older hypertensive population (≥60 years), the proportion of patients on combination therapy increased from 41% in 2000 to 49% in 2010; the increase was accompanied by an improvement in BP control rates (from 30% to 43%).21 In 2010, primary care physicians in Spain changed hypertension treatment strategies in just 40% of patients with uncontrolled BP.25 The main reason given for this inertia was the belief that the patients’ BP was under control.
The fourth factor contributing to inadequate BP control is masked hypertension. Masked uncontrolled hypertension, as determined by spot in- and out-of-office measurements, is both common (prevalence of approximately 10%-30% in patients under treatment) and associated with poor outcomes8,9,43,48–50 (table 3). Unless ABPM shows elevated BP levels, patients with masked uncontrolled hypertension typically continue to be undertreated as they have normal in-office measurements.
As demonstrated by the highly successful hypertension program launched by Kaiser Permanente Northern California, a private health care organization with millions of members,51 health care systems can achieve excellent BP control rates within a relatively short time span. The Kaiser Permanente program had several key elements that contributed to its success: a) a hypertension registry that formed part of a comprehensive health care delivery system (in Spain, this could be a region, an autonomous community, or an private insurance company); b) a central team that sends BP treatment and control results to each of the organization's medical centers; c) evidence-based clinical guidelines (4-step algorithm disseminated in multiple formats, including paper and digital, that occupy just 1-2 pages); d) follow-up visits with trained medical assistants who typically take BP measurements and send the results to patients’ primary care physicians in a setup that does not require copayment; and e) use of single pills combining medications (eg, diuretic+ACE inhibitor) to improve treatment adherence, BP control, and costs. According to a Cochrane review on BP control interventions, the most effective system for primary care settings, outperforming both patient- and clinician-centered interventions, is an organized setup that includes regular patient reviews.52
BEHAVIORAL AND SOCIAL DETERMINANTS OF HIGH BP AND HYPERTENSIONHypertension usually results from a complex interplay among genetic, environmental, and demographic factors. The pathogenesis of hypertension is unlikely to be driven by just a few major genes. According to some estimates, newly diagnosed hypertension is attributable to excess body weight in 50% of cases, excess salt intake (>4.5g/d) in 30%, and physical inactivity in 16%.53
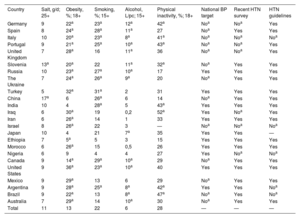
The prevalence of different risk factors for hypertension in a selection of countries, including member and nonmember states of the Organization for Economic Cooperation and Development (OECD), are shown in table 4, alongside information on related health policy aspects.31–33,54 Spain has lower-than-average values for salt intake and physical inactivity and higher-than-average values for smoking, obesity, and alcohol consumption. Of the countries surveyed, Canada has the best hypertension and clinical management figures, and, accordingly, the lowest age-standardized rates for mortality attributable to high SBP and stroke (data not shown). As part of its national efforts to manage hypertension, Spain has conducted a number of population-based surveys (although these were completed some years ago) and established clinical guidelines for diagnosing and treating hypertension10 (table 4).
Frequency (%) of risk factors for hypertension in adults aged 30-79 years from selected OECD and non-OECD countries and availability of national targets and initiatives
| Country | Salt, g/d; 25+ | Obesity, %; 18+ | Smoking, %; 15+ | Alcohol, L/pc; 15+ | Physical inactivity, %; 18+ | National BP target | Recent HTN survey | HTN guidelines |
|---|---|---|---|---|---|---|---|---|
| Germany | 9 | 22a | 23a | 12a | 42a | Noa | Noa | Yes |
| Spain | 8 | 24a | 28a | 11a | 27 | Noa | Yes | Yes |
| Italy | 10 | 20a | 23a | 8a | 41a | Noa | Noa | Noa |
| Portugal | 9 | 21a | 25a | 10a | 43a | Noa | Noa | Yes |
| United Kingdom | 7 | 28a | 16 | 11a | 36 | Noa | Noa | Yes |
| Slovenia | 13a | 20a | 22 | 11a | 32a | Noa | Yes | Yes |
| Russia | 10 | 23a | 27a | 10a | 17 | Yes | Yes | Yes |
| The Ukraine | 7 | 24a | 26a | 9a | 20 | Noa | Yes | Yes |
| Turkey | 5 | 32a | 31a | 2 | 31 | Yes | Yes | Yes |
| China | 17a | 6 | 26a | 6 | 14 | Noa | Yes | Yes |
| India | 10 | 4 | 28a | 5 | 43a | Yes | Yes | Yes |
| Iraq | 6 | 30a | 19 | 0,2 | 52a | Yes | Noa | Yes |
| Iran | 6 | 26a | 14 | 1 | 33 | Yes | Yes | Yes |
| Israel | 8 | 26a | 22 | 3 | — | Noa | Noa | Noa |
| Japan | 10 | 4 | 21 | 7a | 35 | Yes | Yes | — |
| Ethiopia | 7 | 5a | 5 | 3 | 15 | Yes | Yes | Yes |
| Morocco | 6 | 26a | 15 | 0,5 | 26 | Yes | Yes | Yes |
| Nigeria | 6 | 9 | 4 | 4 | 27 | Yes | Noa | Noa |
| Canada | 9 | 14a | 29a | 10a | 29 | Noa | Yes | Yes |
| United States | 9 | 36a | 23a | 10a | 40 | Yes | Yes | Yes |
| Mexico | 9 | 29a | 13 | 6 | 29 | Noa | Yes | Yes |
| Argentina | 9 | 28a | 25a | 8a | 42a | Yes | Yes | Noa |
| Brazil | 9 | 22a | 13 | 8a | 47a | Noa | Yes | Noa |
| Australia | 7 | 29a | 14 | 10a | 30 | Noa | Yes | Yes |
| Total | 11 | 13 | 22 | 6 | 28 | — | — | — |
—, unavailable data; BP, blood pressure; HTN, hypertension; L/pc, liters per capital; national BP target (proportion of people with HTN with controlled BP); OECD, Organization for Economic Co-operation and Development.
Higher than overall average rates (where available).31–33,54,55
Total: averages for OECD and non-OECD countries with available data according to the World Health Organization.34 The table shows a selection of countries with various levels of socioeconomic development from the 5 continents.
All rates except salt intake rates are adjusted for age.
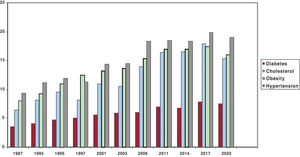
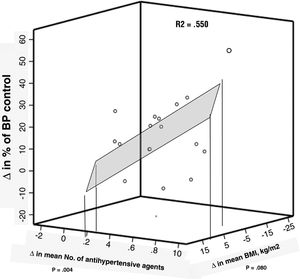
It is important to determine the main dietary sources of salt in patients with hypertension. Bread, for example, is a major source in Spain.56 Considering that hypertension is largely preventable, one must wonder why it is still so common and why, in some places, it is still increasing. The short answer is the obesity epidemic, physical inactivity, and unhealthy eating habits. Based on self-reported survey data for adults, the prevalence of obesity, certain forms of physical inactivity, diabetes, hypercholesterolemia, and hypertension have all increased in the past 3 decades34,35 (figure 5). Although part of the increase is due to new and improved diagnoses, prevalence rates remain very high. Similarly, the improved BP control rates observed in older adults in Spain between 2000 and 2010, while positively associated with increases in the mean number of antihypertensive drugs, were negatively associated with changes in mean body mass index21 (figure 6). Considering that the primary determinants of high BP are political and social,38 public health efforts to prevent hypertension should start by securing a shared commitment from public authorities and clinical organizations to enhance policies in this area (table 4, last 3 columns).
. Adults aged >15 years in Spain, 1987-2020.34,35")
Changes in the prevalence of self-reported obesity, hypertension, hypercholesterolemia, and diabetes (%). Adults aged >15 years in Spain, 1987-2020.34,35
 in blood pressure (BP) control among patients with hypertension under treatment and changes in body mass index (BMI) and number of antihypertensive agents. Older adults in Spain, 2000-2010.21 R, correlation coefficients for relationship between changes in hypertension control and mean BMI or mean number of antihypertensive agents. R2, proportion of change in control explained by changes in BMI and number of medications. Figure produced using data from Banegas et al.21")
Correlations between changes (Δ) in blood pressure (BP) control among patients with hypertension under treatment and changes in body mass index (BMI) and number of antihypertensive agents. Older adults in Spain, 2000-2010.21 R, correlation coefficients for relationship between changes in hypertension control and mean BMI or mean number of antihypertensive agents. R2, proportion of change in control explained by changes in BMI and number of medications. Figure produced using data from Banegas et al.21
After adjustment for age and educational attainment, women in the Spanish population-based ENRICA study19 had lower hypertension rates and better diagnosis, treatment, and control rates than men. On comparing results by educational achievement, people with a primary education or less had higher hypertension and worse BP control rates than those with a higher level of education. Social support also appears to exert a favorable effect on daytime and nighttime BP values in both men and women.57
IMPACT OF HIGH BP AND HYPERTENSIONHigh BP (≥ 120/80mmHg) is one of the leading causes of premature death and disability worldwide.3,58 While hypertension (≥140/90mmHg) is more common and harmful in older adults, untreated systolic BP in the range of 130 to 139 mmHg also increases the long-term risk of cardiovascular morbidity and mortality in this population. This risk is also increased in middle-aged and even relatively young people undergoing primary prevention due to low to moderate cardiovascular risk. The use of stricter systolic BP targets in these cases could be beneficial.59
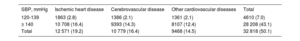
In Spain, 47% of cardiovascular deaths reported for adults aged 30 to 79 years in 2019 were attributable to as SBP ≥110-115mmHg; the corresponding rates for men and women were 49% and 46%, respetively.31 Of the 55 460 cardiovascular deaths reported, 46 000 were attributed to hypertension and 9000 to normal or normal-high systolic BP. In adults aged ≥50 years, who are at increased risk of high systolic BP (≥120mmHg) and mortality, 32 818 cardiovascular deaths were attributed to a systolic BP of 120mmHg or higher in 2014 (table 5). In total, 43% of these deaths were attributable to hypertension and 7% to normal or normal-high BP (120-139mmHg) (40% of the Spanish population aged ≥50 years have normal-high BP). In other words, 1 in 2 cardiovascular deaths in individuals aged 50 years or older are the result of high BP, in conjunction with other factors. These numbers highlight the need for improved prevention, diagnosis, and treatment.
Cardiovascular mortality attributable to high SBP in adults aged 50-89 years by type of disease and BP category (Spain, 2015)
| SBP, mmHg | Ischemic heart disease | Cerebrovascular disease | Other cardiovascular diseases | Total |
|---|---|---|---|---|
| 120-139 | 1863 (2.8) | 1386 (2.1) | 1361 (2.1) | 4610 (7.0) |
| ≥ 140 | 10 708 (16.4) | 9393 (14.3) | 8107 (12.4) | 28 208 (43.1) |
| Total | 12 571 (19.2) | 10 779 (16.4) | 9468 (14.5) | 32 818 (50.1) |
SBP, systolic blood pressure.
Figures are expressed as No. of deaths and corresponding proportion with respect to total cardiovascular deaths. Table created using data from Banegas et al.20,21,40,60
Individual relative risk increases with BP, but at the population level, cardiovascular deaths are frequently caused by just a slight increase in BP. Population-wide preventive strategies are therefore needed to complement clinical and high-risk approaches. If Spain were to adopt the US threshold for high BP (≥130/80mmHg), the proportion of people considered to have high BP would increase from 33% (based on the current threshold of ≥140/90mmHg) to 47%, adding approximately 5 million people to the total caseload of patients with hypertension and placing additional strains on the health care system as approximately 1.5 million of these people might need treatment.61 The purpose of the current threshold used in Spain (140/90mmHg) is to identify high-risk patients. This approach, however, is not incompatible with ensuring that patients with what in Europe is often referred to as normal-high BP receive adequate care, particularly in terms of lifestyle prescriptions.
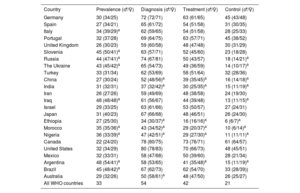
Although stroke mortality rates in Spain have decreased by 30% in both men and women over the past 10 years,54,62,63 stroke remains the third leading cause of death in our country. Age-standardized data spanning 20 years from the WHO and the Spanish Ministry of Health show a consistent inverse relationship between stroke mortality and BP control (figure 7). While these data are synchronous, clinical trials have shown that improvements to BP control can significantly decrease the risk of mortality from stroke in a relatively short time.53 Hypertension rates are also useful for detecting and monitoring geographic variations in stroke.55
 and age-standardized stroke mortality (per 100 000 inhabitants). Adults aged 30-79 year in Spain, 1999-2019. Hypertension control, blood pressure <140/<90 mmHg in a person with known hypertension. Produced using data from the World Health Organization31–33 and the Spanish Ministry of Health.39")
Changes over time in age-standardized hypertension control (%) and age-standardized stroke mortality (per 100 000 inhabitants). Adults aged 30-79 year in Spain, 1999-2019. Hypertension control, blood pressure <140/<90 mmHg in a person with known hypertension. Produced using data from the World Health Organization31–33 and the Spanish Ministry of Health.39
Hypertension also impacts the incidence of other cardiovascular diseases and conditions such as kidney disease and dementia. Finally, hypertension is a powerful predictor of frailty and disability in older people, although comparative statistics are lacking.64,65
HYPERTENSION AND COVID-19Hypertension is a significant factor for more severe forms of COVID-19, notably in relation to its effects on the cardiovascular system. The COVID-19 pandemic also indirectly affected BP control and incident cardiovascular disease due to restrictions limiting health care access and follow-up visits for patients with hypertension. Amidst these restrictions, there were significant reductions in health care activities, even in interventional cardiology units.66 A recent WHO survey confirmed disruptions to hypertension management services,67 although the long-term effects of these interruptions remain to be determined. Data on the impact of the first wave of the pandemic on all-cause mortality in industrialized countries show differential effects, with Spain reporting some of the highest excess death rates.68 Finally, hypertension development and management may also have been directly or indirectly affected by other consequences of the pandemic and lockdown, such as stress, physical inactivity, excessive smoking and drinking, and unhealthy eating habits.69–71
CONCLUSIONS AND FUTURE DIRECTIONSAlthough high BP has significant cardiovascular and renal effects, hypertension awareness, treatment, and control rates remain suboptimal around the world.58 In Spain, lifestyle changes and improvements to pharmacologic treatment have resulted in enhanced BP control in recent years. ABPM has the potential to almost double BP control rates compared with office-based measurements, an observation that should provide primary care physicians, who are largely responsible for the day-to-day care of patients with hypertension, with a sense of satisfaction and continued motivation. Notwithstanding, we must not let our guard down, because even with ABPM, many patients remain untreated or uncontrolled despite treatment.
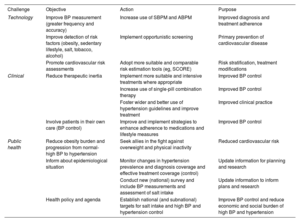
There are 3 challenges or areas for improvement for the immediate future8,11,14,60,72,73 (table 6). From a technological standpoint, the challenge is to improve the accuracy of BP measurements and encourage greater use of both ABPM and SBPM to improve diagnostic rates and enable more effective monitoring of treatment adherence.14,41 There is also a need for improved detection of cardiovascular risk factors and broader adoption of risk calculation and scoring systems, which remain underused.8–11,25–28 Clinically, the challenge lies in reducing therapeutic inertia and fostering greater patient engagement in their care. This requires: a) the use of more suitable and intensive treatment strategies, such as single-pill combinations, where appropriate 8,10; b) the formulation of strategies to improve adherence to pharmacologic guidelines and lifestyle changes, and c) greater and more effective implementation of clinical practice guidelines.72 The challenge from a public health perspective lies in: a) reducing the burden of obesity and preventing progression from normal-high BP to hypertension,60 and b) monitoring hypertension prevalence while improving diagnosis, treatment, and control rates, particularly at the population and national levels. This second challenge requires new data. To this end, Spain should undertake a new health survey including physical examinations, BP measurements, and the collection of biological samples from a representative sample of the country, and, if possible, its different regions. There is also a need for decisive campaigns targeting obesity and physical inactivity.
Challenges, areas for improvement, and recommendations in relation to controlling high BP in Spain in the near future
| Challenge | Objective | Action | Purpose |
|---|---|---|---|
| Technology | Improve BP measurement (greater frequency and accuracy) | Increase use of SBPM and ABPM | Improved diagnosis and treatment adherence |
| Improve detection of risk factors (obesity, sedentary lifestyle, salt, tobacco, alcohol) | Implement opportunistic screening | Primary prevention of cardiovascular disease | |
| Promote cardiovascular risk assessments | Adopt more suitable and comparable risk estimation tools (eg, SCORE) | Risk stratification, treatment modifications | |
| Clinical | Reduce therapeutic inertia | Implement more suitable and intensive treatments where appropriate | Improved BP control |
| Increase use of single-pill combination therapy | Improved BP control | ||
| Foster wider and better use of hypertension guidelines and improve treatment | Improved clinical practice | ||
| Involve patients in their own care (BP control) | Improve and implement strategies to enhance adherence to medications and lifestyle measures | Improved BP control | |
| Public health | Reduce obesity burden and progression from normal-high BP to hypertension | Seek allies in the fight against overweight and physical inactivity | Reduced cardiovascular risk |
| Inform about epidemiological situation | Monitor changes in hypertension prevalence and diagnosis coverage and effective treatment coverage (control) | Update information for planning and research | |
| Conduct new (national) survey and include BP measurements and assessment of salt intake | Update information to inform plans and research | ||
| Health policy and agenda | Establish national (and subnational) targets for salt intake and high BP and hypertension control | Improve BP control and reduce economic and social burden of high BP and hypertension |
ABPM, ambulatory blood pressure monitoring; BP, blood pressure; CVD, cardiovascular disease; SBPM, self-measured blood pressure monitoring.
Table created using data from Mancia et al.,8 Whelton et al.,9 Gorostidi et al.,10 Orozco-Beltrán et al.,11 Gijón-Conde et al.,14 Banegas et al.,60,73 and Whelton et al.72
The challenges outlined in the areas of health policy, research, and technological development represent a collective health and social responsibility involving a wide range of stakeholders, whether patients or not. These stakeholders include health care professionals (physicians, nurses, pharmacists, nutritionists, physical activity scientists/technologists, environmentalists, epidemiologists, statisticians, computer scientists), as well as scientific societies, primary and specialized health care systems, politicians, and citizens.10,11,40,60,73 Greater national and international collaboration is also needed. One notable national initiative is the IMPacT study, a comprehensive predictive medicine program that has already been launched by the CIBER research network under the auspices of Instituto de Salud Carlos III. The project will collect data from 200 000 people across 50 primary care centers throughout Spain. In the cardiovascular domain, researchers will conduct a series of assessments, including electrocardiograms, echocardiograms, ankle-brachial index tests, and ABPM.74
FUNDINGThis study was funded in part by the Instituto de Salud Carlos III (ISCIII) (FIS grant 22/1164) and the European Social Fund/European Regional Development fund.
STATEMENT ON THE USE OF ARTIFICIAL INTELLIGENCEThe authors did not use artificial intelligence during the preparation of this study.
AUTHORS’ CONTRIBUTIONSJ.R. Banegas conceived the study and drafted the manuscript. All the authors meet the journal's requirements for coauthorship, critically reviewed the manuscript, and approved its final version.
CONFLICTS OF INTERESTThe authors declare that they have no conflicts of interest.