
Pulmonary vascular remodeling is common among patients with advanced heart failure. Right heart catheterization is the gold standard to assess pulmonary hypertension, but is limited by indirect measurement assumptions, a steady-flow view, load-dependency, and interpretation variability. We aimed to assess pulmonary vascular remodeling with intravascular optical coherence tomography (OCT) and to study its correlation with hemodynamic data.
MethodsThis observational, prospective, multicenter study recruited 100 patients with advanced heart failure referred for heart transplant evaluation. All patients underwent right heart catheterization together with OCT evaluation of a subsegmentary pulmonary artery.
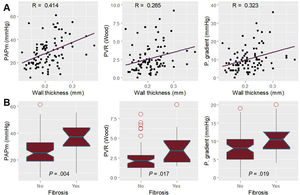
ResultsOCT could be performed and properly analyzed in 90 patients. Median age was 57.50 [interquartile range, 48.75-63.25] years and 71 (78.88%) were men. The most frequent underlying heart condition was nonischemic dilated cardiomyopathy (33 patients [36.66%]). Vascular wall thickness significantly correlated with mean pulmonary artery pressure, pulmonary vascular resistance, and transpulmonary gradient (R coefficient=0.42, 0.27 and 0.32 respectively). Noninvasive estimation of pulmonary artery systolic pressure, acceleration time, and right ventricle-pulmonary artery coupling also correlated with wall thickness (R coefficient of 0.42, 0.27 and 0.49, respectively). Patients with a wall thickness over 0.25mm had significantly higher mean pulmonary pressures (37.00 vs 25.00mmHg; P=.004) and pulmonary vascular resistance (3.44 vs 2.08 WU; P=.017).
ConclusionsDirect morphological assessment of pulmonary vascular remodeling with OCT is feasible and is significantly associated with classic hemodynamic parameters. This weak association suggests that structural remodeling does not fully explain pulmonary hypertension.
Keywords
The prevalence of heart failure keeps rising due to population aging and increased survival in coronary and valvular heart diseases.1,2 About 5% of heart failure patients have advanced heart failure with a poor short-term prognosis without heart transplant or a left ventricular assist device.3 Pulmonary hypertension (PH) secondary to left-heart disease (PH-LHD) constitutes the most common form of PH, affecting over 50% patients with left-sided heart failure and is associated with more severe symptoms, lower exercise tolerance, and higher mortality.4,5 A thorough characterization of PH is essential in the evaluation of candidacy for heart transplant, as the presence of significant PH is considered a contraindication.6
Right heart catheterization remains the gold standard for the analysis of pulmonary circulation hemodynamics.4 However, this procedure has several limitations. First, hemodynamic parameters are indirect surrogates of pulmonary vasculopathy and are highly influenced by many determinants, such as heart rate or volume status or volemia. Second, there is a poor correlation with histopathological findings and the prognostic implication of right heart catheterization data is inconsistent.7–12 Finally, measurement challenges and variability in interpretation limit the reliability of the results.4,13 Therefore, there is an unmet need for a better assessment of pulmonary vascular remodeling. Morphological evaluation of PH was, until recently, limited to biopsy and autopsy. Optical coherence tomography (OCT) is rapidly evolving and is used in some types of PH, providing relevant information on diagnosis and management.14–17 However, evidence about its feasibility and clinical usefulness in advanced heart failure is scarce. Previous data suggest that pulmonary vascular remodeling could translate into greater wall thickness (WT).14 Our aim was to study the correlation between OCT results and hemodynamics in patients with advanced heart failure.
METHODSStudy designThe design of the Optical coherence tomography observation of pulmonary ultra-structural changes in heart failure (OCTOPUS-CHF) study has been published.18 OCTOPUS-CHF is an observational, prospective, multicenter study that recruited 100 adults with advanced heart failure referred for heart transplant in 9 hospitals between 10 January, 2019 and 15 December, 2020. All patients underwent right heart catheterization together with OCT evaluation of a subsegmentary pulmonary artery of the right-lower or the right-middle lobe (luminal diameter <5mm and minimal length of 50mm) according to the study protocol. The procedure was carried out under optimal medical treatment and with the patient in euvolemia.18 We excluded patients under mechanical circulatory support, cardiogenic shock, decompensated heart failure, and those awaiting urgent heart transplant. All the patients were potential candidates for heart transplant. Therefore, significant comorbidities, such as chronic kidney disease, chronic obstructive pulmonary disease, or other causes of PH, were ruled out before inclusion. The only catheterization recorded in this study was that performed to list patients for heart transplant. This was also the case of patients on inotrope-dependency or requiring vasodilator testing.
Data managementData were collected in an electronic case report form specifically designed for this purpose. The hemodynamic, echocardiographic and OCT studies were anonymized and directly sent to the central core lab of the coordinating center. Hemodynamic data were interpreted at each institution by an experienced interventional cardiologist according to standard clinical practice. Echocardiographic studies were blindly and retrospectively analyzed by the core lab of the coordinating center following current recommendations.19 OCT assessment was centralized in the coordinating center and performed by an experienced interventional cardiologist (EGI), who was blinded to the hemodynamic data. JMS measured 20 pulmonary OCT studies randomly selected. A concordance analysis was carried out to evaluate the reproducibility of this technique.
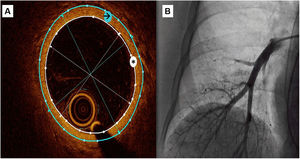
OCT measurementsA semiautomatic method was used to measure the lumen area and the external vessel wall area, as well as internal and external diameters (figure 1). These data were obtained as the mean of the measurements taken in 3 selected frames with a vessel diameter around 3mm
 and the external vessel wall area (black arrow), then mean internal and external diameters were automatically obtained. Wall thickness was calculated as external diameter-internal diameter)/2 and wall thickness area with the difference between external and internal area. B: pulmonary angiography during OCT recording.")
Central illustration. OCT recording of a subsegmentary pulmonary artery. A: a semiautomatic method was used to measure the lumen area (white asterisk) and the external vessel wall area (black arrow), then mean internal and external diameters were automatically obtained. Wall thickness was calculated as external diameter-internal diameter)/2 and wall thickness area with the difference between external and internal area. B: pulmonary angiography during OCT recording.
WT was calculated as (external diameter-internal diameter)/2 (mm); WT index was calculated as 2 x WT/internal diameter x 100 (%); WT area was calculated as the difference between external area and internal area (mm2); and WT area index (iWTA) was calculated as WT area/internal area x 100 (%). We used WT as our main study variable. We used the indexed variables WT index and iWTA to correct for vessel size variability.
Statistical analysisThe normality of the distribution of continuous variables was studied with the Shapiro-Wilk test. Normally distributed variables are presented as mean±standard deviation, and nonnormal variables as median [interquartile range]. Categorical variables are shown as absolute values and percentages. The 75th percentile 0.25mm was arbitrarily chosen as the WT cutoff value and dichotomically considered “fibrosis”. Similarly, a pulmonary resistance over 3 Wood Units was dichotomically set as “high resistance” since this point defines the precapillary component of the updated classification of PH.20 The Student t test was used to compare normally distributed variables, the Kruskal-Wallis test for nonnormally distributed variables and the chi-square test was used for categorical variables. The correlation between OCT measurements (WT and iWTA) and hemodynamic or echocardiographic variables was analyzed using the linear Pearson correlation coefficient R. The agreement between the 2 operators that measured pulmonary OCT was analyzed with the concordance correlation coefficient. A receiver operating characteristic curve was plotted to illustrate the diagnostic ability of WT and iWTA to discriminate the presence of high pulmonary vascular resistance. Analysis was performed with R version 4.0.2 (R Core Team, Vienna, Austria) and SPSS 25.0 software (SPSS Inc, Chicago, IL, USA).
Ethical aspectsThe study followed the Declaration of Helsinki. The protocol was approved by the ethics committee of each participating center. All patients provided written informed consent.
RESULTSAmong 100 recruited patients, OCT could be performed and properly analyzed in 90 patients. OCT could not be achieved in 4 patients for technical reasons (ie, wire support and vessel tortuosity); 3 OCT recordings did not have sufficient quality for analysis, and 3 patients had complications leading to a premature ending of the procedure (2 catheter-induced ventricular arrhythmias requiring cardioversion without further relevance and 1 acute pulmonary edema). Complete echocardiographic assessment could be performed in 78 out of those 90 patients.
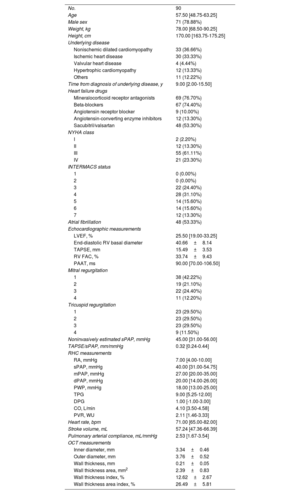
Demographic, hemodynamic, echocardiographic, and morphological data are depicted in table 1. Median age was 57.5 years. Interestingly, age was significantly associated with pulmonary vascular resistances but not with morphological data. The most frequent underlying heart disease was nonischemic dilated cardiomyopathy followed by ischemic heart disease.
Baseline patient characteristics.
| No. | 90 |
| Age | 57.50 [48.75-63.25] |
| Male sex | 71 (78.88%) |
| Weight, kg | 78.00 [68.50-90.25] |
| Height, cm | 170.00 [163.75-175.25] |
| Underlying disease | |
| Nonischemic dilated cardiomyopathy | 33 (36.66%) |
| Ischemic heart disease | 30 (33.33%) |
| Valvular heart disease | 4 (4.44%) |
| Hypertrophic cardiomyopathy | 12 (13.33%) |
| Others | 11 (12.22%) |
| Time from diagnosis of underlying disease, y | 9.00 [2.00-15.50] |
| Heart failure drugs | |
| Mineralocorticoid receptor antagonists | 69 (76.70%) |
| Beta-blockers | 67 (74.40%) |
| Angiotensin receptor blocker | 9 (10.00%) |
| Angiotensin-converting enzyme inhibitors | 12 (13.30%) |
| Sacubitril/valsartan | 48 (53.30%) |
| NYHA class | |
| I | 2 (2.20%) |
| II | 12 (13.30%) |
| III | 55 (61.11%) |
| IV | 21 (23.30%) |
| INTERMACS status | |
| 1 | 0 (0.00%) |
| 2 | 0 (0.00%) |
| 3 | 22 (24.40%) |
| 4 | 28 (31.10%) |
| 5 | 14 (15.60%) |
| 6 | 14 (15.60%) |
| 7 | 12 (13.30%) |
| Atrial fibrillation | 48 (53.33%) |
| Echocardiographic measurements | |
| LVEF, % | 25.50 [19.00-33.25] |
| End-diastolic RV basal diameter | 40.66±8.14 |
| TAPSE, mm | 15.49±3.53 |
| RV FAC, % | 33.74±9.43 |
| PAAT, ms | 90.00 [70.00-106.50] |
| Mitral regurgitation | |
| 1 | 38 (42.22%) |
| 2 | 19 (21.10%) |
| 3 | 22 (24.40%) |
| 4 | 11 (12.20%) |
| Tricuspid regurgitation | |
| 1 | 23 (29.50%) |
| 2 | 23 (29.50%) |
| 3 | 23 (29.50%) |
| 4 | 9 (11.50%) |
| Noninvasively estimated sPAP, mmHg | 45.00 [31.00-56.00] |
| TAPSE/sPAP, mm/mmHg | 0.32 [0.24-0.44] |
| RHC measurements | |
| RA, mmHg | 7.00 [4.00-10.00] |
| sPAP, mmHg | 40.00 [31.00-54.75] |
| mPAP, mmHg | 27.00 [20.00-35.00] |
| dPAP, mmHg | 20.00 [14.00-26.00] |
| PWP, mmHg | 18.00 [13.00-25.00] |
| TPG | 9.00 [5.25-12.00] |
| DPG | 1.00 [-1.00-3.00] |
| CO, L/min | 4.10 [3.50-4.58] |
| PVR, WU | 2.11 [1.46-3.33] |
| Heart rate, bpm | 71.00 [65.00-82.00] |
| Stroke volume, mL | 57.24 [47.36-66.39] |
| Pulmonary arterial compliance, mL/mmHg | 2.53 [1.67-3.54] |
| OCT measurements | |
| Inner diameter, mm | 3.34±0.46 |
| Outer diameter, mm | 3.76±0.52 |
| Wall thickness, mm | 0.21±0.05 |
| Wall thickness area, mm2 | 2.39±0.83 |
| Wall thickness index, % | 12.62±2.67 |
| Wall thickness area index, % | 26.49±5.81 |
CO, cardiac output; DPG, diastolic pulmonary gradient; INTERMACS, Interagency Registry for Mechanically Assisted Circulatory Support; FAC, fractional area change; LVEF, left ventricle ejection fraction; MR, mitral regurgitation; NYHA, New York Heart Association; OCT, optical coherence tomography; PAAT, pulmonary artery acceleration time; s/m/dPAP, systolic/medium/diastolic pulmonary artery pressure; PVR, pulmonary vascular resistance; RA, right atrium; RV, right ventricle; TAPSE, tricuspid annular plane systolic excursion; TPG, transpulmonary gradient.
Values are expressed as mean±standard deviation for parametric continuous variables and median [interquartile range] for nonparametric variables.
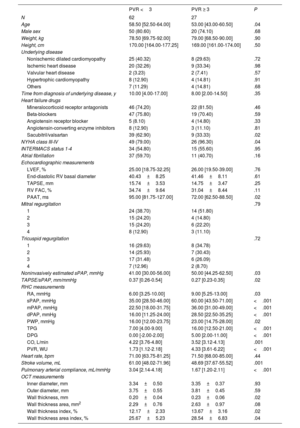
INTERMACS status was not associated with pulmonary vascular resistances or morphological assessment (table 2 and table 3), whereas daily severe symptoms assessed by the NYHA classification were linked to higher pulmonary vascular resistances (table 2).
Differences in pulmonary vascular resistances.
| PVR <3 | PVR ≥ 3 | P | |
|---|---|---|---|
| N | 62 | 27 | |
| Age | 58.50 [52.50-64.00] | 53.00 [43.00-60.50] | .04 |
| Male sex | 50 (80.60) | 20 (74.10) | .68 |
| Weight, kg | 78.50 [69.75-92.00] | 79.00 [68.50-90.00] | .90 |
| Height, cm | 170.00 [164.00-177.25] | 169.00 [161.00-174.00] | .50 |
| Underlying disease | |||
| Nonischemic dilated cardiomyopathy | 25 (40.32) | 8 (29.63) | .72 |
| Ischemic heart disease | 20 (32.26) | 9 (33.34) | .98 |
| Valvular heart disease | 2 (3.23) | 2 (7.41) | .57 |
| Hypertrophic cardiomyopathy | 8 (12.90) | 4 (14.81) | .91 |
| Others | 7 (11.29) | 4 (14.81) | .68 |
| Time from diagnosis of underlying disease, y | 10.00 [4.00-17.00] | 8.00 [2.00-14.50] | .35 |
| Heart failure drugs | |||
| Mineralocorticoid receptor antagonists | 46 (74.20) | 22 (81.50) | .46 |
| Beta-blockers | 47 (75.80) | 19 (70.40) | .59 |
| Angiotensin receptor blocker | 5 (8.10) | 4 (14.80) | .33 |
| Angiotensin-converting enzyme inhibitors | 8 (12.90) | 3 (11.10) | .81 |
| Sacubitril/valsartan | 39 (62.90) | 9 (33.33) | .02 |
| NYHA class III-IV | 49 (79.00) | 26 (96.30) | .04 |
| INTERMACS status 1-4 | 34 (54.80) | 15 (55.60) | .95 |
| Atrial fibrillation | 37 (59.70) | 11 (40.70) | .16 |
| Echocardiographic measurements | |||
| LVEF, % | 25.00 [18.75-32.25] | 26.00 [19.50-39.00] | .76 |
| End-diastolic RV basal diameter | 40.43±8.25 | 41.46±8.11 | .61 |
| TAPSE, mm | 15.74±3.53 | 14.75±3.47 | .25 |
| RV FAC, % | 34.74±9.64 | 31.04±8.44 | .11 |
| PAAT, ms | 95.00 [81.75-127.00] | 72.00 [62.50-88.50] | .02 |
| Mitral regurgitation | .79 | ||
| 1 | 24 (38.70) | 14 (51.80) | |
| 2 | 15 (24.20) | 4 (14.80) | |
| 3 | 15 (24.20) | 6 (22.20) | |
| 4 | 8 (12.90) | 3 (11.10) | |
| Tricuspid regurgitation | .72 | ||
| 1 | 16 (29.63) | 8 (34.78) | |
| 2 | 14 (25.93) | 7 (30.43) | |
| 3 | 17 (31.48) | 6 (26.09) | |
| 4 | 7 (12.96) | 2 (8.70) | |
| Noninvasively estimated sPAP, mmHg | 41.00 [30.00-56.00] | 50.00 [44.25-62.50] | .03 |
| TAPSE/sPAP, mm/mmHg | 0.37 [0.26-0.54] | 0.27 [0.23-0.35] | .02 |
| RHC measurements | |||
| RA, mmHg | 6.00 [3.25-10.00] | 9.00 [5.25-13.00] | .03 |
| sPAP, mmHg | 35.00 [28.50-46.00] | 60.00 [43.50-71.00] | <.001 |
| mPAP, mmHg | 22.50 [18.00-31.75] | 36.00 [31.00-49.00] | <.001 |
| dPAP, mmHg | 16.00 [11.25-24.00] | 28.50 [22.50-35.25] | <.001 |
| PWP, mmHg | 16.00 [12.00-23.75] | 23.00 [14.75-28.00] | .02 |
| TPG | 7.00 [4.00-9.00] | 16.00 [12.50-21.00] | <.001 |
| DPG | 0.00 [-2.00-2.00] | 5.00 [2.00-11.00] | <.001 |
| CO, L/min | 4.22 [3.76-4.80] | 3.52 [3.12-4.13] | .001 |
| PVR, WU | 1.73 [1.12-2.18] | 4.33 [3.61-6.22] | <.001 |
| Heart rate, bpm | 71.00 [63.75-81.25] | 71.50 [68.00-85.00] | .44 |
| Stroke volume, mL | 61.00 [48.02-71.96] | 48.69 [37.67-55.52] | .001 |
| Pulmonary arterial compliance, mL/mmHg | 3.04 [2.14-4.18] | 1.67 [1.20-2.11] | <.001 |
| OCT measurements | |||
| Inner diameter, mm | 3.34±0.50 | 3.35±0.37 | .93 |
| Outer diameter, mm | 3.75±0.55 | 3.81±0.45 | .59 |
| Wall thickness, mm | 0.20±0.04 | 0.23±0.06 | .02 |
| Wall thickness area, mm2 | 2.29±0.76 | 2.63±0.97 | .08 |
| Wall thickness index, % | 12.17±2.33 | 13.67±3.16 | .02 |
| Wall thickness area index, % | 25.67±5.23 | 28.54±6.83 | .04 |
CO, cardiac output; DPG, diastolic pulmonary gradient; INTERMACS, Interagency Registry for Mechanically Assisted Circulatory Support; FAC, fractional area change; LVEF, left ventricle ejection fraction; MR, mitral regurgitation; NYHA, New York Heart Association; OCT, optical coherence tomography; PAAT, pulmonary artery acceleration time; s/m/dPAP, systolic/medium/diastolic pulmonary artery pressure; PVR, pulmonary vascular resistance; RA, right atrium; RV, right ventricle; TAPSE, tricuspid annular plane systolic excursion; TPG, transpulmonary gradient.
Values are expressed mean±standard deviation for parametric continuous variables and median [interquartile range] for nonparametric variables. Fibrosis is defined as wall thickness> 0.25mm assessed by OCT. Of note, it was not possible to obtain the cardiac output of 1 patient and consequently her PVR value is missing.
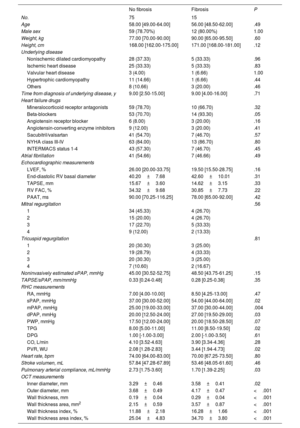
Differences in the presence or absence of fibrosis thickening measured by OCT.
| No fibrosis | Fibrosis | P | |
|---|---|---|---|
| No. | 75 | 15 | |
| Age | 58.00 [49.00-64.00] | 56.00 [48.50-62.00] | .49 |
| Male sex | 59 (78.70%) | 12 (80.00%) | 1.00 |
| Weight, kg | 77.00 [70.00-90.00] | 90.00 [65.00-95.50] | .60 |
| Height, cm | 168.00 [162.00-175.00] | 171.00 [168.00-181.00] | .12 |
| Underlying disease | |||
| Nonischemic dilated cardiomyopathy | 28 (37.33) | 5 (33.33) | .96 |
| Ischemic heart disease | 25 (33.33) | 5 (33.33) | .83 |
| Valvular heart disease | 3 (4.00) | 1 (6.66) | 1.00 |
| Hypertrophic cardiomyopathy | 11 (14.66) | 1 (6.66) | .44 |
| Others | 8 (10.66) | 3 (20.00) | .46 |
| Time from diagnosis of underlying disease, y | 9.00 [2.50-15.00] | 9.00 [4.00-16.00] | .71 |
| Heart failure drugs | |||
| Mineralocorticoid receptor antagonists | 59 (78.70) | 10 (66.70) | .32 |
| Beta-blockers | 53 (70.70) | 14 (93.30) | .05 |
| Angiotensin receptor blocker | 6 (8.00) | 3 (20.00) | .16 |
| Angiotensin-converting enzyme inhibitors | 9 (12.00) | 3 (20.00) | .41 |
| Sacubitril/valsartan | 41 (54.70) | 7 (46.70) | .57 |
| NYHA class III-IV | 63 (84.00) | 13 (86.70) | .80 |
| INTERMACS status 1-4 | 43 (57.30) | 7 (46.70) | .45 |
| Atrial fibrillation | 41 (54.66) | 7 (46.66) | .49 |
| Echocardiographic measurements | |||
| LVEF, % | 26.00 [20.00-33.75] | 19.50 [15.50-28.75] | .16 |
| End-diastolic RV basal diameter | 40.20±7.68 | 42.60±10.01 | .31 |
| TAPSE, mm | 15.67±3.60 | 14.62±3.15 | .33 |
| RV FAC, % | 34.32±9.68 | 30.85±7.73 | .22 |
| PAAT, ms | 90.00 [70.25-116.25] | 78.00 [65.00-92.00] | .42 |
| Mitral regurgitation | .56 | ||
| 1 | 34 (45.33) | 4 (26.70) | |
| 2 | 15 (20.00) | 4 (26.70) | |
| 3 | 17 (22.70) | 5 (33.33) | |
| 4 | 9 (12.00) | 2 (13.33) | |
| Tricuspid regurgitation | .81 | ||
| 1 | 20 (30.30) | 3 (25.00) | |
| 2 | 19 (28.79) | 4 (33.33) | |
| 3 | 20 (30.30) | 3 (25.00) | |
| 4 | 7 (10.60) | 2 (16.67) | |
| Noninvasively estimated sPAP, mmHg | 45.00 [30.52-52.75] | 48.50 [43.75-61.25] | .15 |
| TAPSE/sPAP, mm/mmHg | 0.33 [0.24-0.48] | 0.28 [0.25-0.38] | .35 |
| RHC measurements | |||
| RA, mmHg | 7.00 [4.00-10.00] | 8.50 [4.25-13.00] | .47 |
| sPAP, mmHg | 37.00 [30.00-52.00] | 54.00 [44.00-64.00] | .02 |
| mPAP, mmHg | 25.00 [19.00-33.00] | 37.00 [30.00-44.00] | .004 |
| dPAP, mmHg | 20.00 [12.50-24.00] | 27.00 [19.50-29.00] | .03 |
| PWP, mmHg | 17.50 [12.00-24.00] | 20.00 [18.50-28.50] | .07 |
| TPG | 8.00 [5.00-11.00] | 11.00 [8.50-19.50] | .02 |
| DPG | 1.00 [-1.00-3.00] | 2.00 [-1.00-3.50] | .61 |
| CO, L/min | 4.10 [3.52-4.63] | 3.90 [3.34-4.36] | .28 |
| PVR, WU | 2.08 [1.28-2.83] | 3.44 [1.94-4.73] | .02 |
| Heart rate, bpm | 74.00 [64.00-83.00] | 70.00 [67.25-73.50] | .80 |
| Stroke volumen, mL | 57.84 [47.28-67.89] | 53.46 [48.05-61.60] | .46 |
| Pulmonary arterial compliance, mL/mmHg | 2.73 [1.75-3.60] | 1.70 [1.39-2.25] | .03 |
| OCT measurements | |||
| Inner diameter, mm | 3.29±0.46 | 3.58±0.41 | .02 |
| Outer diameter, mm | 3.68±0.49 | 4.17±0.47 | <.001 |
| Wall thickness, mm | 0.19±0.04 | 0.29±0.04 | <.001 |
| Wall thickness area, mm2 | 2.15±0.59 | 3.57±0.87 | <.001 |
| Wall thickness index, % | 11.88±2.18 | 16.28±1.66 | <.001 |
| Wall thickness area index, % | 25.04±4.83 | 34.70±3.80 | <.001 |
CO, cardiac output; DPG, diastolic pulmonary gradient; INTERMACS, Interagency Registry for Mechanically Assisted Circulatory Support; FAC, fractional area change; LVEF, left ventricle ejection fraction; MR, mitral regurgitation; NYHA, New York Heart Association; OCT, optical coherence tomography; PAAT, pulmonary artery acceleration time; s/m/dPAP, systolic/medium/diastolic pulmonary artery pressure; PVR, pulmonary vascular resistance; RA, right atrium; RV, right ventricle; TAPSE, tricuspid annular plane systolic excursion; TPG, transpulmonary gradient.
Values are expressed as mean±standard deviation for parametric continuous variables and median [interquartile range] for nonparametric variables.
There was a good correlation between the OCT measurements obtained by the 2 operators. The mean difference was not statistically relevant for any variable (WT, WT index, WT area and iWTA) ().
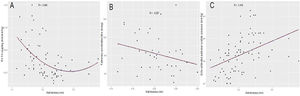
WT was significantly associated with a higher pulmonary artery pressure, transpulmonary gradient, pulmonary arterial compliance, and pulmonary vascular resistance (figure 2). In addition, it also correlated with echocardiographic parameters such as pulmonary artery acceleration time, pulmonary systolic pressure, and right ventricular-pulmonary arterial coupling (figure 3 and figure 4). However, there was no association with the severity of tricuspid regurgitation or any measurement of right ventricle systolic function.


Pearson correlation between wall thickness and echocardiographic findings of pulmonary hypertension and right ventricular function. A: right ventricular-pulmonary arterial coupling measured by the ratio of tricuspid annular plane systolic excursion to noninvasively estimated pulmonary artery systolic pressure; the correlation is nonlinear, and the best fit is polynomic. B: pulmonary artery acceleration time. C: noninvasively estimated pulmonary artery systolic pressure.

Patients with a WT over 0.25mm had a higher mean pulmonary pressure, transpulmonary gradient and pulmonary vascular resistance than those in the lower percentiles (table 3). These findings were independent of the underlying disease and time from diagnosis, the presence of atrial fibrillation, or mitral regurgitation. Regarding the use of neurohormonal blockade drugs, patients receiving sacubitril-valsartan had significantly lower pulmonary vascular resistance but similar WT (table 2). Beta-blockers were associated with thicker vessels.
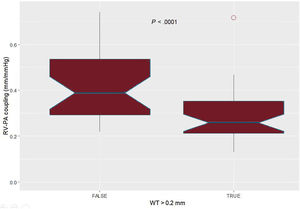
Regarding right ventricular-pulmonary arterial coupling, the best cutoff value for WT was 0.20mm; patients with WT over this value showed significantly lower right ventricle-pulmonary artery coupling (figure 4). Patients with a pulmonary vascular resistance over 3 Wood Units had higher indexed measurements of WT (table 2). WT area index was also significantly associated with pulmonary hemodynamics (). shows the receiver-operator curves of WT and iWTA regarding the prediction of high pulmonary vascular resistance.
DISCUSSIONThe OCTOPUS-CHF study shows that OCT of pulmonary arteries is feasible in patients with advanced heart failure. In addition, intimal thickness is associated with classic hemodynamic measurements of PH. OCT has been associated with pulmonary vascular resistances in other forms of pulmonary hypertension, but information on PH-LHD is scarce. A small study in patients with mitral valve disease represents the only previous data in this setting so that the OCTOPUS-CHF study is the largest sample analyzed to date.
PH can be produced by any valvular, coronary, or myocardial disease that increases filling pressures. It affects most patients with heart failure and its severity is among the stronger prognosis predictors.4 However, specific PH-LHD therapies are lacking.4,21 Although right heart catheterization is still the gold standard for pulmonary vascular remodeling assessment, it has several drawbacks. Firstly, it has technical limitations and waveform analysis variability. In addition, the current steady-flow view of PH is simplistic since it does not consider relevant determinants such as the strong influence of load conditions (volume status, heart rate, and the treatment received),4 ventriculoarterial coupling, left atrial stiffness, vascular compliance, or upstream and downstream wave transmission.22–24 Diastolic gradient seemed promising but failed to demonstrate usefulness, whereas the transpulmonary gradient is even more influenced by left preload.25,26 Thus, pulmonary vascular resistance remains the cornerstone in the evaluation of PH-LHD since it has consistently proven to have linear correlation with mortality, even though it is also highly dependent on pulmonary wedge pressure.8,10,27 Last, there is uncertainty regarding the prognostic value of hemodynamic data together with its suitability to guide heart failure therapy.7–10,12,28
The mechanisms producing PH-LHD remain poorly understood since most knowledge comes from the field of primary PH. There are probably different phenotypes of PH-LHD, and it is not clear why patients with the same left-heart disease display such a wide range of PH-LHD severity. It is postulated that pressure overload may induce endothelial dysfunction, activation of inflammatory pathways, and a proliferative response of the extracellular matrix through a complex signaling interaction between post- and precapillary beds in a subset of genetically predisposed patients.29,30 Current data argue against the classic paradigm that pulmonary vascular disease protects from left-heart overload. In fact, not only alveolar-capillary interface remodeling, lung diffusion impairment, uncoupling of right ventricle-pulmonary artery, and ventilation-perfusion matching alterations become more severely affected but also lung congestion is greater in left-heart disease with combined pulmonary hypertension.31 Recent morphological studies found a larger increase in intimal thickening, muscular hypertrophy, and fibrosis in pulmonary veins than in arterioles in PH-LHD. These findings challenge the classic hemodynamic compartmentation of the vascular tree.7 A deeper understanding of these biological processes might serve as future therapeutic targets.
For all these reasons, morphological parameters might provide valuable additional information. However, morphological assessment was limited to pulmonary biopsy until the recent rise of intravascular imaging techniques. Histopathological findings in congestive pulmonary vasculopathy have been mainly described in the setting of rheumatic mitral valve disease.32–35 Greater pulmonary artery pressure seems to be associated with fibrosis, intimal thickness, and medial hypertrophy of the pulmonary tree in PH-LHD.7,36 In the last few years, there has been increasing interest for “in vivo” evaluation of pulmonary vascular remodeling with different intravascular imaging techniques, among which OCT seems to be the most promising. OCT is a near-infrared light source-based imaging technique with a resolution of 10 to 20mm, which is particularly useful for tissue characterization.37 In previous OCT studies, the pulmonary arterial vessel wall has been described as a homogeneous, single layer, signal-rich structure, without a clear distinction between intima and media layers.14,38 Thickening of the wall by a structure with high reflectivity and low attenuation corresponds to fibrosis in pathological studies.38 Therefore, the distance between the luminal border of the vessel wall and the vessel wall-lung tissue interface defines the WT in pulmonary OCT studies with the same calculations described in the present project. A study comparing pulmonary OCT imaging of 79 patients with different forms of PH and 35 non-PH participants reported an association between the severity of intimal fibrosis and right ventricular afterload. Additionally, the authors were able to identify not only early stages of intimal thickening in borderline PH patients but also reverse remodeling after vasodilator therapy in a significant proportion of those with primary PH, suggesting the high sensitivity of OCT for early diagnosis.17 Regarding primary PH, intimal fibrosis predicts clinical outcomes and correlates with histological findings.38 OCT is emerging as a diagnostic tool in different forms of PH, such as chronic thromboembolic PH where it has successfully demonstrated the presence of thrombi and flaps, and guided angioplasty.14,16,39 Moreover, a larger study of 64 patients with primary PH and 23 with chronic thromboembolic PH also proved good correlation between intimal thickness obtained by OCT and hemodynamic data.40
Nevertheless, there is still little information on OCT in PH-LHD to date. The only relevant evidence available about pulmonary OCT in PH-LHD comes from a sample of 20 patients with mitral valve disease whose WT index was significantly associated with pulmonary vascular resistance, transpulmonary gradient and pulmonary artery pressure.41
This association between OCT assessment and hemodynamic data was also reproduced in our study. We found a significant correlation between OCT assessment of vascular remodeling and functional measures, such as pulmonary pressures and resistances. However, agreement for this association was not strong. Indeed, an area under the curve of 0.622 for WT to predict high pulmonary vascular resistance can be considered poor. This is not necessarily unexpected, as it is widely known that hemodynamic data do not entirely explain structural changes. Firstly, many patients may have elevated pressures and pulmonary vascular resistances that quickly normalize after heart transplant36 or left ventricle unloading through mechanical support, suggesting the absence of significant pulmonary vascular remodeling.6,42 Secondly, the correlation between morphological and functional assessment in our study was noteworthy, despite the heterogeneity present in the sample, with a broad range of underlying diseases and load conditions. Furthermore, it is difficult to demonstrate a strong correlation between morphological and functional data since pulmonary vascular resistance was normal or just slightly increased in most of our patients. This was because our hemodynamic results were used to list patients for heart transplant.
Regarding clinical data, NYHA class was not associated with WT, nor was the INTERMACS status. Furthermore, although some subset of underlying myocardiopathies, long-term disease, the presence of atrial fibrillation or mitral regurgitation might be associated with pulmonary vascular remodeling, we were unable to prove these associations in our study. With respect to heart failure drugs, neurohormonal blocker tolerance may select low-risk patients. Therefore, interpretation of our results should be cautious. In addition, this is the first study that evaluates the relationship between pulmonary vascular remodeling measured by OCT and noninvasive assessment of PH. Both pulmonary artery systolic pressure and pulmonary acceleration time, widely known as the best echocardiographic parameters for estimating PH,19,43 were significantly correlated with OCT results. On the other hand, the lack of association with right ventricle systolic function measurements and the severity of tricuspid regurgitation, are not surprising given the broad spectrum of underlying diseases affecting the right-side irrespective of PH-LHD development. In addition, in our study, right ventricle-pulmonary artery coupling, represented through the ratio of tricuspid annular plane systolic excursion to noninvasively estimated pulmonary systolic pressure, displayed a significant nonlinear correlation with WT. Recent studies have found that this parameter reflects the adequacy of right ventricle adaptation to afterload and it is an early and independent predictor of outcomes in patients with PH and advanced heart failure.44–46
LimitationsTo the best of our knowledge, this is the largest sample of patients with PH-LHD analyzed with OCT to date. However, our study has some limitations. First, this is an observational study with a small sample of patients but whose results serve as an stimulus for further investigation. Second, OCT is an expensive and time-consuming procedure that requires iodinated contrast, but it was feasible and safely performed in most patients. Although the patients were in advanced heart failure, the procedure was well tolerated without worsening of renal function and there was just one case of pulmonary edema. Third, measurements were taken with a semiautomatic method showing high concordance between 2 operators. Nonetheless, its reproducibility requires external validation. Furthermore, we demonstrated an association with right ventriculoarterial coupling and invasive measurements in the categorical analysis, although using different WT cutoffs, since the best cutoff point is yet to be determined. In addition, pulmonary arteries WT represents an incomplete approach to define the underlying histological process since pulmonary vascular disease in PH-LHD predominates in the venous bed.7 However, pulmonary venous OCT was not performed for safety reasons. Interestingly, the feasibility of pulmonary OCT in the arterial distal vasculature (vessel diameter <2mm) has already been demonstrated in a study of PH secondary to systemic sclerosis.47 Last, the correlation between functional and morphological data is statistically relevant but the agreement is weak. It is not surprising that hemodynamics do not fully explain pulmonary vascular disease. However, it is also probably determined by the heterogeneity of underlying diseases together with the mildly impaired pulmonary vascular resistances in the sample. A reevaluation of hemodynamics in the subset of patients with greater load-dependency could have provided more accurate information, eg, a new right heart catheterization after vasodilator testing, inotropic optimization, heart transplant or left-sided unloading. Nonetheless, OCT seems promising in the workup of PH-LHD since it adds morphological information to the classic scope of vascular remodeling diagnosis. Furthermore, beyond the correlation with right heart catheterization parameters or histological findings, the OCTOPUS-CHF study follow-up results are expected to bring light to the prognostic value of this technique.
CONCLUSIONSQuantification of pulmonary artery fibrosis is feasible and can be safely performed with OCT. It has the potential to emerge as a new diagnostic tool for PH-LHD as it is significantly correlated with hemodynamic parameters, providing direct morphological assessment of vascular remodeling.
The health burden of heart failure is of major concern worldwide. Pulmonary hypertension secondary to left heart disease is very common in this setting and has a poor prognosis. However, there is still an unmet need for a deeper understanding of pulmonary hemodynamics and the development of targeted therapy. Right heart catheterization remains the gold standard to measure pulmonary hypertension, but it has several drawbacks that limit its reliability and clinical implications.
WHAT DOES THIS STUDY ADD?Morphological assessment of pulmonary vascular remodeling with OCT is feasible and safe in patients with advanced heart failure. This technique seems to be promising as a new diagnostic tool for pulmonary hypertension secondary to left heart disease and further information is warranted.
This work was funded by the Instituto de Salud Carlos III (PI18/00254) and cofounded by the European Regional Development Fund, through the CIBERCV (CB16/11/00502).
AUTHORS’ CONTRIBUTIONSConception and design of the study; patient recruitment and data collection: all authors. OCT measurements: J. Martínez-Solano and E. Gutiérrez-Ibañes. Presentation to the ethics committee: E. Gutiérrez-Ibañes and M. Martínez-Sellés. Article drafting: J. Martínez-Solano, C. Ortiz-Bautista, E. Gutiérrez-Ibañes and M. Martínez-Sellés. Statistical analysis: J. Martínez-Solano and E. Gutiérrez-Ibañes.
CONFLICTS OF INTERESTNone declared.
We are grateful to Pablo Martínez-Legazpi and Javier Bermejo for their advice and assistance.
Supplementary data associated with this article can be found in the online version, at https://doi.org/10.1016/j.rec.2022.09.005