
The Healthy Heart Score (HHS) is a lifestyle-based equation for predicting cardiovascular disease (CVD) risk and may serve as a tool in primordial prevention. However, its performance outside North American populations is unknown. This study assessed the performance of the HHS for estimating CVD mortality in the adult population of Spain.
MethodsWe analyzed data from the ENRICA cohort, comprising 10 228 participants free of chronic disease and representative of the Spanish population aged ≥ 18-years, who were recruited from 2008 to 2010 and were followed up to 2020. The HHS includes body mass index, alcohol, physical activity, smoking, and a 5-component dietary score. The HHS was calculated at baseline using the sex-specific beta coefficients from the original development cohorts. Model discrimination was assessed using the Harrell c-statistic and Gonen-Heller c-statistic for survival data, and calibration was evaluated through calibration plots.
ResultsAfter a median follow-up of 11.8 years, 110 CVD deaths were ascertained. The discrimination of the HHS was similar for women (Harrell c, 0.91; 95%CI, 0.87-0.95; Gonen-Heller-c, 0.85; 95%CI, 0.83-0.88) and men (Harrell c, 0.91; 95%CI, 0.88-0.94; Gonen-Heller c: 0.85; 95%CI, 0.83-0.88). After recalibration by the sex-specific baseline survival function, the calibration became optimal for: a) all deciles of predicted CVD risk except the highest decile, where HHS underestimated the risk, and b) all age groups except 70 years and older, where there was an underestimation.
ConclusionsIn this Spanish cohort, the HHS showed good discrimination and calibration for predicting CVD death. The performance of HHS in other European populations and its implementation in the clinical setting warrants further investigation.
Keywords
Cardiovascular disease (CVD) is the leading cause of disease burden worldwide, impacting on millions of people's lives daily and representing about one third of total deaths.1,2 This remains evident despite the decline in CVD mortality over the last decades in many countries, due to improved primary prevention and management.3 The latter usually means prescribing drug therapy; however, this is costly, has well recognized adverse effects, and does not completely eliminate the detrimental effects of having developed biological risk factors.4 Moreover, a certain deceleration in CVD decline is being observed in a number of regions, which may be partially due to the obesity epidemic.3 Given that obesity mostly results from unhealthy behaviors, and the long-term effectiveness of treatment for obesity is unclear, progress in CVD control requires a greater focus on primordial prevention through lifestyle intervention.
There are many tools for estimating CVD risk based on risk factors (eg, smoking, blood pressure, and blood lipids), including the Framingham, FRESCO, GLOBORISK, SCORE, or Pooled Cohort equations.5–12 The European Society of Cardiology, the American Heart Association, and the American College of Cardiology support this type of tool in their clinical practice guidelines. However, atherosclerosis, a precursor to CVD, develops over decades,13 and biological risk factors in mid-adulthood are associated with a substantial short-term risk of CVD.14,15 By contrast, risk models that include only lifestyle behaviors are scarce, focus on the long-term CVD risk, and are better suited for primordial CVD prevention. The Healthy Heart Score (HHS) is a tool for predicting the 20-year risk of CVD based on 9 modifiable behavioral factors: smoking, alcohol intake, body mass index (BMI), physical activity, and 5 dietary components. This tool has been derived and validated in 2 large cohorts of health professionals (Nurses’ Health Study [NHS], and Health Professionals Follow-up Study [HPFS]) showing good discrimination, fit, and calibration.16 Additionally, the HHS showed moderately good performance in another external younger population, especially among individuals without clinical risk factors and white vs blacks17 but it did not seem to improve prediction of mid-life CVD events beyond what is obtained by age alone in African American individuals.18
For the HHS to be disseminated and used, it is important to show its validity in populations beyond those in North America. Thus, the aim of this study was to assess the performance of the HHS for estimating CVD mortality in the adult population of Spain; this is of interest because, unlike the US population, Spain and other Mediterranean countries have very low CVD mortality. Indeed, the age-standardized CVD mortality in 2019 in Spain was 107/100 000 habitants vs 157/100 000 in the United States.19
METHODSStudy design and participantsData were collected from the participants in the ENRICA study, a prospective cohort designed to study CVD risk factors.20 The study comprises 13 105 individuals representative of the noninstitutionalized Spanish population aged 18 years or older. Details on study design and data collection have been reported elsewhere.20 Briefly, the sample was selected using stratified cluster sampling.20 Baseline data collection was carried out between June 2008 and October 2010 in 3 sequential steps.20 First, trained personnel conducted a telephone interview on sociodemographic factors, CVD risk factors, health behaviors, and morbidity. Second, trained nurses obtained blood and urine samples in a first home visit; and finally, a physical examination and a face-to-face diet history were performed in a second home visit.20
Healthy Heart ScoreThe HHS was developed to predict 20-year risk of CVD separately for women and men.16 This tool was the most parsimonious, rather than comprehensive, model for predicting CVD risk and the 9 components selected were: smoking status, BMI, physical activity, intake of cereal fiber, fruit and vegetables, red and processed meat, nuts, sugar-sweetened beverages, and alcohol consumption (). All data required deriving the original sex-specific beta coefficients in ENRICA, which were measured at baseline (2008-2010). The dietary components of HHS were estimated from food consumption over the preceding year obtained with a validated electronic diet history,21 where participants could report up to 861 foods and recipes commonly consumed in Spain. Portion sizes were estimated with the help of 127 digitized photographs and household measures. Leisure-time physical activity was assessed with the Spanish-validated version of the EPIC-cohort questionnaire,22 which we used to calculate moderate-to-vigorous physical activity (3 to 6 metabolic equivalent tasks). BMI was calculated as weight (in kilograms) divided by height (in meters) squared. Grams of alcohol consumed were estimated from the diet history using standard food composition tables.21 Self-reported information on age, sex, and smoking status was collected during the telephone interview. Finally, a higher overall HHS indicated higher risk for CVD.
Ascertainment of cardiovascular mortalityThe main outcome of this study was CVD death; a secondary outcome was all-cause death. Vital status and date of death were retrieved from the National Death Index of Spain, while cause of death was obtained from death certificates collected by the National Institute of Statistics of Spain23; the causes of death were coded by trained nosologists according to the International Classification of Diseases, 10th revision.24 We considered deaths coded from I00 to I99 as deaths from CVD. Matching to the databases was made by investigators blinded to the predictor data using combinations of first and last names, birthdates, and national identity card numbers.25 Length of follow-up was time between the telephone phone interview and date of death or administrative censoring (December 31st, 2020, for CVD mortality; January 31st, 2022 for all-cause mortality), whichever came first.
Statistical methodsWe followed a complete-case analysis approach using all available observations with complete data on outcomes and predictors. Thus, of the 13 105 participants, those with missing data on smoking status (n = 43), BMI (n=952), alcohol consumption (n=111) or energy intake (n=58) were sequentially excluded, leaving a first analytical sample (hereinafter overall cohort) of 11 941 participants (). A second analytical sample was obtained by additionally excluding those with chronic conditions at baseline (type 2 diabetes [n=790], CVD [n=192], lung disease [n=642], cancer [n=89]), leaving 10 228 participants (4794 men, 5434 women) (). Participant characteristics were summarized using descriptive statistics including the mean± standard deviation (SD) for continuous variables, and absolute and relative frequencies for categorical variables.
The performance of the HHS in ENRICA participants to predict 12-year CVD mortality was estimated using sex-specific beta-coefficients (), and assuming half of the baseline hazards, derived within the NHS (women) and HPFS (men), due to the difference in follow-up (12 years vs 20 years). Evaluation of performance was based on the discrimination and calibration of the model. Model discrimination was assessed using the Harrell c-statistic for survival data and its 95% confidence interval, with values between 0 and 1 (values closer to 1 indicated better discrimination). We also calculated the Gonen-Heller c-statistic with its 95% confidence interval to account for possible bias due to the censoring pattern, as has been previously suggested.26 Model calibration was assessed using calibration slopes and visualized through calibration plots representing the average predicted risk against the observed risk in deciles. Since the HHS model was developed for a longer-term risk (20 years), for CVD incidence, and in a population with baseline hazard different to that in Spain, we considered the recalibration based on the baseline hazard risk of our population without modifying the specific beta coefficients (). We estimated model calibration and discrimination of the calibrated HHS using the same procedures. Finally, we evaluated the calibration performance of the HHS and HHS-cardiovascular disease model (CVDm) by age groups.
We conducted several sensitivity analyses: we evaluated the calibration performance of the HHS and HHS-CVDm by categories of risk defined by the European Society of Cardiology Guidelines.27 Because the baseline CVD-free survival at 12 years in the original HHS was unknown, we estimated model performance for several scenarios, assuming that a) all events occurred in the first 12-years of follow-up (ie, the same baseline CVD-free survival at 12 years as at 20 years [0.966 for women and 0.964 for men]), and b) all events occurred beyond 12 years of follow-up (ie, baseline CVD-free survival at 12 years was close to 1). Finally, we repeated all described procedures to evaluate the predictive performance of the HHS on all-cause mortality.
Analyses were performed using Stata version 16.0 (Stata-Corp LLC, College Station, United States). All P-values were considered statistically significant at P <.05 (2-sided).
EthicsThe study was approved by the Clinical Research Ethics Committee of La Paz University Hospital in Madrid (Trial registration: NCT02804672), and study participants gave written informed consent.
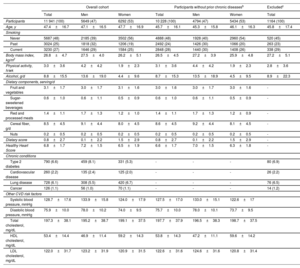
RESULTSBaseline characteristicsBaseline characteristics of the 11 941 overall participants, the 10 228 participants without chronic diseases, and the excluded participants are presented in table 1. The mean age at baseline was 47.1±16.5 years for men and 47.7±16.9 years for women in the overall cohort and was 45.3±15.8 years and 46.1±16.3 years, respectively, in the participants without chronic diseases. In both analytic samples, ∼53% were women. Overall, the participants without chronic diseases were younger and had a slightly lower HHS (better) than the overall cohort. No major significant differences were found between included and excluded participants. Compared with the original cohorts in which the HHS was developed, our participants were younger, with higher BMI, higher consumption of cereal fiber, and lower consumption of fruits and vegetables (). In addition, men were more physically active and more likely to be current smokers. The main baseline differences between other cohorts where the HHS has been validated (CARDIA17 and the Jackson Heart Study18) and the ENRICA cohort are presented in .
Baseline characteristics of ENRICA cohort participants by sexa
| Overall cohort | Participants without prior chronic diseasesb | Excludedc | |||||
|---|---|---|---|---|---|---|---|
| Total | Men | Women | Total | Men | Women | Total | |
| Participants | 11 941 (100) | 5649 (47) | 6292 (53) | 10 228 (100) | 4794 (47) | 5434 (53) | 1164 (100) |
| Age, y | 47.4±16.7 | 47.1±16.5 | 47.7±16.9 | 45.7±16.1 | 45.3±15.8 | 46.1±16.3 | 45.8±17.4 |
| Smoking | |||||||
| Never | 5687 (48) | 2185 (39) | 3502 (56) | 4888 (48) | 1928 (40) | 2960 (54) | 520 (45) |
| Past | 3024 (25) | 1818 (32) | 1206 (19) | 2492 (24) | 1426 (30) | 1066 (20) | 263 (23) |
| Current | 3230 (27) | 1646 (29) | 1584 (25) | 2848 (28) | 1440 (30) | 1408 (26) | 338 (29) |
| Body mass index, kg/m2 | 26.8±4.7 | 27.5±4.0 | 26.2±5.1 | 26.5±4.5 | 27.2±3.9 | 25.9±4.8 | 27.2±5.1 |
| Physical activity, h/wk | 3.0±3.6 | 4.2±4.2 | 1.9±2.3 | 3.1±3.6 | 4.4±4.2 | 1.9±2.3 | 2.8±3.6 |
| Alcohol, g/d | 8.8±15.5 | 13.6±19.0 | 4.4±9.6 | 8.7±15.3 | 13.5±18.9 | 4.5±9.5 | 8.9±22.3 |
| Dietary components, serving/d | |||||||
| Fruit and vegetables | 3.1±1.7 | 3.0±1.7 | 3.1±1.6 | 3.0±1.6 | 3.0±1.7 | 3.0±1.6 | - |
| Sugar-sweetened beverages | 0.6±1.0 | 0.6±1.1 | 0.5±0.9 | 0.6±1.0 | 0.6±1.1 | 0.5±0.9 | - |
| Red and processed meats | 1.4±1.1 | 1.7±1.3 | 1.2±1.0 | 1.4±1.1 | 1.7±1.3 | 1.2±0.9 | - |
| Cereal fiber, g/d | 8.5±4.5 | 9.1±4.4 | 8.0±4.5 | 8.6±4.5 | 9.2±4.4 | 8.1±4.5 | - |
| Nuts | 0.2±0.5 | 0.2±0.5 | 0.2±0.5 | 0.2±0.5 | 0.2±0.5 | 0.2±0.5 | - |
| Dietary score | 0.8±2.7 | 0.1±2.2 | 1.5±2.9 | 0.8±2.7 | 0.1±2.2 | 1.5±2.9 | - |
| Healthy Heart Score | 6.8±1.7 | 7.2±1.5 | 6.5±1.9 | 6.6±1.7 | 7.0±1.5 | 6.3±1.8 | - |
| Chronic conditions | |||||||
| Type 2 diabetes | 790 (6.6) | 459 (8.1) | 331 (5.3) | - | - | - | 80 (6.9) |
| Cardiovascular disease | 260 (2.2) | 135 (2.4) | 125 (2.0) | - | - | - | 26 (2.2) |
| Lung disease | 728 (6.1) | 308 (5.5) | 420 (6.7) | - | - | - | 76 (6.5) |
| Cancer | 126 (1.1) | 56 (1.0) | 70 (1.1) | - | - | - | 14 (1.2) |
| Other CVD risk factors | |||||||
| Systolic blood pressure, mmHg | 128.7±17.6 | 133.9±15.8 | 124.0±17.9 | 127.5±17.0 | 133.0±15.1 | 122.6±17 | |
| Diastolic blood pressure, mmHg | 75.9±10.0 | 78.0±10.2 | 74.0±9.5 | 75.7±10.0 | 78.0±10.1 | 73.7±9.5 | |
| Total cholesterol, mg/dL | 197.3±38.1 | 195.2±38.7 | 199.1±37.5 | 197.7±37.9 | 196.5±38.3 | 198.7±37.5 | |
| HDL cholesterol, mg/dL | 53.4±14.4 | 46.9±11.4 | 59.2±14.3 | 53.8±14.3 | 47.2±11.1 | 59.6±14.2 | |
| LDL cholesterol, mg/dL | 122.0±31.7 | 123.2±31.9 | 120.9±31.5 | 122.6±31.6 | 124.6±31.6 | 120.8±31.4 | |
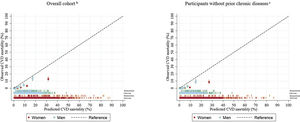
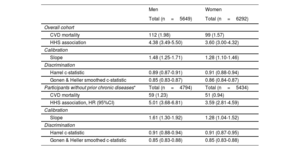
After a median follow-up of 11.8 [range 0.9-13.4] years, there were 211 CVD deaths (112 men, 99 women). In those without chronic diseases, 110 CVD deaths (59 men, 51 women) were ascertained. The discrimination of the HHS was similar for women (Harrell c-statistic, 0.91; 95%CI, 0.88-0.94) and men (Harrell c-statistic, 0.89; 95%CI, 0.87-0.91) in the overall cohort; however, discrimination was the same for men and women without chronic diseases (Harrell c-statistic, 0.91; 95%CI, 0.88-0.94 for men, and Harrell c-statistic, 0.91; 95%CI, 0.87-0.95 for women) (table 2). The Gonen-Heller c-statistic followed the same pattern but was consistently lower in all cases (Gonen-Heller c-statistic, 0.85; 95%CI, 0.83-0.88 for men, and Gonen-Heller c-statistic, 0.85; 95%CI, 0.83-0.88) for women (table 2). The original HHS had a poor calibration performance in both the overall cohort (slope, 1.48; 95%CI, 1.25-1.71 for men, and slope, 1.28 95%CI, 1.10-1.46 for women) and in those without prior chronic diseases (1.61; 95%CI, 1.30-1.92 for men, and 1.28 95%CI, 1.04-1.52 for women) (table 2). It consistently overestimated the risk of CVD mortality for men and women, particularly among the highest deciles of predicted risk (figure 1).
Performance of the HHS in CVD mortality prediction at median follow-up (12 years) in the ENRICA cohort
| Men | Women | |
|---|---|---|
| Total (n=5649) | Total (n=6292) | |
| Overall cohort | ||
| CVD mortality | 112 (1.98) | 99 (1.57) |
| HHS association | 4.38 (3.49-5.50) | 3.60 (3.00-4.32) |
| Calibration | ||
| Slope | 1.48 (1.25-1.71) | 1.28 (1.10-1.46) |
| Discrimination | ||
| Harrel c-statistic | 0.89 (0.87-0.91) | 0.91 (0.88-0.94) |
| Gonen & Heller smoothed c-statistic | 0.85 (0.83-0.87) | 0.86 (0.84-0.87) |
| Participants without prior chronic diseases* | Total (n=4794) | Total (n=5434) |
| CVD mortality | 59 (1.23) | 51 (0.94) |
| HHS association, HR (95%CI) | 5.01 (3.68-6.81) | 3.59 (2.81-4.59) |
| Calibration | ||
| Slope | 1.61 (1.30-1.92) | 1.28 (1.04-1.52) |
| Discrimination | ||
| Harrel c-statistic | 0.91 (0.88-0.94) | 0.91 (0.87-0.95) |
| Gonen & Heller smoothed c-statistic | 0.85 (0.83-0.88) | 0.85 (0.83-0.88) |
95%CI, confidence interval; CVD, cardiovascular disease; HHS, Healthy Hearth Score; HR, hazard ratio.
Unless otherwise indicated, the data are expressed as No. (%) or as c-statistic (95%CI).
 of HHS for the prediction of CVD mortality among ENRICA participants (median follow-up of 12 years) assuming the baseline survival function at 12 years in the original development cohorts is half than that at 20 yearsa. aParticipants free of type 2 diabetes, cardiovascular disease (myocardial infarction, heart failure, stroke), lung disease (asthma, chronic obstructive pulmonary disease), and cancer at baseline. bn=211 / n=11 941 (men 112/5649, women 99/6292). cn=110 / n=10 228 (men 59/4794, women 51/5434). Baseline survival function for men, 0.98184; Baseline survival function for women 0.983. 95%CI, 95% confidence interval; CVD, cardiovascular disease; CVDm, cardiovascular disease model; HHS, Healthy Hearth Score.")
Calibration plots (95%CI) of HHS for the prediction of CVD mortality among ENRICA participants (median follow-up of 12 years) assuming the baseline survival function at 12 years in the original development cohorts is half than that at 20 yearsa.
aParticipants free of type 2 diabetes, cardiovascular disease (myocardial infarction, heart failure, stroke), lung disease (asthma, chronic obstructive pulmonary disease), and cancer at baseline.
bn=211 / n=11 941 (men 112/5649, women 99/6292).
cn=110 / n=10 228 (men 59/4794, women 51/5434). Baseline survival function for men, 0.98184; Baseline survival function for women 0.983.
95%CI, 95% confidence interval; CVD, cardiovascular disease; CVDm, cardiovascular disease model; HHS, Healthy Hearth Score.
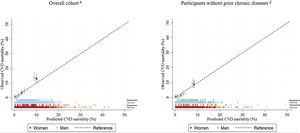
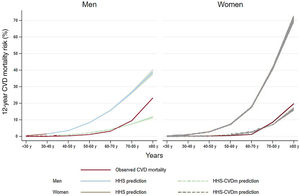
We recalibrated the HHS using our sex-specific baseline CVD survival function (HHS-CVDm) (). The HHS-CVDm calibration became optimal for all but the highest decile of predicted CVD risk of both men and women, where the calibrated HHS underestimated the risk (figure 2). Additionally, the observed and predicted risks of the HHS-CVDm were similar across all age groups except for those> 70 years where there was an underestimation, especially in women (figure 3).
 of the HHS-CVDm for the prediction of CVD mortality at median follow-up (12 years) among the overall ENRICA cohort and for a subset of participants without chronic diseasesa recalibrating by the baseline survival function of the ENRICA cohort. aParticipants free of type 2 diabetes, cardiovascular disease (myocardial infarction, heart failure, stroke), lung disease (asthma, chronic obstructive pulmonary disease), and cancer at baseline. bn=211 / N=11 941 (men 112/5649, women 99/6292). cn=110 / N=10 228 (men 59/4794, women 51/5434). Baseline survival function for men, 0.9999935; Baseline survival function for women 0.9999937. 95%CI, confidence interval; CVD, cardiovascular disease; CVDm, cardiovascular disease model; HHS, Healthy Hearth Score.")
Calibration plots (95%CI) of the HHS-CVDm for the prediction of CVD mortality at median follow-up (12 years) among the overall ENRICA cohort and for a subset of participants without chronic diseasesa recalibrating by the baseline survival function of the ENRICA cohort.
aParticipants free of type 2 diabetes, cardiovascular disease (myocardial infarction, heart failure, stroke), lung disease (asthma, chronic obstructive pulmonary disease), and cancer at baseline.
bn=211 / N=11 941 (men 112/5649, women 99/6292).
cn=110 / N=10 228 (men 59/4794, women 51/5434). Baseline survival function for men, 0.9999935; Baseline survival function for women 0.9999937.
95%CI, confidence interval; CVD, cardiovascular disease; CVDm, cardiovascular disease model; HHS, Healthy Hearth Score.

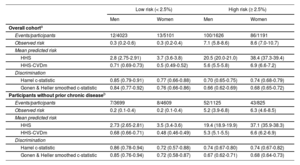
In addition, the mean predicted risks became closer to the observed risks for both risk categories (< 2.5% and ≥ 2.5%) when using the HHS-CVDm (table 3).
Calibration performance of the HHS and HHS-CVDm mortality prediction at median follow-up (12 years) in the overall ENRICA cohort and in participants without prior chronic disease by risk categories from the calibrated HHS
| Low risk (< 2.5%) | High risk (≥ 2.5%) | |||
|---|---|---|---|---|
| Men | Women | Men | Women | |
| Overall cohorta | ||||
| Events/participants | 12/4023 | 13/5101 | 100/1626 | 86/1191 |
| Observed risk | 0.3 (0.2-0.6) | 0.3 (0.2-0.4) | 7.1 (5.8-8.6) | 8.6 (7.0-10.7) |
| Mean predicted risk | ||||
| HHS | 2.8 (2.75-2.91) | 3.7 (3.6-3.8) | 20.5 (20.0-21.0) | 38.4 (37.3-39.4) |
| HHS-CVDm | 0.71 (0.69-0.73) | 0.5 (0.49-0.52) | 5.6 (5.5-5.8) | 6.9 (6.6-7.2) |
| Discrimination | ||||
| Harrel c-statistic | 0.85 (0.79-0.91) | 0.77 (0.66-0.88) | 0.70 (0.65-0.75) | 0.74 (0.68-0.79) |
| Gonen & Heller smoothed c-statistic | 0.84 (0.77-0.92) | 0.76 (0.66-0.86) | 0.66 (0.62-0.69) | 0.68 (0.65-0.72) |
| Participants without prior chronic diseaseb | ||||
| Events/participants | 7/3699 | 8/4609 | 52/1125 | 43/825 |
| Observed risk | 0.2 (0.1-0.4) | 0.2 (0.1-0.4) | 5.2 (3.9-6.8) | 6.3 (4.6-8.5) |
| Mean predicted risk | ||||
| HHS | 2.73 (2.65-2.81) | 3.5 (3.4-3.6) | 19.4 (18.9-19.9) | 37.1 (35.9-38.3) |
| HHS-CVDm | 0.68 (0.66-0.71) | 0.48 (0.46-0.49) | 5.3 (5.1-5.5) | 6.6 (6.2-6.9) |
| Discrimination | ||||
| Harrel c-statistic | 0.86 (0.78-0.94) | 0.72 (0.57-0.88) | 0.74 (0.67-0.80) | 0.74 (0.67-0.82) |
| Gonen & Heller smoothed c-statistic | 0.85 (0.76-0.94) | 0.72 (0.58-0.87) | 0.67 (0.62-0.71) | 0.68 (0.64-0.73) |
95%CI, confidence interval; CVD, cardiovascular disease; CVDm, cardiovascular disease model; HHS, Healthy Hearth Score.
The data are presented as % (95%CI) or c-statistic (95%CI).
Risk categories based on the cutoff proposed by European Society of Cardiology Guidelines28
In sensitivity analysis, we assessed the performance of the HHS in our population assuming alternative extreme scenarios of survival function of CVD at 12 years (). Similar results were observed when we used the HHS to predict all-cause mortality over a median 12.9 years of follow-up with 938 all-cause deaths (525 men, 413 women). Although the original HHS showed good discrimination for men and women in both the overall cohort and in those without chronic diseases (), its calibration performance was poor across most deciles of predicted risk () but improved to optimal when offset by the baseline survival hazard ().
DISCUSSIONIn this nationally representative cohort of Spanish adults, the HHS for estimating 12-year CVD mortality showed good discrimination in the overall cohort and among those free of important chronic diseases, which was comparable to that in the original derivation cohorts (ENRICA c-statistic for men 0.89 and for women 0.91; HPFS, 0.72; NHS, 0.77)16 or for other well-known CVD risk scores (eg, ESC-SCORE-2 C-indices ranged from 0.67 to 0.81; Framingham-REGICOR: 0.78 in men and 0.82 in women).28–31 A potential explanation is that our study was based on 12-year prediction, which may naturally render better results than those from 20-year prediction. Using the same original baseline survival and sex-specific beta coefficients for the cohorts on which the HHS was developed, the calibration was poor but substantially improved when we offset the baseline survival function to our population (figure 4). This result was expected, given that baseline CVD risk differs between populations. In this regard, the calibration of risk prediction tools in other populations have also used the baseline survival function for the population under study.6 Indeed, life expectancy at birth was 83.2 years in Spain and was 78.4 years in the United States32; in addition, Spanish age-standardized CVD mortality rates are among the lowest in Europe33 and much lower than in United States.19 Thus, it is not surprising that the original HHS overestimated the risk in our population similar to other risk equations developed in Anglo-Saxon countries, such as the Framingham equation, which overestimated the risk in the southern European/Mediterranean populations.6 In addition, although the original HHS was developed to estimate CVD incidence but not CVD mortality, and the former is more frequent than the latter, it is known that most of the HHS components are risk factors for both CVD and CVD deaths and even other chronic diseases. Nonetheless, the calibration results were very good when we offset the baseline hazard. In addition, the performance was good even among persons classified as low CVD risk (< 2.5%). This is important because even when the mid-term risk is low, the long-term CVD risk can be high, which corresponds to most people who should be targeted for primordial prevention.

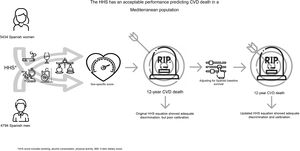
Central illustration. The Healthy Heart Score is a lifestyle CVD risk prediction model that includes a set of modifiable lifestyle behaviors, namely smoking status, body mass index, physical activity, and a 5-component dietary score. The beta coefficients are sex-specific and were originally developed and validated in the Nurses’ Health Study and Health Professional follow-up. Using the original sex-specific beta coefficients, the performance in an external, representative Spanish population, showed good discrimination but poor calibration. After adjustment for the Spanish baseline survival, the HHS showed adequate calibration.
CVD, cardiovascular disease; HHS, Healthy Hearth Score.
Of note is that after recalibrating by the sex-specific baseline survival function, the calibration became good for a) all but the highest decile of predicted CVD risk, where the calibrated HHS underestimated the risk, and b) all age groups except in those aged> 70 years where there was an underestimation. In general, CVD risk prediction becomes increasingly difficult as age increases, because age is progressively more important than lifestyle behaviors as a risk factor; moreover, many older indivuals are frequently under drug treatment to lower blood pressure or cholesterol levels; in this context, the ability of lifestyle to predict CVD death can be diminished by risk factor therapy.
External validation of the HHS is a required first step toward acceptance of a model in clinical or public health practice.34 Although the HHS was internally validated in the NHS and HPFS cohorts, currently its performance has been externally assessed in younger populations17 and in African Americans.18 This is the first time that the HHS has been validated in a population outside North America. The fact that we did not adjust the beta coefficients, nor the variables selected, allows for the broader use of the original HHS model; failing in the validation process would have required creating a different score, which reduces the simplicity of using a single score across the population and even outcomes. Indeed, previous research has shown that the HHS has been associated with multiple outcomes beyond CVD including diabetes, hypercholesterolemia, hypertension,35 all-cause, CVD and cancer death,36 and frailty.37 Hence, it is not surprising that the HHS also predicted all-cause mortality in our cohort. These results provide evidence that many of the behaviors that increase CVD risk are also underlying risk factors for other diseases, which is clinically important because an individual can be advised to adopt a set of behaviors to prevent a number of different adverse health outcomes and not only CVD.
Clinical applicationOne of the strengths of the HHS vs other risk equations is that it only includes modifiable lifestyle factors and there is no need for laboratory measurements to calculate risk. This is a strategic advantage for its usefulness in the clinical setting, particularly in low- and middle-income countries with poor access to laboratory services. In addition, the HHS focuses on the most critical health behaviors that can be individually monitored to help improve CVD health, either in nonclinical settings or within health promotion clinics, including in routine work-related health checkups. In addition, while some of the barriers for implementing tools in clinical practice is “time”, a previous qualitative study to assess the strengths, weaknesses and clinical usefulness of this tool among patients and health providers reported an average of 4minutes to finalize the assessment and the results supported the use of the HHS as a CVD primordial prevention tool.38
LimitationsThere were differences in the follow-up time (20 years in the developmental cohorts vs 12-years in our cohort) and outcome (CVD incidence vs CVD deaths) between de NHS and HPFS cohorts in the United States and the ENRICA cohort in Spain. However, we simulated different scenarios with different baseline hazards and, when we additionally offset the baseline survival function, a good HHS performance in the ENRICA cohort was achieved without requiring further adjustments. Furthermore, although information on more than 90% of the total cohort participants was analyzed, most of the exclusions were due to missing data on BMI. Since this is an important risk factor for CVD incidence and mortality, by excluding these participants, we could have introduced some bias in our estimates; however there were no major differences between included and excluded participants. Finally, the resulting limited number of CVD deaths might reduce the precision of our estimates.
CONCLUSIONSIn this cohort, representative of the adult population of Spain, the locally-calibrated HHS based on 9 modifiable lifestyle behaviors, showed good discrimination and acceptable calibration for predicting CVD mortality. Thus, this tool might be useful within the context of a primordial CVD prevention strategy in Spain. Nevertheless, its performance in other European populations and the HHS implementation in the clinical setting warrants further investigation.
FUNDINGThis work was supported by the Carlos III Health Institute; the Secretary of R+D+I; the European Regional Development Fund/European Social Fund (FIS grants 19/319, 20/00896, FI29/00162 to MDV); the National Plan on Drugs (grant 2020/17); Fundación Soria Melguizo (MITOFUN project); Ministry of Science, Innovation and Universities (RYC 2018-02069I to MSP). The funders had no role in study design, data collection and analysis, decision to publish, or preparation of the manuscript.
AUTHORS’ CONTRIBUTIONSM. Sotos-Prieto, drafting the first version of the manuscript, design of the study, interpretation, statistical analysis supervision, final approval; M. Delgado-Velandia, statistical analysis, methodology, final approval; B.M. Fernandez-Felix and J. Zamora, statistical analysis, methodology, final approval of the content, R. Ortolá, E. García-Esquinas, E.B Rimm, feedback on the content and supervision of the final manuscript; F. Rodríguez-Artalejo, manuscript, design of the study, leading and supervision, final approval. All authors have read and approved the final version of this manuscript and provided written consent for its publication accepting complete responsibility for its content. Author contributions were agreed prior to manuscript submission.
CONFLICTS OF INTERESTThe authors declare no competing interests.
- -
The HHS is a lifestyle CVD prediction model that showed good calibration and validation in the Nurseś Health Study and Health Professionals Follow-up (North America)
- -
The HHS has been associated with multiple other outcomes including frailty, diabetes, hypertension, high blood cholesterol, and mortality.
- -
This is the first time the HHS has been validated in an external, Mediterranean population. The HHS showed good discrimination and calibration for predicting CVD death in a Spanish population
- -
External validation of the HHS is the first step for its dissemination and translation to clinical practice.
- -
The HHS does not need laboratory measurements to calculate risk, supporting its usefulness in the clinical setting.
Supplementary data associated with this article can be found in the online version, at https://doi.org/10.1016/j.rec.2022.10.009