
The cardiac sequelae of SARS-CoV-2 infection are still poorly documented. We conducted a cross-sectional study in healthcare workers to report evidence of pericardial and myocardial involvement after SARS-CoV-2 infection.
MethodsWe studied 139 healthcare workers with confirmed past SARS-CoV-2 infection. Participants underwent clinical assessment, electrocardiography, and laboratory tests, including immune cell profiling and cardiac magnetic resonance (CMR). Clinically suspected pericarditis was diagnosed when classic criteria were present and clinically suspected myocarditis was based on the combination of at least 2 CMR criteria.
ResultsMedian age was 52 (41-57) years, 71.9% were women, and 16.5% were previously hospitalized for COVID-19 pneumonia. On examination (10.4 [9.3-11.0] weeks after infection-like symptoms), participants showed hemodynamic stability. Chest pain, dyspnea or palpitations were present in 41.7% participants, electrocardiographic abnormalities in 49.6%, NT-proBNP elevation in 7.9%, troponin in 0.7%, and CMR abnormalities in 60.4%. A total of 30.9% participants met criteria for either pericarditis and/or myocarditis: isolated pericarditis was diagnosed in 5.8%, myopericarditis in 7.9%, and isolated myocarditis in 17.3%. Most participants (73.2%) showed altered immune cell counts in blood, particularly decreased eosinophil (27.3%; P<.001) and increased cytotoxic T cell numbers (17.3%; P <.001). Clinically suspected pericarditis was associated (P <.005) with particularly elevated cytotoxic T cells and decreased eosinophil counts, while participants diagnosed with clinically suspected myopericarditis or myocarditis had lower (P <.05) neutrophil counts, natural killer-cells, and plasma cells.
ConclusionsPericardial and myocardial involvement with clinical stability are frequent after SARS-CoV-2 infection and are associated with specific immune cell profiles.
Keywords
The novel severe acute respiratory syndrome-coronavirus-2 (SARS-CoV-2) is currently causing a sustained COVID-19 pandemic, with the risk of causing long-term cardiac sequelae in the infected population.1 The fear of SARS-CoV-2 causing greater myocardial damage than other conventional viruses is based on its mechanism of infecting human cells by binding to the transmembrane angiotensin converting-enzyme 2—which is mainly expressed by cells in alveoli and myocardial tissue—the rise in troponin levels observed in COVID-19 patients hospitalized with pneumonia and its association with increased mortality, and the probably reduced innate antiviral defenses against a novel virus.2
Pericarditis and myocarditis after conventional viral infections both stem from an inadequate or excessive immune response driven by T and B cell-mediated mechanisms.3,4 If there is an inadequate response, continued viral replication in the perimyocardium protracts inflammation by attracting killer T cells and the concomitant production of chemokines and cytokines. In contrast, molecular mimicry can result in the production of autoantibodies against cardiac proteins, leading to a cardio-specific autoimmune response that causes sustained inflammation, effusion, or cardiac remodeling. However, the specific immune profiles that occur after SARS-CoV-2 infection, particularly in patients showing cardiac sequelae remain unknown.5
The present study was designed to search for evidence of pericardial and myocardial involvement after past SARS-CoV-2 infection comprehensively studied by clinical assessment, laboratory tests, electrocardiography and cardiac magnetic resonance (CMR) imaging. Additionally, participants underwent an in-depth characterization of the immune cell compartments in blood and the virus-specific humoral immune response. As healthcare workers have been the group most affected by SARS-CoV-2 in Spain but have also been subject to more testing than the rest of the population, we decided to conduct the study in this singular cohort.
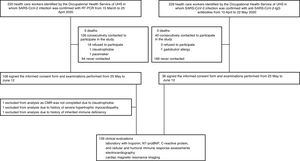
METHODSStudy design and healthcare worker participantsThis cross-sectional study consecutively recruited 142 healthcare workers with laboratory confirmed SARS-CoV-2 infection in the University Hospital of Salamanca, and who volunteered for the study. Among them, 106 healthcare workers tested positive for SARS-CoV-2 by reverse-transcriptase polymerase chain reaction (RT-PCR) from nasopharyngeal swab between March 13 and April 25, 2020; and 36 healthcare workers were diagnosed after testing positive for anti-SARS-CoV-2-immunoglobulin G (IgG) antibodies by ELISA between April 10 and May 22, 2020, as part of a major hospital campaign. The purpose of this second group was to also provide data from participants with past SARS-CoV-2 infection, who are more likely to have mild symptoms of viral infection, and because population-based SARS-CoV-2 seroprevalence studies are becoming more established.6,7 Study enrolment began on May 25 and finished on June 12, 2020.
Institutional approval (2020/05/490) for the study was provided by the University Hospital of Salamanca Ethics Committee, and all participants provided written informed consent. The study is registered with ClinicalTrials.gov NCT04413071. The responsibility for the study design, data collection and data interpretation lay solely with the study investigators. An internal adjudication monitoring board reviewed all cardiac study findings and adjudicated study outcomes. The authors had full access to all the data and elaborated all materials to submit for publication.
Investigation process and proceduresAll participants underwent clinical evaluation, electrocardiography, laboratory tests and CMR imaging at the same visit. After obtaining written informed consent, trained interviewers used a structured questionnaire to collect baseline data in face-to-face interviews. A cardiologist took a complete medical history, performed a physical examination and reviewed the completeness of the questionnaire in a separate room, where an electrocardiogram was performed, and blood samples were drawn immediately before the CMR. Electrocardiograms were interpreted in consensus by 2 experienced readers, who were blinded to participant identification, clinical history, symptoms, physical examination, and other findings.
CMR was performed using a clinical 1.5 whole-body magnetic resonance scanner in the cardiac imaging laboratory of the University Hospital of Salamanca.8 The imaging acquisition protocol is described in detail in Methods of the . CMR images were globally and regionally analyzed using dedicated software, in consensus by 2 experienced readers, who were blinded in a similar manner to the electrocardiogram protocol. T2 and T1-based markers of myocardial inflammation were analyzed in each of the 16 segments of the 17-segment model of the American Heart Association (the true apex was excluded), where only positive segment concordances from the different T2 and T1-based markers were considered. Because myocarditis was diagnosed according to these T2 and T1-based CMR markers and an adequate selection of normal reference values is fundamental, we used a population-based control CMR imaging group from 50 sex- and aged-matched individuals without cardiac disease.9 The prevalences of cardiovascular risk factors (hypertension, diabetes mellitus, dislipemia, current smoking) in the control cohort were similar to those in the study population.
Immunophenotypic analysis of (> 250) immune cell populations was performed in peripheral blood samples collected in K3-ethylenediaminetetra-acetic acid (EDTA, 10mL/sample, and stained with the EuroFlow lymphocyte screening tube and the cluster of differentiation 4 T cell (TCD4), natural killer (NK)/TCD8, beta-lactoglobulin hydrolysates (BIgH) and monocyte-derived dendritic cell (MoDC) immune monitoring tubes by flow cytometry (FACSCANTO II and LSR-Fortessa, respectively; Becton/Dickinson Biosciences, United States) using a dual-platform assay previously described in detail.10 Reference values for the individual immune cell subsets investigated in blood by flow cytometry were defined based on a population-based control group of 463 age-matched adults (median age 52 [IQR 47-61] years) studied prior to the SARS-CoV-2 pandemic. Anti-SARS-CoV-2-IgM (AnshLabs, Webster, United States), IgG and IgA (Mikrogen Diagnostik, Neuried, Germany) antibody levels were measured in parallel in plasma from the same blood samples using commercially available in vitro diagnostic medical device approved (semiquantitative) ELISA kits, strictly as instructed by the manufacturers.
Study outcomes and definitionsStudy outcome measures were the prevalence of clinical pericarditis and of myocarditis, and the characterization of the immune cell compartments in blood, and the virus-specific humoral immune response. Clinically suspected pericarditis was diagnosed if at least 2 of the following criteria were present, following current guidelines3: pericarditic chest pain, pericardial rub on auscultation, widespread ST-elevation or PR segment depression on electrocardiogram, and evidence of pericardial effusion on CMR. Elevation of inflammation markers, C-reactive protein, and evidence of pericardial inflammation on CMR were used as additional supporting findings. The diagnosis of clinically suspected myocarditis was based on CMR criteria11; we considered as main CMR criteria positive edema-sensitive T2-based markers (T2-weighted images or T2-mapping) or positive T1-based tissue characterization markers (abnormal T1-relaxation time or extracellular volume or late gadolinium enhancement), and as supportive CMR criteria either pericardial effusion, or evidence of pericardial inflammation on CMR, or systolic left ventricular wall motion abnormalities. Considering that participants were being examined after the acute phase of SARS-CoV-2 infection, in this study clinically suspected myocarditis was defined as the presence of a combination of at least 2 T2 or T1-based CMR main criteria or the presence of combination of only 1 T2 or T1-based main criterion with 1 additional CMR supportive criterion.
As we were aware that pericarditis and myocarditis occur together in clinical practice, we therefore defined as clinically suspected myopericarditis those cases of pericarditis with associated myocarditis on CMR but without left ventricular wall motion abnormalities, and as clinically suspected perimyocarditis those cases where left ventricular wall motion abnormalities were present.12
Statistical analysisDescriptive statistics were used to summarized the data. Results are presented as the proportion (%) of valid cases for categorical variables and as the median [IQR] for continuous variables. Differences between groups were analyzed by the Fisher exact test for categorical variables and by the nonparametric Mann-Whitney or Kruskal-Wallis tests for continuous data. Comparisons between immune cell counts in the blood of patients and controls were adjusted for age and sex (covariates) using the 1-way ANCOVA (analysis of covariance) univariate general linear modeling test (SPSS statistical software package v25.0, IBM, Armonk, United States). We compared characteristics of participants and examinations, all tables, according to the final clinical diagnosis (nonpericardial and myocardial manifestations vs pericarditis vs myopericarditis vs myocarditis). For 2-dimensional visualization of flow cytometry data, multivariate canonical analysis with multidimensional reduction of data via linear discriminant analysis, and the t-distributed stochastic neighbor embedding machine-learning algorithm visualization tools were used (Infinicyt software, Cytognos, Universidad de Salamanca).13
RESULTSStudy populationFigure 1 depicts the flowchart for participant selection among healthcare workers. Of the 142 recruited healthcare workers who signed informed consent, 1 participant did not complete the CMR due to claustrophobia. Two additional participants were excluded due to a history of severe hypertrophic myocardiopathy in 1 case, and inherited immune deficiency in the other. Thus, a total of 139 participants completed the clinical assessment, electrocardiography, laboratory tests and CMR. Of these, 103 (74.1%) had been diagnosed by RT-PCR and 36 (25.9%) by serology. No participants were clinically diagnosed with post-COVID-19 cardiac involvement at the time of their index presentation, nor were those who were previously hospitalized.

All participant characteristics are shown in table 1. By professional categories, 49 (35.3%) were nurses, 35 (25.2%) physicians, and the remaining 55 (39.6%) included different profiles such as auxiliary nurses and other hospital staff. A total of 67 (48.2%) healthcare workers were infected while directly attending COVID-19 hospitalization wards.
Baseline characteristics of the study cohort
| All participants | Presence of pericardial and myocardial manifestations | P | ||||
|---|---|---|---|---|---|---|
| (n=139) | No(n=96) | Pericarditis(n=8) | Myopericarditis(n=11) | Myocarditis(n=24) | ||
| Age, y | 52 [41-57] | 52 [39-58] | 50 [34-56] | 50 [44-61] | 53 [49-58] | .704 |
| Female sex | 100 (71.9) | 64 (66.7) | 7 (87.5) | 8 (72.7) | 21 (87.5) | .164 |
| Coexisting conditions | ||||||
| Obesitya | 17 (12.2) | 14 (14.6) | 1 (12.5) | 0 | 2 (8.3) | .620 |
| Hypertension | 17 (12.2) | 12 (12.5) | 1 (12.5) | 1 (9.1) | 3 (12.5) | 1.000 |
| Diabetes | 2 (1.4) | 2 (2.1) | 0 | 0 | 0 | 1.000 |
| Dyslipidemia | 27 (19.4) | 20 (20.8) | 1 (12.5) | 2 (18.2) | 4 (16.7) | .977 |
| Current smoking | 6 (4.3) | 5 (5.2) | 0 | 1 (9.1) | 0 | .534 |
| Past smoking | 70 (50.4) | 52 (54.2) | 2 (25.0) | 4 (36.4) | 12 (50.0) | .337 |
| Alcohol useb | 23 (16.5) | 12 (12.5) | 2 (25.0) | 2 (18.2) | 7 (29.2) | .140 |
| Cardiovascular disease | 8 (5.8) | 5 (5.2) | 0 | 2 (18.2) | 1 (4.2) | .297 |
| Pulmonary diseasec | 8 (5.8) | 6 (6.3) | 0 | 0 | 2 (8.3) | .898 |
| Sleep apnea-hypopnea syndrome | 8 (5.8) | 6 (6.3) | 1 (12.5) | 1 (9.1) | 0 | .326 |
| Chronic kidney disease | 5 (3.6) | 2 (2.1) | 0 | 0 | 3 (12.5) | .118 |
| Cancer | 4 (2.9) | 3 (3.1) | 0 | 0 | 1 (4.2) | 1.000 |
| At least 1 of the above | 106 (76.3) | 75 (78.1) | 5 (62.5) | 7 (63.6) | 19 (79.2) | 0.493 |
| SARS-CoV-2 infection diagnosis | 0.395 | |||||
| RT-PCR | 103 (74.1) | 67 (69.8) | 7 (87.5) | 10 (90.9) | 19 (79.2) | |
| Anti-SARS-CoV-2-IgG antibodies | 36 (25.9) | 29 (30.2) | 1 (12.5) | 1 (9.1) | 5 (20.8) | |
| Symptoms during SARS-CoV-2 infection | ||||||
| General | ||||||
| Fatigue | 117 (84.2) | 79 (82.3) | 6 (75.0) | 11 (100) | 21 (87.5) | .404 |
| Fever | 94 (67.6) | 65 (67.7) | 7 (87.5) | 9 (81.8) | 13 (54.2) | .260 |
| Cough | 91 (65.5) | 64 (66.7) | 6 (75.0) | 7 (63.6) | 14 (58.3) | .849 |
| Headache | 90 (64.7) | 60 (62.5) | 4 (50.0) | 9 (81.8) | 17 (70.8) | .449 |
| Myalgia | 83 (59.7) | 55 (57.3) | 6 (75.0) | 7 (63.6) | 15 (62.5) | .810 |
| Anosmia | 73 (52.5) | 48 (50.0) | 6 (75.0) | 6 (54.5) | 13 (54.2) | .617 |
| Ageusia | 66 (47.5) | 40 (41.7) | 5 (62.5) | 5 (45.5) | 16 (66.7) | .133 |
| Abdominal pain or diarrhea | 64 (46.0) | 44 (45.8) | 1 (12.5) | 7 (63.6) | 12 (50.0) | .161 |
| Chills | 60 (43.2) | 40 (41.7) | 3 (37.5) | 6 (54.5) | 11 (45.8) | .846 |
| Score throat | 55 (39.6) | 37 (38.5) | 3 (37.5) | 4 (36.4) | 11 (45.8) | .940 |
| Nausea or vomiting | 30 (21.6) | 17 (17.7) | 2 (25.0) | 5 (45.5) | 6 (25.0) | .154 |
| Clumsiness | 20 (14.4) | 15 (15.6) | 1 (12.5) | 2 (18.2) | 2 (8.3) | .856 |
| Memory loss | 19 (13.7) | 13 (13.5) | 0 | 2 (18.2) | 4 (16.7) | .733 |
| Skin lesions | 5 (3.6) | 4 (4.2) | 0 | 0 | 1 (4.2) | 1.000 |
| Cardiac | ||||||
| Shortness of breath | 68 (48.9) | 42 (43.8) | 5 (62.5) | 9 (81.8) | 12 (50.0) | .090 |
| Palpitations | 44 (31.7) | 25 (26.0) | 5 (62.5) | 7 (63.6) | 7 (29.2) | .017 |
| Chest pain | 40 (28.8) | 24 (25.0) | 3 (37.5) | 4 (36.4) | 9 (37.5) | .455 |
| Dizziness | 4 (2.9) | 0 | 1 (12.5) | 2 (18.2) | 1 (4.2) | .003 |
| At least 1 cardiac symptom | 86 (61.9) | 54 (56.3) | 6 (75.0) | 10 (90.9) | 16 (66.7) | .114 |
IgG, immunoglobulin G; RT-PCR, reverse-transcriptase-polymerase-chain-reaction.
Data are expressed as No. (%) or median [interquartile range].
Among the overall study population, 106 (76.3%) had at least 1 comorbidity and 8 (5.8%) healthcare workers had a history of cardiovascular disease: 1 with chronic ischemia with stent revascularization, 3 with paroxysmal atrial fibrillation, 2 with intranodal supraventricular tachycardias treated with ablation, and 2 with an episode of acute pericarditis several years previously.
Most (137 [98.6%]) healthcare workers experienced a viral prodrome during SARS-CoV-2 infection and cardiac symptoms with shortness of breath, chest pain, palpitations or dizziness were reported by 86 (61.9%) participants. A total of 27 (19.4%) healthcare workers were previously diagnosed with COVID-19 pneumonia and 23 (16.5%) required hospitalization (none of these were diagnosed with pericarditis or myocarditis during this hospitalization index).
Chronic drug therapy and treatment during SARS-CoV-2 infection are shown in . Overall, the drug therapy aimed at ameliorating the disease was heterogeneous: hydroxychloroquine was given in 33 (23.7%) participants, lopinavir-ritonavir in 17 (12.2%), oral glucocorticoids in 9 (6.5%), high-dose intravenous bolus of methylprednisolone in 15 (10.8%), and interleukin inhibitors in 18 (12.9%).
Symptoms, electrocardiographic, biochemical, and cardiac magnetic resonance profilingThe study examinations (table 2) were performed 10.4 (9.3-11.0) weeks after the start of symptoms of infection. All participants had vital and exploratory signs of hemodynamic stability on examination. A total of 91 (65.5%) healthcare workers still had symptoms, which were cardiac-related in 58 (41.7%).
Clinical, electrocardiography and laboratory measures at examination
| All participants | Presence of pericardial and myocardial manifestations | P | ||||
|---|---|---|---|---|---|---|
| (N=139) | No(n=96) | Pericarditis(n=8) | Myopericarditis(n=11) | Myocarditis(n=24) | ||
| Time from symptom onset to examination, wk | 10.4 [9.3-11.0]a | 10.4 [9.0-11.1] | 10.5 [8.5-10.9] | 10.1 [9.7-10.6] | 10.2 [9.3-10.7] | .603 |
| Time from SARS-CoV-2 test to examination, wk | ||||||
| RT-PCR | 9.4 [8.1-10.0] | 9.4 [7.9-10.0] | 9.1 [7.0-10.4] | 9.6 [9.0-10.1] | 9.7 [8.9-10.1] | .780 |
| Anti-SARS-CoV-2-IgG antibodiesb | 4.4 [3.6-5.0] | 4.6 [3.5-5.0] | 4.3 | 2.3 | 4.7 [3.7-4.8] | .522 |
| Vital signs on examination | ||||||
| Blood pressure, mmHg | ||||||
| Systolic | 124 [113-139] | 125 [114-141] | 127 [111-142] | 121 [114-139] | 114 [104-135] | .157 |
| Diastolic | 76 [70-83] | 76 [70-85] | 78 [73-83] | 77 [69-82] | 72 [63-77] | .097 |
| Heart rate, bpm | 70 [63-80] | 71 [63-82] | 69 [59-76] | 70 [66-72] | 71 [61-77] | .723 |
| Oxygen saturation <95% | 10 (7.2) | 9 (9.4) | 1 (12.5) | 0 | 0 | .294 |
| Physical examination | ||||||
| Pericardial rub | 0 | 0 | 0 | 0 | 0 | 1.000 |
| Heart murmur | 3 (2.2) | 3 (3.1) | 0 | 0 | 0 | 1.000 |
| Third and fourth heart sound | 0 | 0 | 0 | 0 | 0 | 1.000 |
| Pulmonary crackles | 5 (3.6) | 4 (4.2) | 0 | 1 (9.1) | 0 | .458 |
| Symptoms on examination | ||||||
| No symptoms | 48 (34.5) | 39 (40.6) | 2 (25.0) | 1 (9.1) | 6 (25.0) | .118 |
| General | ||||||
| Fatigue | 37 (26.6) | 25 (26.0) | 2 (25.0) | 3 (27.3) | 7 (29.2) | .982 |
| Anosmia | 12 (8.6) | 5 (6.3) | 1 (12.5) | 1 (9.1) | 4 (16.7) | .241 |
| Ageusia | 7 (5.0) | 4 (4.2) | 1 (12.5) | 0 | 2 (8.3) | .375 |
| Headache | 7 (5.0) | 4 (4.2) | 1 (12.5) | 1 (9.1) | 1 (4.2) | .332 |
| Sore throat | 7 (5.0) | 3 (3.1) | 0 | 1 (9.1) | 3 (12.5) | .154 |
| Abdominal pain | 6 (4.3) | 3 (3.1) | 0 | 1 (9.1) | 2 (8.3) | .333 |
| Memory loss | 4 (2.9) | 2 (2.1) | 0 | 0 | 2 (8.3) | .441 |
| Joint pain | 3 (2.2) | 1 (1.0) | 2 (25.0) | 0 | 0 | .027 |
| Piloerection | 2 (1.4) | 1 (1.0) | 1 (12.5) | 0 | 0 | .174 |
| Cardiac | ||||||
| Dyspnea or shortness of breath | 36 (25.9) | 21 (21.9) | 3 (37.5) | 6 (54.5) | 6 (25.0) | .100 |
| Chest pain | 27 (19.4) | 9 (9.4) | 5 (62.5) | 9 (81.8) | 4 (16.7) | <.001 |
| Pericarditis-like | 18 (12.9) | 4 (4.2) | 5 (62.5) | 9 (81.8) | 0 | <.001 |
| Palpitations | 20 (14.4) | 12 (12.5) | 2 (25.0) | 3 (27.3) | 3 (12.5) | .345 |
| Dizziness | 8 (5.8) | 3 (3.1) | 1 (12.5) | 2 (18.2) | 2 (8.3) | .066 |
| At least 1 cardiac symptom | 58 (41.7) | 32 (33.3) | 8 (100) | 9 (81.8) | 11 (45.8) | .003 |
| Electrocardiographic pericarditis-like changes | ||||||
| Widespread ST-elevation | 13 (9.4) | 8 (8.3) | 2 (25.0) | 3 (27.3) | 0 | .018 |
| PR depression | 33 (23.7) | 19 (19.8) | 5 (62.5) | 5 (45.5) | 4 (16.7) | .014 |
| Laboratory measurements | ||||||
| Glomerular filtration rate <60 mL/min x 1.73 m2 | 2 (1.4) | 1 (1.0) | 1 (12.5) | 0 | 0 | .174 |
| High-sensitivity troponin T> 14 pg/mLc | 1 (0.7) | 0 | 0 | 0 | 1 (4.2) | .309 |
| NT-proBNP ≥ 125 pg/mL | 11 (7.9) | 6 (6.3) | 0 | 2 (18.2) | 3 (12.5) | .289 |
| C-reactive protein> 3 mg/dL | 10 (7.2) | 6 (6.3) | 1 (12.5) | 0 | 3 (12.5) | .439 |
IgG, immunoglobulin G; RT-PCR, reverse-transcriptase-polymerase-chain-reaction.
Data are expressed as No. (%) or median [interquartile range].
Of the 139 electrocardiograms, electrocardiographic abnormalities were reported in 69 (49.6%) cases (). A total of 33 (23.7%) electrocardiograms met the criteria for pericarditis-like changes (). As the Occupational Health Service of the hospital provide healthcare workers a baseline medical evaluation before starting their jobs, we were able to recover and review 53 (76.8%) prior baseline electrocardiograms from the 69 patients with electrocardiographic changes at the study examination. Of these 53 electrocardiographic comparisons, 67.9% electrocardiographic changes at the study examination were not present previously and consisted mainly of pericardial like changes and ST-segment depression or T-wave inversion ().
Cardiac-specific and inflammatory biomarkers were within the normal range in most participants (table 2). CMR abnormalities were observed in 84 (60.4%) participants (table 3 and , figure 2). Two (1.4%) participants showed increased myocardial T2-relaxation time, 5 (3.6%) edema on T2-weighted images, 40 (28.8%) increased native myocardial T1-relaxation time, 27 (19.4%) increased T1-extracellular volume, 10 (7.2%) T1-late gadolinium enhancement, 42 (30.2%) pericardial effusion, 1 (0.7%) a pericardial thickness of 3mm and 7 (5.0%) systolic left ventricular wall motion abnormalities, global or regional.
Cardiac magnetic resonance measures
| Population-based controls(n=50) | All participants(N=139) | P | Presence of pericardial and myocardial manifestations | P | ||||
|---|---|---|---|---|---|---|---|---|
| No(n=96) | Pericarditis(n=8) | Myopericarditis(n=11) | Myocarditis(n=24) | |||||
| Age, y | 51 [42-56] | 53 [42-58] | .335 | 52 [39-58] | 51 [34-56] | 50 [44-61] | 53 [49-58] | .704 |
| Female sex | 35 (70.0) | 100 (71.9) | .856 | 64 (66.7) | 7 (87.5) | 8 (72.7) | 21 (87.5) | .164 |
| Height, cm | 166 [160-172] | 165 [160-173] | .844 | 166 [161-174] | 164 [162-169] | 167 [162-169] | 162 [158-170] | .300 |
| Weight, kg | 65 [59-75] | 69 [58-80] | .506 | 72 [60-83] | 58 [54-75] | 60 [56-71] | 59 [53-74] | .003 |
| Body surface area, m2 | 1.7 [1.6-1.9] | 1.8 [1.6-1.9] | .555 | 1.8 [1.7-2.0] | 1.6 [1.6-1.9] | 1.6 [1.6-1.8] | 1.6 [1.6-1.9] | .004 |
| Haematocrit, % | 42 [40-43] | 39 [37-41] | <.001 | 40 [38-42] | 39 [36-41] | 41 [36-41] | 37 [35-39] | .002 |
| Left ventricle | ||||||||
| End-diastolic indexed volume, mL/m2 | 74 [58-82] | 72 [67-83] | .483 | 72 [65-84] | 73 [60-89] | 77 [71-96] | 72 [69-79] | .322 |
| End-systolic indexed volume, mL/m2 | 23 [20-31] | 26 [23-31] | .079 | 27 [22-31] | 27 [20-34] | 26 [25-40] | 26 [23-30] | .802 |
| Indexed left ventricle mass, g/m2 | 48 [43-60] | 51 [46-60] | .071 | 53 [46-62] | 49 [41-58] | 50 [43-59] | 50 [47-55] | .488 |
| Left ventricular ejection fraction, % | 66 [61-70] | 64 [60-67] | .019 | 63 [59-67] | 64 [60-67] | 65 [61-66] | 65 [61-67] | .782 |
| Wall regional motion abnormalities | 0 | 7 [5.0] | .193 | 4 [4.2] | 0 | 0 | 3 [12.5] | .291 |
| Global myocardial T2-relaxation time, msec | 52 [48-54] | 50 [48-51] | <.001 | 50 [48-51] | 49 [45-51] | 50 [48-53] | 50 [50-52] | .086 |
| Global native myocardial T1-relaxation time, msec | 1024 [991-1040] | 1021 [1005-1040] | .615 | 1020 [1002-1039] | 1028 [997-1046] | 1027 [1024-1045] | 1030 [1008-1052] | .411 |
| Global T1-extracellular volume, % | 25 [22-30] | 26 [24-28] | .355 | 25 [23-27] | 27 [26-27] | 28 [25-30] | 28 [26-30] | <.001 |
| Left ventricle global longitudinal strain | –23 [–26 to [–21]] | –22 [–24 to [–20]] | .004 | –21 [–24 to [–20]] | –24 [–25 to [–18]] | –22 [–24 to [–21]] | –22 [–25 to [–20]] | .880 |
| Left ventricle global circumferential strain | –33 [–36 to [–28]] | –28 [–32 to [–26]] | <.001 | –28 [–32 to [–25]] | –29 [–31 to [–24]] | –31 [–32 to [–25]] | –29 [–32 to [–26]] | .952 |
| Left ventricle global radial strain | 73 [60-88] | 59 [45-70] | <.001 | 58 [44-68] | 60 [43-70] | 60 [51-71] | 60 [49-76] | .676 |
| Right ventricle | ||||||||
| End-diastolic indexed volume, mL/m2 | 71 [61-80] | 74 [67-85] | .094 | 74 [66-86] | 78 [62-92] | 78 [69-90] | 76 [69-80] | .449 |
| End-systolic indexed volume, mL/m2 | 26 [18-30] | 27 [22-34] | .032 | 27 [22-33] | 30 [18-40] | 27 [23-36] | 29 [22-34] | .909 |
| Right ventricular ejection fraction, % | 66 [60-69] | 63 [59-68] | .095 | 63 [58-67] | 61 [56-72] | 66 [60-69] | 63 [60-66] | .839 |
| Free wall right ventricle global longitudinal strain | –28 [–32 to–24]] | –25 [–27 to [–21]] | <.001 | –25 [–27 to–21]] | –20 [–25 to [–19]] | –25 [–26 to [–20]] | –26 [–28 to [–22]] | .214 |
| Atrium | ||||||||
| Left atrium indexed area, cm/m2 | 11 [10-13] | 11 [10-13] | .947 | 11 [10-12] | 13 [11-13] | 13 [12-14] | 12 [10-14] | .067 |
| Left atrium emptying fraction, % | 58 [53-66] | 60 [54-66] | .540 | 61 [56-66] | 60 [37-68] | 58 [52-69] | 60 [54-66] | .859 |
| Left atrium global longitudinal strain | 41 [34-50] | 41 [35-52] | .522 | 41 [35-53] | 43 [28-55] | 40 [33-56] | 43 [34-51] | .983 |
| Right atrium indexed area, cm/m2 | 10 [10-12] | 10 [9-12] | .497 | 10 [9-11] | 11 [9-14] | 11 [10-13] | 10 [9-12] | .087 |
| Main CMR Lake-Louise criteria for myocarditis | ||||||||
| Increase in myocardial T2-relaxation time | 0 | 2 (1.4) | .540 | 0 | 0 | 0 | 2 (8.3) | .094 |
| T2-weighted hyperintensity | 0 | 5 (3.6) | .211 | 0 | 0 | 1 (9.1) | 4 (16.7) | .002 |
| Increase in native myocardial T1-relaxation time | 0 | 40 (28.8) | <.001 | 19 (19.8) | 0 | 5 (45.5) | 16 (66.7) | <.001 |
| Increase in T1-extracellular volume | 0 | 27 (19.4) | <.001 | 8 (8.3) | 0 | 6 (54.5) | 13 (54.2) | <.001 |
| T1-late gadolinium enhancementa | 0 | 10 (7.2) | .042 | 2 (2.1) | 0 | 4 (36.4) | 4 (16.7) | <.001 |
| At least 1 main criterion | 0 | 63 (45.3) | <.001 | 28 (29.2) | 0 | 11 (100) | 24 (100) | <.001 |
| Supportive CMR Lake-Louise criteria for myocarditis | ||||||||
| Pericardial effusionb | 0 | 42 (30.2) | <.001 | 11 (11.5) | 7 (87.5) | 11 (100) | 13 (54.2) | <.001 |
| Pericardial thickeningc | 0 | 1 (0.7) | .735 | 0 | 0 | 1 (9.1) | 0 | .137 |
| Systolic left ventricular wall motion abnormalitiesd | 0 | 7 (5.0) | .112 | 4 (4.2) | 0 | 0 | 3 (12.5) | .291 |
| At least 1 supportive criterion | 0 | 48 (34.5) | <.001 | 14 (14.6) | 7 (87.5) | 11 (100) | 16 (66.7) | <.001 |
CMR, cardiac magnetic resonance.
The data are expressed as No. (%) or median [interquartile range].
T1-late gadolinium enhancement pattern was nontransmural and nonischemic in the 10 patients identified and was located in the inferolateral left ventricular wall (7 patients), inferior left ventricular wall (1 patient), inferoseptal left ventricular wall (1 patient), and inferoseptal left ventricular and inferior right ventricle walls (1 patient).
Left ventricular wall motion abnormalities were global hypokinesia (4 participants) and regional hypokinesia (3 participants; 2 cases apicolateral and 1 case midinferoseptal). Left P value for comparisons between population-based controls vs all participants. Right P value for comparison among the 4 participants groups.
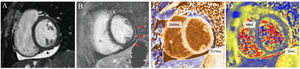
, subtle subepicardial late gadolinium enhancement (red arrows) and increased T1-native relaxation time on the inferolateral segment, with nonsignificant increased T2 relaxation time on this segment. All images are short-axis views at papillary muscles level. Image A: end-diastolic cine image (Steady State Free Precession, SSFP). Image B: phase-sensitive inversion-recovery late gadolinium enhancement. Image C: T1-native mapping (Modified Look-Locker Imaging, MOLLI). Image D: T2 mapping (Gradient and Spin-Echo, GraSE).")
Cardiac magnetic resonance imaging composition from a participant with pericardial and myocardial involvement. The main findings are pericardial effusion on the inferior wall (*), subtle subepicardial late gadolinium enhancement (red arrows) and increased T1-native relaxation time on the inferolateral segment, with nonsignificant increased T2 relaxation time on this segment. All images are short-axis views at papillary muscles level. Image A: end-diastolic cine image (Steady State Free Precession, SSFP). Image B: phase-sensitive inversion-recovery late gadolinium enhancement. Image C: T1-native mapping (Modified Look-Locker Imaging, MOLLI). Image D: T2 mapping (Gradient and Spin-Echo, GraSE).
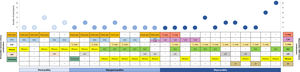
A total of 43 (30.9%) participants fulfilled the criteria for either clinically suspected pericarditis or myocarditis. Clinically suspected isolated pericarditis was diagnosed in 8 (5.8%) participants, isolated myocarditis in 24 (17.3%), and myopericarditis in 11 (7.9%). These were no cases of perimyocarditis. Descriptions of criteria combinations are provided in figure 3 and baseline and examination characteristics for each diagnostic group are detailed in table 1 and table 2.

Description of pericarditis clinical criteria and cardiac magnetic resonance criteria combinations in participants diagnosed with pericarditis, myopericarditis, or myocarditis. CRP, C-reactive protein; ECG, electrocardiogram; ECV, increase in T1-extracellular volume; dffusion, pericardial effusion assessed by CMR; LGE, T1-late gadolinium enhancement; LV, left ventricular wall motion abnormalities; T1 map, increase in native myocardial T1-relaxation time; T2 map, increase in myocardial T2-relaxation time; T2W, increase in T2-weighted hyperintensity; thickened, pericardial thickness≥ 3mm
A higher percentage of participants with clinically suspected pericarditis, myopericarditis or myocarditis had cardiac symptoms during SARS-CoV-2 infection (32 [74.4%] vs 54 [56.3%]; P=.058) and on study examination (26 [60.5%] vs 32 [33.3%]; P=.005) than participants without these manifestations. Chronic drug therapy with statins was more frequent in participants without pericardial or myocardial manifestations than in those with clinically suspected pericarditis, myopericarditis or myocarditis (16 [16.7%] vs 1 [2.3%]; P=.022).
Participants with infection confirmed through anti-SARS-CoV-2-IgG detectionAmong the 36 participants diagnosed with past infection through anti-SARS-CoV-2-IgG detection (data for this group, compared with RT-PCR participants, are shown in ), 34 (94.4%) reported at least 1 of the 18 collected symptoms of COVID-19 infection (ie, fever, persistent cough and/or anosmia, whose presence, according to current guidelines would require isolation and testing was present in 27 (75.0%) of these 36 participants); 28 (77.8%) had previously tested negative by RT-PCR after developing SARS-CoV-2 symptoms and 8 (22.2%) were never RT-PCR tested.
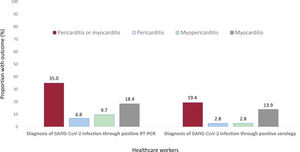
A lower percentage of participants diagnosed through positive serology still had symptoms on examination compared with RT-PCR participants (18 [50.0%] vs 73 [70.9%]; P=.027); nonetheless, the prevalence of clinically suspected pericarditis, myopericarditis or myocarditis was high in both groups (figure 4).
Altered immune cell and humoral profiles in blood
Most study participants (101 [73.2%]) displayed altered cell counts in blood for at least 1 major immune cell population, as illustrated in table 4 and figure 5, and described in more detail in . The most frequent alterations consisted of eosinopenia (38 [27.3%] cases; P <.001) and increased T cells (specially for CD4-CD8-/lo (cytotoxic) T cell (24 [17.3%] cases; P <.001); and, to a lesser extent, also B cell counts (16 [11.5%] cases; P <.001). In addition, compared with age- and sex-matched healthy donors, participants had higher median counts in blood of basophils (38 vs 47 cells/μL, respectively; P=.007) and monocytes (317 vs 405 cells/μL; P <.001); in contrast, participants showed decreased median numbers of circulating blood neutrophils (3723 vs 3430 cells/μL; P=.010), eosinophils (157 vs 74 cells/μL; P <.001), and circulating plasma cells (1.7 vs 0.8 cells/μL; P <.001).
Distribution of subsets of myeloid and lymphoid immune cells in blood
| Healthy donors(n=463) | All participants(N=139) | P | Presence of pericardial and myocardial manifestations | P | ||||
|---|---|---|---|---|---|---|---|---|
| No(n=96) | Pericarditis(n=8) | Myopericarditis(n=11) | Myocarditis(n=24) | |||||
| Neutrophils | 3723 [2969-4613] | 3430 [2633-4225] | .010 | 3468 [2647-4223] | 3013 [2385-3699] | 3966 [3157-4255] | 3023 [1966-4208] | .491 |
| % cases ↓5thp/↑95thp | - | 18 (12.9)/5 (3.6) | <.001/.001 | 10 (10.4)/4 (4.2) | 1 (12.5)/0 | 0/0 | 7 (29.2)/1 (4.2) | .051/.844 |
| Eosinophils | 157 [101-249] | 74 [47-149] | <.001 | 82 [50-130] | 48 [31-189] | 59 [46-69] | 102 [39-191] | .463 |
| % cases ↓5thp/↑95thp | - | 38 (27.3)/1 (0.7) | <.001/.231 | 24 (25.0)/1 (1.0) | 4 (50.0)/0 | 3 (27.3)/0 | 7 (29.2)/0 | .499/0.929 |
| Basophils | 38 [21-52] | 47 [35-62] | .007 | 49 [37-62] | 34 [23-55] | 36 [29-56] | 51 [38-65] | .293 |
| % cases ↓5thp/↑95thp | - | 4 (2.9)/5 (3.6) | <.001/<.001 | 2 (2.1)/3 (3.2) | 1 (12.5)/1 (25) | 1 (9.1)/1 (9.1) | 0/1 (4.2) | .169/.719 |
| Monocytes | 317 [245-433] | 405 [328-523] | <.001 | 418 [345-533] | 369 [307-424] | 404 [347-476] | 358 [282-574] | .724 |
| % cases ↓5thp/↑95thp | - | 3 (2.2)/8 (5.8) | .012/<.001 | 3 (3.1)/5 (5.2) | 0/1 (12.5) | 0/0 | 0/2 (8.3) | .712/.639 |
| Dendritic cells | 29 [20-35] | 28 [20-35] | .561 | 28 [20-35] | 28 [20-33] | 29 [18-42] | 23 [19-35] | .920 |
| % cases ↓5thp/↑95thp | - | 14 (10.2)/5 (3.6) | <.001/<.001 | 11 (11.7)/5 (5.3) | 0/0 | 1 (9.1)/0 | 2 (8.3)/0 | .755/.508 |
| Lymphocytes | 1675 [1332-2223] | 2221[1717-2563] | <.001 | 2294 [1854-2760] | 1990 [1555-2422] | 1660 [1379-2089] | 1998 [1619-2439] | .055 |
| % cases ↓5thp/↑95thp | - | 3 (2)/8 (6) | .012/<.001 | 1 (1.0)/6 (6.3) | 1 (12.5)/1 (12.5) | 1 (9.1)/0 | 0/1 (4.2) | .054/.683 |
| T cells | 1246 [943-1642] | 1652 [1348-1985] | <.001 | 1747 [1417-2003] | 1417 [1194-1938] | 1350 [1186-1621] | 1635 [1309-2018] | .102 |
| % cases ↓5thp/↑95thp | - | 1 (1)/10 (7) | .231/<.001 | 0/8 (8.3) | 0/1 (12.5) | 1 (9.1)/0 | 0/1 (4.2) | .304/.636 |
| NK cells | 260 [162-372] | 213 [137-321] | .427 | 237 [143-337] | 233 [142-281] | 120 [76-321] | 156 [137-248] | .230 |
| % cases ↓5thp/↑95thp | - | 9 (6.5)/6 (4.3) | <.001/.001 | 5 (5.2)/5 (5.2) | 0/0 | 3 (27.3)/0 | 1 (4.2)/1 (4.2) | .003/.791 |
| B cells | 154 [108-228] | 208 [158-297] | <.001 | 234 [175-327] | 233 [119-443] | 174 [153-188] | 181 [136-230] | .020 |
| % cases ↓5thp/↑95thp | - | 2 (1.4)/16 (11.5) | .053/<.001 | 1 (1.0)/10 (12.5) | 1 (12.5)/2 (25.0) | 0/0 | 0/2 (8.3) | .525/.362 |
| Plasma cells | 2 [0.8-3] | 0.8 [0.3-2] | <.001 | 0.9 [0.5-2] | 1 [0.2-1] | 0.4 [0.3-0.8] | 1 [0.3-2] | .362 |
| % cases ↓5thp/↑95thp | - | 11 (7.9)/1 (0.7) | <.001/0.231 | 7 (7.3)/1 (1.0) | 0/0 | 2 (18.2)/0 | 2 (8.3)/0 | .506/.929 |
NK, natural killer.
Values are expressed as the median [interquartile range] of cells/μL of blood or No. (%) of cases lower than 5th percentile (↓5thp) and higher than the 95th percentile (↑95thp) for each cell subset in age-matched healthy donors. Left P value for comparisons between healthy donors vs all participants. Right P value for comparison among the 4 participants groups. Comparisons between healthy donors vs all participants are adjusted for age and sex.
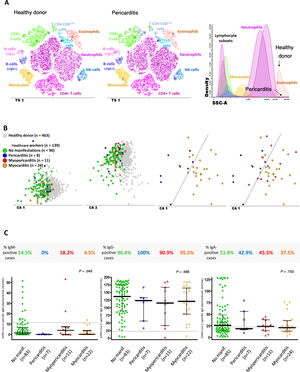
 and a participant diagnosed with pericarditis (middle plot) showing both increased Tab+CD4-CD8-/lo T cell and decreased eosinophil counts in blood. B: 2-dimensional graphical representation of multivariate canonical (linear discriminant) analysis plots showing the presence of overall different immune cell profiles in blood of the participants with past SARS-CoV-2 infection (n=139; colored circles) vs age-matched healthy donors (n=463; grey squares) (2 plots on the left); distinct immune cell profiles were also observed between participants diagnosed with pericarditis (blue circles) and myocarditis (orange circles); most myopericarditis cases (red circles) shared an altered immune cell profile in blood similar to that of myocarditis. C: frequency and amount of anti-SARS-CoV-2 antibodies measured in plasma of 123/139 participants. CA, canonical (correlation) analysis; IgG, immunoglobulin G; NK, natural killer; T-SNE, t-distributed stochastic neighbor embedding algorithm (abbreviated in the graphical representations as TS1); SCC, sideward light scatter (ie, cell granularity).")
Altered immune cell profiles and antibody serum levels in healthcare workers according to the presence vs absence of pericarditis, myopericarditis, or myocarditis. A: t-SNE graphical representation of the distribution of the major immune cell populations in blood of a healthy donor (plot on the left) and a participant diagnosed with pericarditis (middle plot) showing both increased Tab+CD4-CD8-/lo T cell and decreased eosinophil counts in blood. B: 2-dimensional graphical representation of multivariate canonical (linear discriminant) analysis plots showing the presence of overall different immune cell profiles in blood of the participants with past SARS-CoV-2 infection (n=139; colored circles) vs age-matched healthy donors (n=463; grey squares) (2 plots on the left); distinct immune cell profiles were also observed between participants diagnosed with pericarditis (blue circles) and myocarditis (orange circles); most myopericarditis cases (red circles) shared an altered immune cell profile in blood similar to that of myocarditis. C: frequency and amount of anti-SARS-CoV-2 antibodies measured in plasma of 123/139 participants. CA, canonical (correlation) analysis; IgG, immunoglobulin G; NK, natural killer; T-SNE, t-distributed stochastic neighbor embedding algorithm (abbreviated in the graphical representations as TS1); SCC, sideward light scatter (ie, cell granularity).
Compared with healthy donors, participants with clinically suspected pericarditis showed the highest median counts in blood of CD4-CD8-/lo (cytotoxic) T cells (46 vs 104 cells/μL; P=.003) and displayed particularly decreased numbers of eosinophils (157 vs 48 cells/μL; P=.049), as well as (similar to participants with clinically suspected myopericarditis and those with myocarditis) decreased blood counts of circulating plasma cells (1.7 vs 0.8, 0.4 and 0.7 cells/μL; P=.075, P=.018 and P=.004, respectively). In turn, patients with clinically suspected myocarditis more frequently had decreased neutrophil counts in blood (7 [29.2%]; P=.011), together with decreased NK-cell numbers (260 vs 156 cells/μL; P=.021). Finally, participants diagnosed with clinically suspected myopericarditis showed mixed immune profiles, which were preferentially shared with those of myocarditis (7 of the 11 cases; 63.6%) rather than pericarditis (4 of the 11 cases; 36.4%) (figure 5B).
Overall, no major differences were observed among participants with or without pericardial and myocardial involvement in the frequency and levels of anti-SARS-CoV-2- IgM, IgG and IgA antibodies in plasma (figure 5C). Importantly, overlapping immune profiles were detected between participants diagnosed by RT-PCR compared with those diagnosed by serology.
DISCUSSIONThis study examined the prevalence of clinically suspected pericarditis and myocarditis in a cohort of SARS-CoV-2-positive healthcare workers. In one of the largest cohort of participants with CMR imaging assessment reported so far, we demonstrate that pericardial and myocardial involvement is prevalent after SARS-CoV-2 infection in association with an altered immune response.
We decided to carry out a study in healthcare workers as this sector has been disproportionally infected in Spain, which provided us with the opportunity to study the prevalence of clinically suspected pericarditis and myocarditis in SARS-CoV-2-infected cases that were confirmed by positive RT-PCR or positive serology. In addition, because the proportion of female healthcare workers is high in Spain, our study does not underrepresent women who constituted more than two thirds of recruited participants. Unlike other observational studies suggesting that myocarditis may be slightly more prevalent in men than in women,14 men in our study had a lower prevalence of pericardial and myocardial involvement than women (7 [17.9%] vs 36 [36.0%]; P=.043). Recent findings suggest that the immune landscape in COVID-19 differs considerably between the sexes,15 with female patients having a more robust activation of T cells than men. Considering that pericarditis and myocarditis both stem from a T and B cell-mediated mechanism, our observation is of interest and provides new evidence indicating sex differences in the clinical outcomes of COVID-19 disease that should be corroborated in future studies.
Previous studies have reported the prevalence of myocardial injury after COVID-19.16–18 An initial retrospective observation in 26 recovered patients with COVID-19 pneumonia showing cardiac complaints during hospitalization revealed the presence of myocardial edema in 54% of the patients and late gadolinium enhancement in 31%.16 Observations similar to a prospective study in 100 patients recovered from COVID-19 pneumoniae were the presence of myocardial edema in 60% and late gadolinium enhancement in 32%.17 Our observations, performed mostly in nonhospitalized participants (83.5%) and also including participants diagnosed through serology (25.9%), showed lower percentages of CMR myocardial injury (specially myocardial edema) than the aforementioned studies and are more in agreement with the rates of myocardial injury observed in influenza—in which elevated cardiac enzymes, electrocardiographic, echocardiographic and histologic findings have been reported in approximately one third of cases.19 Two recent pathological studies in postmortem patients with COVID-19 pneumoniae have shown lymphocytic myocarditis in 14.3% and 26.7% of the cases, which is more in line with our finding (17.3% for isolated myocarditis and 25.2% for any degree of myocardial involvement on CMR).20,21 In addition, pericardial injury after COVID-19 is prevalent; a recent study in 54 consecutive student athletes with positive RT-PCR or serology to SARS-CoV-2 has shown pericardial inflammation with associated pericardial effusion in 39.5% of cases, which is similar to the 30.2% pericardial effusion observed in our study. Of note, athletes had increased native T1-relaxation time values in 19.0% individuals but native T2 findings were normal in all participants.22
Importantly, clinical assessment of our participants with suspected pericarditis and myocarditis showed clinical stability without any participants showing severe pericardial effusion, heart failure, or left ventricular dysfunction (only 3 participants with myocarditis showed wall motion abnormalities). However, follow-up studies are necessary to determine the outcome of cardiac sequelae observed even in asymptomatic and pauci-symptomatic participants after SARS-CoV-2 infection. The participants diagnosed with past infection through serology who were more likely to be asymptomatic or mildly symptomatic, and who might better represent the cases detected in population-wide seroprevalence studies,6,7 also showed a high prevalence of pericardial and myocardial manifestations although the prevalence was lower than in RT-PCR positive participants (7 [19.4%] vs 36 [35.0%]; P=.097).
At present, there is much interest in the long-term sequelae of COVID-19. It is intriguing that clinically suspected pericardial and myocardial manifestations were observed long after SARS-CoV-2 infection (more than 10 weeks after initial viral prodrome at infection) as well as in some currently asymptomatic participants (9 cases; 1 out of every 5 final clinically suspected cases of pericarditis, myopericarditis or myocarditis diagnoses). These long-term manifestations may be due to an inadequate innate and adaptative immune response with very limited data on the longer-term immunological consequences of past SARS-CoV-2 infection,5 and no study has specifically focused on the settings of pericarditis and clinically suspected myocarditis. In this study, in-depth investigation of the distribution of major and minor populations of immune cells in blood showed a high frequency of overall altered immune profiles.
Several of the immune cell alterations identified mimic abnormalities reported during active infection for the general population with COVID-19, including decreased eosinophil and NK cell counts.23 The overall pattern in this study emerges as a unique SARS-CoV-2-associated immune profile. For example, while decreased eosinophil counts in blood have been reported among participants infected with influenza,24 no association has yet been reported with increased counts of cytotoxic (CD4-CD8-/lo) T cells and plasmablasts in blood, which have been identified among HIV-infected participants in the absence of eosinopenia.25 More detailed analysis of the altered immune profiles among the different groups of participants showed that those with clinically suspected myopericarditis or myocarditis had closer to normal lymphocyte counts, but reduced numbers in blood of circulating eosinophils and NK cells. Such a unique profile mimics what has been described recently during the acute phase of SARS-CoV-2 infection, suggesting an ongoing cytotoxic response with increased tissue migration or death by apoptosis of specific subsets of cytotoxic cells. These findings suggest that a less pronounced (potentially insufficient) or a delayed humoral response may occur in these participants, which may lead to decreased neutralization, opsonization and/or clearance of the virus locally at the perimyocardium; local viral persistence would favor an increased tissue-homing (or early death) of eosinophils, immunomodulatory and intermediate monocytes, in addition to cytotoxic (effector) cells. Thus, similar to influenza,26 although SARS-CoV-2 pneumoniae is the most widely recognized complication, the coronavirus could trigger pericarditis or myocarditis as part of the host immune response rather than viral-mediated myocarditis per se. In this sense, cases of cardiac involvement are beginning to be described after the second dose of COVID-19 vaccine.27
LimitationsThe major limitation of this study is that clinically suspected myocarditis was not confirmed via endomyocardial biopsy. CMR T1 and T2 measures, although significant, were small between the participants with SARS-CoV-2 infection and the control group. The study analysis was limited to healthcare workers and therefore has limited external generalizability to other nonhealthcare settings. However, the strength of this study is the addition of nonhospitalized participants, as well as the inclusion of participants diagnosed with past SARS-CoV-2 infection through serology, who also had a high prevalence of pericardial and myocardial involvement.
CONCLUSIONSThis study shows that clinically suspected pericarditis and myocarditis are frequent in healthcare workers after SARS-CoV-2 infection, as well as in some currently asymptomatic individuals; in addition, we provide evidence for an altered immune cell distribution in blood which affects cells involved in both the innate (eg, eosinophils, monocytes and NK cells) and the adaptive cellular (eg, cytotoxic T cells) and humoral (e.g. B cells and plasma cells) immune responses. Pericardial and myocardial involvement after SARS-CoV-2 infection might then indirectly result from this host immune response. These observations may indicate that cardiac sequelae might occur late after SARS-CoV-2 infection.
FUNDINGThis study was supported by CIBERCV (CB16/11/00374), CIBERONC (CB16/12/00400) and the COV20/00386 grant from the Instituto de Salud Carlos III and FEDER, Ministerio de Ciencia e Innovación, Madrid, Spain, and by GRS COVID 26/A/20 from the Gerencia Regional de Salud, Junta de Castilla y León, Spain.
AUTHORS’ CONTRIBUTIONSR. Eiros and M. Barreiro-Pérez contributed equally to this work and share first authorship.
A. Orfao and P.L. Sánchez contributed equally to this work and share last authorship.
R. Eiros, M. Barreiro-Pérez, J. Almeida, J. L Bravo-Grande, A. Orfao, P. L. Sánchez conceived and designed the study; R. Eiros, M. Barreiro-Pérez, A. Orfao, P. L. Sánchez contributed to the literature search; R. Eiros, S. Merchán, I. Toranzo contributed with clinical evaluation of the participants; S. Merchán, C. Sánchez-Pablo, I. Toranzo, E. Díaz-Peláez, L. Macías-Álvarez contributed with clinical data collection; M. Barreiro-Pérez, A. Martín-García contributed to data analysis (CMR); E. Villacorta, D. González-Calle contributed to data analysis (ECG); A. Pérez-Pons, A. Torres-Valle, O. Pérez-Escurza, B. Fuentes-Herrero performed immunophenotypic and serology experiments and collected data; J. Almeida, B. Fuentes-Herrero, Gu. Oliva-Ariza, Q. Lecrevisse, R. Fluxa, A. Orfao contributed to data analysis and interpretation (immunophenotypic and serology); R. Eiros, M. Barreiro-Pérez, A. Martín-García, E. Villacorta, A. Orfao, P. L Sánchez contributed to clinical data analysis and interpretation; M. Barreiro-Pérez, J. Almeida, J. L. Bravo-Grande, A. Orfao, P. L. Sánchez contributed to writing of the report.
CONFLICTS OF INTERESTA. Orfao and J. Almeida report being one of the inventors on the EuroFlow-owned European patent 119646NL00 registered on November 2019 (“Means and methods for multiparameter flow cytometry based leukocyte subsetting”) and A. Orfao and J. Almeida are also authors of the PCT patent WO 2010/140885A1 (”Methods, reagents and kits for flow cytometric immunophenotyping”). The Infinicyt software is based on intellectual property of the University of Salamanca in Spain. All above mentioned intellectual property and related patents are licensed to Cytognos (Salamanca, ES) and Becton/Dickinson Biosciences (San José, California), and these companies pay royalties to the EuroFlow Consortium. These royalties are exclusively used for continuation of the EuroFlow collaboration and sustainability of the EuroFlow Consortium. There are no other conflicts of interest related to this study or for the remaining authors.
- -
There is increasing evidence of cardiac sequelae after SARS-CoV-2 infection.
- -
Although pericarditis and myocarditis are the 2 most frequent cardiac manifestations observed after a viral infection, peer-reviewed literature is limited to isolated case reports of pericarditis and small observations of myocarditis mainly in hospitalized RT-PCR patients with covid-19 pneumonia, which are insufficient to generalize conclusions about the true prevalence of pericardial and myocardial involvement after SARS-CoV-2 infection.
- -
No study has investigated the immunological consequences of SARS-CoV-2 infection in the settings of pericarditis and myocarditis.
- -
The prevalence of pericarditis and myocarditis, with clinical stability, after SARS-CoV-2 infection is high; up to 31% of cases and also in some presently asymptomatic participants (1 out of every 5 cases diagnosed), in association with notably altered immune cell profiles in blood.
- -
Female participants were more likely to have pericarditis or myocarditis.
- -
Clinical pericarditis and myocarditis are associated with specific immune cell profiles, paving the way for a better understanding of the immune mechanisms involved. In this regard, pericardial and myocardial involvement is beginning to be described after COVID-19 vaccination.
Supplementary data associated with this article can be found in the online version available at https://doi.org/10.1016/j.rec.2021.11.001