A large proportion of patients with coronary disease have metabolic syndrome, although the frequency and association of its different components are not well understood. The aim of this study was to determine the prevalence of metabolic syndrome and the combination of its components in a Spanish cohort of patients with acute coronary syndrome.
MethodsClinical histories of 574 inpatients with acute coronary syndrome in 6 tertiary hospitals were reviewed and the presence of metabolic syndrome and its components determined by applying Adult Treatment Panel III criteria. In a second step, the components of the metabolic syndrome were analyzed, excluding those patients with diabetes mellitus.
ResultsThe metabolic syndrome was present in 50.9% of patients and was more frequent in women than in men (66.3% vs. 47.3%; P<.001). The most prevalent component was carbohydrate metabolism disorder (85.3%), followed by low high-density lipoprotein cholesterol (HDLc) levels (80.5%). In nondiabetic patients, 34.6% had metabolic syndrome and the most prevalent component was low HDLc levels (86%), followed by high blood pressure and hypertriglyceridemia and, in fourth place, impaired fasting serum glucose levels.
ConclusionsThe metabolic syndrome has a high prevalence in patients with an acute coronary syndrome, especially in women. The most frequent components are hyperglycemia and low HDLc levels. After excluding diabetic patients, the most prevalent diagnostic criterion of metabolic syndrome was low HDLc levels.
Keywords
.
INTRODUCTIONThe metabolic syndrome (MS) is a combination of interrelated metabolic abnormalities that significantly increase the risk of cardiovascular disease, and type 2 diabetes mellitus (DM2).1, 2, 3, 4, 5, 6 Its prevalence is increasing worldwide and is a serious public health problem. Each component of MS is individually associated with an increased risk of cardiovascular disease; however, whether MS leads to greater cardiovascular risk than the sum of its components remains a matter of debate.7 It has been suggested that the number of MS components may be more useful in predicting cardiovascular disease than MS itself,8 since cardiovascular risk increases as the number of components increases.9, 10, 11 Similarly, given the heterogeneity of MS, the impact of the possible combinations of its components on predicting cardiovascular risk has been investigated. In this sense, DM2 is the predominant risk factor associated with the development of ischemic heart disease.7, 12
Some studies have analyzed the prevalence of MS in patients with acute coronary disease, reporting an estimated prevalence of 41%-50% in Europe and the United States.8, 13 In Spain, our group conducted a study 7 years ago that applied the European Group for the study of Insulin Resistance (EGIR) criteria and found a prevalence of 41% in patients with stable chronic ischemic heart disease.14
The definition of MS provided by the National Cholesterol Education Program-Adult Treatment Panel III (ATPIII) includes individuals with DM2. It is known that DM2 strongly increases the risk of cardiovascular disease, and in fact is considered equivalent to having suffered a coronary event in terms of cardiovascular risk.15, 16 Hence, some definitions of MS exclude DM2, such as that established by the EGIR or the American College of Endocrinology.17, 18 However, few studies have analyzed the frequency of the different components of MS and their associations in nondiabetic populations with coronary disease.11
The aim of the present study was to determine the prevalence of MS and the frequency and combination of its definitive components in patients with acute coronary syndrome (ACS) in Spain. We also analyzed all the previously mentioned variables in nondiabetic patients, in light of possible differences in the prevalence and association of the remaining components of MS.
METHODS Study PopulationClinical histories from inpatients with ACS admitted to coronary or intensive care units in 6 tertiary hospitals between January 2004 and September 2007 were selected based on the following inclusion criteria: a) availability of plasma high-density lipoprotein cholesterol (HDLc) measurements, and b) body mass index (BMI) determined during admission. ACS was defined according to the international guidelines for clinical practice.19, 20, 21 In total, 574 patients were included in the analysis.
In a second step, 309 patients underwent a second blood test for glycemia; the remaining 265 patients had a previous diagnosis of DM2 or fasting plasma glucose levels ≥ 126 mg/dL (7 mmol/L) at admission, subsequently tested and confirmed.
Definition of VariablesDemographic and clinical data were obtained from the clinical histories: age, sex, weight, height, previous atherosclerotic vascular disease (defined as previous coronary disease, stroke, or peripheral arterial disease), hypertension, DM2, a sedentary lifestyle (defined as performing less than 30min of moderate exercise 3 days per week), smoking, alcohol consumption, and previous lipid-lowering treatment. Individuals were classified as being nonsmokers, current smokers, and former smokers (patients who had quit smoking at least 3 months before admission). Fasting plasma glucose levels and lipid profile (total cholesterol, low density lipoprotein cholesterol [LDLc], cholesterol other than HDLc [non-HDLc], HDLc, and triglycerides) were measured. Total cholesterol and triglycerides were measured using an automated enzyme analyzer, and HDLc was measured after separation by precipitation. LDLc concentrations were calculated using the Friedewald formula whenever plasma triglyceride concentrations were<400mg/dL. Non-HDLc was calculated as total cholesterol minus HDLc. The diagnosis of MS was established using modified ATPIII criteria2 based on the presence of 3 or more of the following 5 factors: a) BMI >29 kg/m2 for men and >29.9 kg/m2 for women (replacing the ATPIII criterion of a waist circumference of ≥102cm for men and ≥88cm for women as an indirect estimation method)22, 23; b) hypertension, defined as clinical history of documented elevated blood pressure or persistent systolic blood pressure >130mmHg and diastolic blood pressure >85mmHg; c) hypertriglyceridemia, defined as fasting plasma triglyceride levels >150mg/dL previous to or within 24h of admission; d) low plasma HDLc values, defined as<40mg/dL (1.04 mmol/L) for men and<50mg/dL (1.3 mmol/L) for women, measured either before or within the first 24h of admission, and e) carbohydrate metabolism disorder, defined as previously documented impaired fasting plasma glucose levels or a history of DM2 or fasting plasma glucose levels >100mg/dL (5.6 mmol/L) at least 48h after admission.
Statistical AnalysisQuantitative variables are expressed as mean±standard deviation, and qualitative variables as absolute and relative frequencies. Normally distributed data were analyzed using the Student t-test to compare means; otherwise the Mann-Whitney U test was used. The χ2 test was used to analyze differences between qualitative variables. A P value of<.05 was used as a cutoff for statistical significance. All the statistical analyses were performed using the Statistical Package for the Social Sciences (SPSS) for Windows software, v. 15.0; Chicago, Illinois, United States.
RESULTSThe clinical characteristics of the study population are shown in Table 1. The total prevalence of MS using ATPIII criteria was 50.9% (292 patients). We found no MS components in 29 patients (5.1%), 1 in 96 (16.7%), 2 in 157 (27.4%), 3 in 135 (23.5%), 4 in 115 (20%), and all 5 in 42 (7.3%) patients. The most frequent component of MS was carbohydrate metabolism disorder, followed by reduced HDLc levels, hypertension, hypertriglyceridemia and, in last place, obesity.
Table 1. Clinical Characteristics of the 574 Spanish Patients With Acute Coronary Syndrome and Differences by Sex.
| All patients (n=574) | Men (n=467) | Women (n=107) | P | |
| Age (years) | 62.4±11.9 | 61.7±11.6 | 65.3±12.8 | .004 |
| Previous ischemic heart disease, % (n) | 43.8 (245) | 44.7 (204) | 39.8 (41) | .362 |
| Current smoker, % (n) | 41.6 (234) | 45 (206) | 26.7 (28) | <.001 |
| Former smoker, % (n) | 33.9 (191) | 37.8 (173) | 17.1 (18) | |
| Sedentary lifestyle, % (n) | 67.3 (302) | 67.8 (246) | 65.1 (56) | .637 |
| Alcohol consumer, % (n) | ||||
| 15-30 g/d | 12.7 (53) | 15.1 (50) | 3.5 (3) | <.001 |
| >30 g/d | 9.6 (40) | 11.8 (39) | 1.2 (1) | |
| BMI (kg/m2) | 28.4±4.2 | 28.4±3.8 | 28.7±4.2 | .395 |
| BMI <25, % (n) | 19.9 (114) | 16.9 (79) | 32.7 (35) | <.001 |
| BMI 25-30, % (n) | 49 (281) | 54.2 (253) | 27.1 (29) | |
| BMI >30, % (n) | 31.2 (179) | 28.9 (135) | 40.2 (43) | |
| DM2, % (n) | 34.4 (191) | 32.4 (146) | 42.9 (45) | .042 |
| Fasting plasma glucose (mg/dL) | 130.7±61.6 | 128.5±57.6 | 140±75.6 | .081 |
| Total cholesterol (mg/dL) | 187.1±46.2 | 187.1±45.8 | 187.5±48.9 | .922 |
| LDLc (mg/dL) | 120.5±42 | 121.7±42.4 | 115.9±40 | .203 |
| HDLc (mg/dL) | 40.4±11.6 | 40±11.2 | 43.1±13.5 | .007 |
| Non-HDLc (mg/dL) | 146.7±45.4 | 147.1±45.4 | 144.4±47 | .55 |
| Triglycerides (mg/dL) | 152.2±86.7 | 151.3±76.1 | 159.3±123.9 | .363 |
| Low HDLc+hypertriglyceridemia, % (n) | 31.4 (180) | 30.4 (142) | 35.5 (38) | .304 |
| Previous lipid-lowering therapy, % (n) | 35.7 (205) | 36 (168) | 34.6 (37) | .786 |
| Statins | 34 (195) | 34 (159) | 33.6 (36) | .937 |
| Fibrates | 2.3 (13) | 2.6 (12) | 0.9 (1) | .479 |
| Metabolic syndrome, % (n) | 50.9 (292) | 47.3 (221) | 66.4 (71) | <.001 |
| Carbohydrate metabolism disorder, % (n) | 66.2 (380) | 66.8 (312) | 63.6 (68) | .52 |
| Low HDLc, % (n) | 60.1 (345) | 57 (266) | 73.8 (79) | .001 |
| Hypertension, % (n) | 59.2 (340) | 57.2 (267) | 68.2 (73) | .036 |
| Hypertriglyceridemia, % (n) | 41.5 (238) | 41.3 (193) | 42.1 (45) | .89 |
| High BMI, % (n) | 31.7 (182) | 29.3 (137) | 42.1 (45) | .011 |
BMI, Body Mass Index; DM2, type 2 diabetes mellitus; HDLc, high-density lipoprotein cholesterol; LDLc, low-density lipoprotein cholesterol; non-HDL, cholesterol other than HDLc.
Values are expressed as mean±standard deviation, unless otherwise indicated.
Bold is used to underline data with standard deviation; the Student t-test was used for differences between means; the χ2 test was used for differences between proportions; high BMI, BMI>29 for men and>29.9 for women.
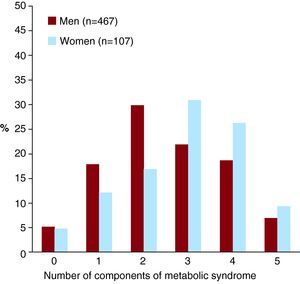
Women with ACS were older and had a higher prevalence of DM2; however, when the ATPIII criterion for carbohydrate metabolism disorder was applied, there were no significant differences between men and women (Table 1 and Figure 1). Although the mean BMI for both sexes was similar, a greater percentage of women had a BMI <25 kg/m2 or >30 kg/m2, whereas men were more frequently overweight. Mean HDLc levels were greater in women than in men, although a higher percentage of women had low HDLc levels when ATPIII criteria were applied. Men with ACS presented a greater frequency of current or previous alcohol consumption and smoking.

Figure 1. Frequency of the number of metabolic syndrome components by sex.
Women with ACS had a higher prevalence of MS (66.3% vs 47.3%; P<.001), and a greater number of MS components (median of 2 components for men and 3 for women; P=.004).
Analysis of the Patients Without Metabolic SyndromeIn total, 282 (49.1%) patients did not fulfill criteria for MS. The most frequent component present in the 96 patients with 1 MS component was carbohydrate metabolism disorder (39.6%, 38 patients), followed by low HDLc levels (27%, 26 patients) and hypertension (22.9%, 22 patients). Hypertriglyceridemia, as an isolated component of MS, was only found in 5 patients (5.2%); this was also the case for obesity.
Among those presenting 2 components (135 patients), the most frequent association was hypertension and carbohydrate metabolism disorder (28%, 44 patients), followed by low HDLc levels and carbohydrate metabolism disorder (17.8%, 28 patients).
Analysis of the Patients With Metabolic SyndromeIn total, 85.3% had carbohydrate metabolism disorder and the same percentage had low HDLc levels; 80.5% had hypertension, 65.4% had hypertriglyceridemia, and 51.7% had a BMI above the established cutoff point (Table 2).
Table 2. Characteristics of the Patients With Acute Coronary Syndrome According to the Presence or Absence of Metabolic Syndrome (n=574).
| Without MS (n=282) | With MS (n=292) | P | |
| Women, % (n) | 12.8 (36) | 24.3 (71) | <.001 |
| Age (years) | 62.3±12.7 | 62.4±11.1 | .891 |
| Previous atherosclerotic vascular disease, % (n) | 39.9 (110) | 47.7 (135) | .062 |
| Current smokers, % (n) | 42.1 (115) | 41 (119) | .928 |
| Former smokers, % (n) | 34.1 (93) | 33.8 (98) | |
| Sedentary lifestyle, % (n) | 61.7 (127) | 72 (175) | .021 |
| Alcohol consumers, % (n) | |||
| 15-30 g/day | 13 (25) | 12.5 (28) | .089 |
| >30 g/day | 8.8 (17) | 10.3 (23) | |
| BMI (kg/m2) | 26.8±3.5 | 30±4.2 | <.001 |
| BMI <25, % (n) | 27.3 (77) | 12.7 (37) | <.001 |
| BMI 25-30, % (n) | 61.7 (174) | 36.6 (107) | |
| BMI >30, % (n) | 11 (31) | 50.7 (148) | |
| DM2, % (n) | 18.4 (51) | 50.2 (140) | <.001 |
| Fasting plasma glucose (mg/dL) | 115.9±51.5 | 144.7±66.8 | <.001 |
| Total cholesterol (mg/dL) | 185.2±44.7 | 189±47.7 | .292 |
| LDLc (mg/dL) | 117±40.8 | 124±42.4 | .054 |
| HDLc (mg/dL) | 45±12.7 | 36.2±8.9 | <.001 |
| Non-HDLc (mg/dL) | 140.1±43.9 | 153.2±46.2 | .001 |
| Triglycerides (mg/dL) | 119.5±62.8 | 184.1±94.7 | <.001 |
| Low HDLc+hypertriglyceridemia, % (n) | 6.4 (18) | 55.5 (162) | <.001 |
| Components of MS | |||
| Carbohydrate metabolism disorder, % (n) | 46.5 (131) | 85.3 (249) | <.001 |
| Low HDLc, % (n) | 34 (96) | 85.3 (249) | |
| Hypertension, % (n) | 38.2 (105) | 80.5 (235) | |
| Hypertriglyceridemia, % (n) | 16.7 (47) | 65.4 (191) | |
| High BMI, % (n) | 11 (31) | 51.7 (151) |
BMI, Body Mass Index; DM2, type 2 diabetes mellitus; HDLc, high-density lipoprotein cholesterol; LDLc, low-density lipoprotein cholesterol; MS, metabolic syndrome; non-HDLc, cholesterol other than HDLc.
Values are expressed as mean±standard deviation, unless otherwise indicated.
Bold is used to underline data with standard deviation; the Student t-test was used for differences between means; the χ2 test was used for differences between proportions; high BMI, BMI>29 for men and>29.9 for women; low HDLc levels, HDLc levels<40 mg/dL for men and<50 mg/dL for women.
The patients with ACS and MS had a greater prevalence of a sedentary lifestyle and increased non-HDLc levels than the patients without MS, as well as a greater prevalence of diagnostic components of MS. No differences were observed between the 2 groups by age, smoking, or alcohol consumption (Table 2). There was a trend toward a greater prevalence of MS among patients who had previous atherosclerotic vascular disease (P=.062).
Analysis of the Patients Without Diabetes MellitusOf the initial cohort, 309 patients did not have diabetes and, of these patients, 107 (34.6%) presented MS (Table 3). The most prevalent component of MS was low HDLc levels, followed by hypertension, hypertriglyceridemia, fasting plasma glucose ≥100mg/dL and, finally, a BMI above the cutoff point.
Table 3. Characteristics of the Patients With Acute Coronary Syndrome According to the Presence or Absence of Metabolic Syndrome, Excluding Patients with Type 2 Diabetes Mellitus (n=309).
| Without MS (n=202) | With MS (n=107) | P | |
| Women, % (n) | 14.4 (29) | 18.7 (20) | .33 |
| Age (years) | 60.4±13 | 59.5±11.01 | .545 |
| Previous atherosclerotic vascular disease, % (n) | 33.8 (67) | 37.1 (39) | .613 |
| Current smokers, % (n) | 47.4 (93) | 48.6 (52) | .787 |
| Former smokers, % (n) | 30.6 (60) | 27.1 (29) | |
| Sedentary lifestyle, % (n) | 55.2 (79) | 67.4 (62) | .076 |
| Alcohol consumers, % (n) | |||
| 15-30 g/day | 10.7 (15) | 8.2 (7) | .394 |
| >30 g/day | 10 (14) | 14.1 (12) | |
| BMI (kg/m2) | 26.7±3.5 | 30.5±3.9 | <.001 |
| BMI <25, % (n) | 29.7 (60) | 5.6 (6) | <.001 |
| BMI 25-30, % (n) | 58.9 (119) | 40.2 (43) | |
| BMI >30, % (n) | 11.4 (23) | 54.2 (58) | |
| DM2, % (n) | NA | NA | NA |
| Fasting plasma glucose (mg/dL) | 95±12.4 | 101±14.9 | <.001 |
| Total cholesterol (mg/dL) | 187.5±43.1 | 195.2±42.7 | .126 |
| LDLc (mg/dL) | 118.6±40 | 129.7±40 | .032 |
| HDLc (mg/dL) | 43.9±11.6 | 36.6±8.1 | <.001 |
| Non-HDLc (mg/dL) | 143.2±28.9 | 159±42 | .002 |
| Triglycerides (mg/dL) | 123.9±66.4 | 180.5±64.6 | <.001 |
| Low HDLc+hypertriglyceridemia, % (n) | 8.9 (18) | 58.9 (63) | <.001 |
| Components of MS | |||
| Carbohydrate metabolism disorder, % (n) | 25.1 (50) | 60.4 (64) | <.001 |
| Low HDLc, % (n) | 39.6 (80) | 86 (92) | |
| Hypertension, % (n) | 38.1 (75) | 81.1 (86) | |
| Hypertriglyceridemia, % (n) | 21.8 (44) | 66.4 (71) | |
| High BMI, % (n) | 11.4 (23) | 55.1 (59) |
BMI, Body Mass Index; DM2, type 2 diabetes mellitus; HDLc, high-density lipoprotein cholesterol; LDLc, low-density lipoprotein cholesterol; MS, metabolic syndrome; non-HDLc, cholesterol other than HDLc.
Values are expressed as mean±standard deviation, unless otherwise indicated.
Bold is used to underline data with standard deviation; the Student t-test was used for differences between means; the χ2 test was used for differences between proportions; high BMI, BMI>29 for men and>29.9 for women; low HDLc levels, HDLc levels<40 mg/dL for men and<50 mg/dL for women.
When we assessed the most prevalent ATPIII factors in the patients with MS, 160 patients (54.8%) fulfilled the triad of low HDLc levels, hypertension, and carbohydrate metabolism disorder; the most prevalent tetrad (89 patients) was low HDLc levels, hypertension, hypertriglyceridemia, and carbohydrate metabolism disorder (Table 4).
Table 4. Most Frequent Combinations of the Metabolic Syndrome Components.
| All patients with MS | Patients with MS without DM2 | |
| Triads | (n=292) | (n=107) |
| BMI+HTG+AHT | 23.3 (68) | 24.3 (26) |
| BMI+HTG+l-HDLc | 25 (73) | 25.2 (27) |
| BMI+HTG+IGT | 25.3 (74) | 16.8 (18) |
| BMI+l-HDLc+AHT | 31.5 (92) | 31.8 (34) |
| BMI+l-HDLc+IGT | 32.2 (94) | 17.8 (19) |
| BMI+AHT+IGT | 32.9 (96) | 20.6 (22) |
| HTG+l-HDLc+AHT | 38.7 (113) | 42.1 (45) |
| HTG+AHT+IGT | 39 (114) | 24.3 (26) |
| HTG+l-HDLc+IGT | 44.9 (131) | 29.9 (32) |
| I-HDLc+AHT+IGT | 54.8 (160) | 35.5 (38) |
| Tetrads | (n=157) | (n=42) |
| BMI+HTG+l-HDLc+AHT | 33.1 (52) | 45.2 (19) |
| BMI+HTG+AHT+IGT | 35 (55) | 31 (13) |
| BMI+HTG+l-HDLc+IGT | 36.9 (58) | 28.6 (12) |
| BMI+l-HDLc+AHT+IGT | 45.2 (71) | 31 (13) |
| HTG+l-HDLc+AHT+IGT | 56.7 (89) | 50 (21) |
| With all the components | (n=42) | (n=9) |
AHT, hypertension; BMI, body mass index; DM2, type 2 diabetes mellitus; HTG, hypertriglyceridemia; IGT, carbohydrate metabolism disorder; l-HDLc, high-density lipoprotein cholesterol levels; MS, metabolic syndrome.
Values are expressed as % (n); BMI>29 for men and>29.9 for women; l-HDLc<40 mg/dL for men and<50 mg/dL for women.
In the patients without diabetes, the most prevalent triad of ATPIII factors was low HDLc levels, hypertension, and hypertriglyceridemia; the most prevalent tetrad was low HDLc levels, hypertension, hypertriglyceridemia, and impaired fasting plasma glucose levels.
DISCUSSION Prevalence of Metabolic SyndromeThe present study found that patients with ACS had a high prevalence of MS (50.9%). This percentage is similar to that described in other populations with atherosclerotic vascular disease. In a previous Spanish study conducted with patients in secondary prevention, the prevalence of MS was 41% when EGIR criteria were applied.14
In general population studies conducted in the United States, the prevalence of MS was 24%24 whereas in a Spanish working population the prevalence was 10.2%-13.4% and was much higher in men than in women.25, 26
The fact that the prevalence of MS is higher in populations with ACS than in the general population demonstrates the association between MS and ischemic heart disease. It has recently been confirmed that MS is an independent predictor of ACS in patients in secondary prevention.27 In this sense, the present study shows that MS tends to be more prevalent in patients with previous atherosclerotic vascular disease.
Although the prevalence of MS is greater in men than in women in the general population,26 our study suggests that MS is more prevalent in women than in men (66.3% vs 47.3%), which is similar to the results obtained in other populations with ischemic heart disease.28, 29, 30, 31 This can be attributed, at least in part, to the fact that in the present study the women with ACS were older and presented a higher prevalence of obesity and DM2; these results are consistent with those of other similar studies.32, 33 On the other hand, the men presented a greater frequency of smoking, an important cardiovascular risk factor that is not taken into account in the diagnosis of MS. Furthermore, although the HDLc concentrations were slightly higher in women, there was a greater frequency of low HDLc levels when ATPIII criteria were applied. Taking this into account, we can assume that MS is an important marker of cardiovascular risk among women.
Components of Metabolic SyndromeMS increases cardiovascular risk and each of its components is associated with an increased risk of cardiovascular disease. Recent studies have shown that MS does not increase cardiovascular risk more than the sum of its components.7, 34 Some works have suggested that the number of markers of MS can be more useful then MS itself in predicting cardiovascular disease8, and that the risk of cardiovascular disease increases as the number of MS components increases.9, 10, 11
Recently, there has been growing interest in the components of MS, not only in relation to the number present but also their different combinations, in the prediction of cardiovascular risk. In our cohort, hyperglycemia and low HDLc levels were the most prevalent components of MS, followed by hypertension. In a recent study,35 this was also the most frequent combination observed in patients with ischemic heart disease. Other studies have shown that the combination of DM and hypertension sharply increases cardiovascular risk.12
The principal guidelines recommend lowering LDLc levels as the main strategy for the primary and secondary prevention of cardiovascular risk, both in diabetic and nondiabetic patients.36 However, despite achieving strong reductions in LDLc concentrations, even to “optimal” levels, the number of people who continue to present clinical complications of atherosclerosis remains very high. This is known as “residual risk”, and is found in 65% to 75% of patients at 5 years compared to controls.37, 38, 39 Residual risk depends to a great extent on low HDLc levels.
Multiple observational and prospective epidemiological studies have demonstrated that HDLc concentrations are inversely and independently associated with the development of ischemic heart disease.40 However, the prevalence of low HDLc levels remains high in around 40% of European dyslipidemic patients, despite statin therapy,41 and in up to 45% of patients with DM2.42 The ATPIII concluded that low HDLc concentrations and high triglyceride levels are cardiovascular risk factors, regardless of LDLc levels.2
The association in the same patient of increased triglyceride levels and low HDLc concentrations is usually associated with an increase in small, dense, LDLc particles, and these are considered to be highly atherogenic.43 This profile, known as atherogenic dyslipidemia, is very common in patients with MS and DM2.44, 45
Statin therapy effectively lowers LDLc levels, but has little effect on triglyceride and HDLc concentrations.
Our study demonstrates the high prevalence of low HDLc levels in patients with ACS in Spain, both in diabetic and nondiabetic patients. There is increasing evidence that treatment of patients with MS and/or DM2 should not be exclusively aimed at lowering LDLc levels, but should also aim to increase HDLc levels.39, 46
LimitationsOur study presents several limitations, given its retrospective design. As the figures for waist circumference were unavailable, we used BMI as an indirect estimation; this method is widely accepted in previous studies,10, 24, 47 as there is a direct correlation between BMI and waist circumference.22, 48 In addition, a standardized estimation method is available for measuring waist circumference in relation to the BMI percentiles for the Spanish population,23 and thus can be adapted to the cutoff points established for the diagnosis of MS. Even so, the prevalence of abdominal obesity may have been underestimated. Despite this, the prevalence of MS in our population is similar to that reported by other studies.8, 13, 14
When assessing lipid profile, falsely low HDLc concentrations may be observed in the presence of acute-phase reactants, as may occur after an ACS. In order to mitigate this effect, blood samples were extracted within the first 24h after the cardiovascular episode if no blood test had been performed previously, since decreased HDLc and triglyceride levels are of little relevance during this period.49, 50 Although 34% of the patients were undergoing treatment with statins, their effect on HDLc concentrations is marginal. Nevertheless, the prevalence of low HDLc levels in this population is very high.
CONCLUSIONSThe present study shows a high prevalence of MS in patients with ACS.
Women with ACS show a higher prevalence and a greater number of components of MS than men.
The most prevalent components of the MS were hyperglycemia and low HDLc concentrations, followed by hypertension. When diabetic patients were excluded from the analysis, the most prevalent components of MS in this population were low HDLc levels, followed by hypertension.
Conflicts of interestNone declared.
Received 12 January 2011
Accepted 2 March 2011
Corresponding author: Departament de Medicina, Universitat de València, Avda. Blasco Ibáñez 15, 46010 Valencia, Spain. Antonio.Hernandez@uv.es