Current therapeutic options for severe aortic stenosis (AS) include transcatheter aortic valve implantation (TAVI) and surgical aortic valve replacement (SAVR). Our aim was to describe the prognosis of patients with severe AS after the decision to perform an intervention, to study the variables influencing their prognosis, and to describe the determinants of waiting time > 2 months.
MethodsSubanalysis of the IDEAS (Influence of the Severe Aortic Stenosis Diagnosis) registry in patients indicated for TAVI or SAVR.
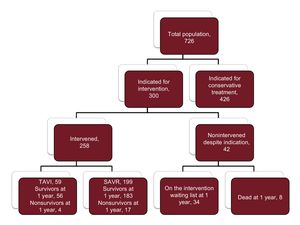
ResultsOf 726 patients with severe AS diagnosed in January 2014, the decision to perform an intervention was made in 300, who were included in the present study. The mean age was 74.0 ± 9.7 years. A total of 258 (86.0%) underwent an intervention: 59 TAVI and 199 SAVR. At the end of the year, 42 patients (14.0%) with an indication for an intervention did not receive it, either because they remained on the waiting list (34 patients) or died while waiting for the procedure (8 patients). Of the patients who died while on the waiting list, half did so in the first 100 days. The mean waiting time was 2.9 ± 1.6 for TAVI and 3.5 ± 0.2 months for SAVR (P = .03). The independent predictors of mortality were male sex (HR, 2.6; 95%CI, 1.1-6.0), moderate-severe mitral regurgitation (HR, 2.6; 95%CI, 1.5-4.5), reduced mobility (HR, 4.6; 95%CI, 1.7-12.6), and nonintervention (HR, 2.3; 95%CI, 1.02-5.03).
ConclusionsPatients with severe aortic stenosis awaiting therapeutic procedures have a high mortality risk. Some clinical indicators predict a worse prognosis and suggest the need for early intervention.
Keywords
Aortic stenosis (AS) is the most frequent heart valve disease in developed countries.1,2 AS is especially common in persons older than 75 years, among whom its prevalence is more than 3%,2,3 and prognosis is poor once symptoms appear.4 Prognosis is improved by surgical aortic valve replacement (SAVR), and this procedure has been proposed as a treatment option even for patients with asymptomatic severe AS.5 Moreover, for symptomatic patients at high or intermediate surgical risk with SAVR, transcatheter aortic valve implantation (TAVI) has emerged as an alternative strategy.6,7 Nevertheless, many patients with severe AS receive neither intervention and are treated conservatively. There are several reasons for this, but one of the most important factors is the waiting-list length for these procedures, which results in some patients dying before the assigned intervention.4,8–12 Waiting times are long because interventions are generally not performed immediately after the decision to perform them. Given the notable mortality rate among AS patients, waiting times for intervention have a predominant influence.13
In this substudy of the IDEAS registry (Influence of the Severe Aortic Stenosis Diagnosis),9,12,14 the aim was to describe the real-world clinical course of patients diagnosed with severe AS and indicated for aortic valve intervention. The study also assessed prognostic indicators and the factors that determine an intervention waiting time > 2 months.
METHODSThe IDEAS registry14 prospectively included consecutive patients with severe AS diagnosed by transthoracic ultrasound at 48 Spanish centers during January 2014; the diagnostic criteria were a mean gradient ≥ 40mmHg or an aortic valve area < 1cm2 calculated by the continuity equation,15 together with an absence of previous valve intervention. The 1-year follow-up assessment recorded vital status and surgical or transcatheter valve intervention. Treatment centers were classified according to their capacity for intervention by surgery or catheterization and whether they had a TAVI program.14
The present substudy included all patients with an indication for intervention and who accepted the recommendation. The decision to perform an intervention was taken according to clinical practice guidelines at the time of inclusion in January 2014. The 1-year follow-up assessment recorded whether patients had undergone SAVR or TAVI or were still on the waiting list. The starting point for calculating mean time to intervention was the decision to intervene (January 2014). The recommended waiting time from decision to intervention was set at < 2 months.16,17
Prognostic indicators of mortality were identified from an evaluation of patient clinical characteristics, echocardiography data, the Charlson comorbidity index,18 and the European System for Cardiac Operative Risk Evaluation (EuroSCORE II).19 Cardiac deaths were defined as those due to heart failure, sudden cardiac death, or myocardial infarction.
Statistical AnalysisQuantitative variables are expressed as mean ± standard deviation, and categorical variables are expressed as number and percentage. Between-group comparisons of categorical variables were made by the chi-square test or the Fisher exact test for parametric data. For nonparametric distributions, the Wilcoxon rank sum test was used. Quantitative variables were compared using the Student t test for the analysis of 2 groups or analysis of variance for more than 2 groups. Factors determining an intervention waiting time > 2 months were analyzed by multivariate logistic regression including all variables associated with a waiting time > 2 months at P < .10 in the univariate analysis. Potential covariates in the logistic regression were assessed by sequential inclusion and exclusion, with inclusion and exclusion thresholds of P < .05 and P > .1, respectively. Independent predictors of mortality were determined with a Cox regression model that included all variables associated with mortality at P < .1 in the univariate analysis. Potential covariates in the Cox regression were assessed by sequential inclusion and exclusion, with thresholds of P < .05 and P > .1, respectively. All tests were conducted with 2-tailed pairwise comparisons. Statistical analysis was performed using STATA, version 14.1.
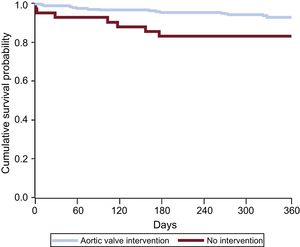
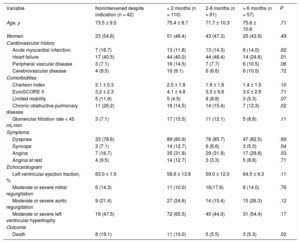
RESULTSOf the 726 AS patients in the IDEAS registry, 300 were candidates for intervention (290 with symptomatic AS and 10 with ventricular dysfunction). These 300 patients were the subject of this substudy; the remaining patients were assigned to conservative treatment. The mean age of the substudy population was 74.0 ± 9.7 years, and 155 patients (51.7%) were men. During the 1-year observation period, 258 patients (86%) underwent intervention, 199 by SAVR and 59 by TAVI (all via the transfemoral route). Patient characteristics are summarized in Table 1, with patients grouped according to nonintervention and the time between the recommendation date and intervention (< 2 months, 2-6 months, > 6 months). The baseline characteristics were similar in the 4 groups, although a history of heart failure was less frequent among patients intervened more than 6 months after diagnosis, and chronic lung disease was more frequent among those not intervened during the study period. Mortality was highest among nonintervened patients and lowest among those intervened 2 months or more after inclusion. Of the 42 patients with an indication for intervention but who did not receive it, 8 died during the study period (Figure 1). All 8 deaths were due to a cardiac cause: 3 to myocardial infarction, 4 to heart failure, and 1 to sudden cardiac death. Half of the waiting-list deaths occurred during the first 100 days after inclusion (Figure 2). The mean time to intervention was higher for SAVR than for TAVI (3.5 ± 0.2 months vs 2.9 ± 1.6 months; P = .03). Of the 42 nonintervened patients, 29 were assessed in tertiary hospitals and 13 in hospitals with no cardiac surgery service. Of the 8 nonintervened patients who died, 4 were assessed in tertiary hospitals and 4 in hospitals lacking a cardiac surgery service. Center type was not an independent predictor of waiting time or prognosis.
Characteristics of Nonintervened and Intervened Aortic Stenosis Patients Grouped According to Time on the Intervention Waiting List
| Variable | Nonintervened despite indication (n = 42) | < 2 months (n = 110) | 2-6 months (n = 91) | > 6 months (n = 57) | P |
|---|---|---|---|---|---|
| Age, y | 73.5 ± 9.5 | 75.4 ± 8.7 | 71.7 ± 10.3 | 75.6 ± 10.6 | .71 |
| Women | 23 (54.8) | 51 (46.4) | 43 (47.3) | 25 (43.9) | .49 |
| Cardiovascular history | |||||
| Acute myocardial infarction | 7 (16.7) | 13 (11.8) | 13 (14.3) | 8 (14.0) | .62 |
| Heart failure | 17 (40.5) | 44 (40.0) | 44 (48.4) | 14 (24.6) | .01 |
| Peripheral vascular disease | 3 (7.1) | 16 (14.5) | 7 (7.7) | 6 (10.5) | .06 |
| Cerebrovascular disease | 4 (9.5) | 10 (9.1) | 6 (6.6) | 6 (10.5) | .72 |
| Comorbidities | |||||
| Charlson index | 2.1 ± 0.3 | 2.0 ± 1.8 | 1.9 ± 1.8 | 1.4 ± 1.5 | .10 |
| EuroSCORE II | 3.2 ± 2.3 | 4.1 ± 4.8 | 3.3 ± 6.6 | 3.0 ± 2.6 | .71 |
| Limited mobility | 5 (11.9) | 5 (4.5) | 8 (8.8) | 3 (5.3) | .07 |
| Chronic obstructive pulmonary disease | 11 (26.2) | 16 (14.5) | 14 (15.4) | 7 (12.3) | .02 |
| Glomerular filtration rate < 45 mL/min | 3 (7.1) | 17 (15.5) | 11 (12.1) | 5 (8.8) | .11 |
| Symptoms | |||||
| Dyspnea | 33 (78.6) | 89 (80.9) | 78 (85.7) | 47 (82.5) | .69 |
| Syncope | 3 (7.1) | 14 (12.7) | 6 (6.6) | 3 (5.3) | .04 |
| Angina | 7 (16.7) | 35 (31.8) | 29 (31.9) | 17 (29.8) | .03 |
| Angina at rest | 4 (9.5) | 14 (12.7) | 3 (3.3) | 5 (8.8) | .71 |
| Echocardiogram | |||||
| Left ventricular ejection fraction, % | 63.0 ± 1.9 | 58.6 ± 13.8 | 59.0 ± 12.0 | 64.5 ± 9.3 | .11 |
| Moderate or severe mitral regurgitation | 6 (14.3) | 11 (10.0) | 16(17.6) | 8 (14.0) | .76 |
| Moderate or severe aortic regurgitation | 9 (21.4) | 27 (24.6) | 14 (15.4) | 15 (26.3) | .12 |
| Moderate or severe left ventricular hypertrophy | 19 (47.5) | 72 (65.5) | 40 (44.0) | 31 (54.4) | .17 |
| Outcome | |||||
| Death | 8 (19.1) | 11 (10.0) | 5 (5.5) | 3 (5.3) | .02 |
Quantitative variables are expressed as mean ± standard deviation and categorical variables as No. (%). P values refer to differences among the 4 groups (linear model ANOVA).
. SAVR, surgical aortic valve replacement; TAVI, transcatheter aortic valve implantation.")

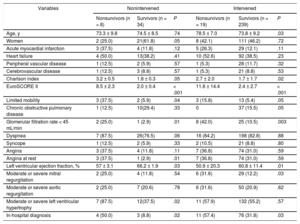
The clinical characteristics of survivors and patients who died during the 1-year observation period are summarized in Table 2, for both the nonintervened and the intervened groups. For nonintervened and intervened patients alike, the variables associated with mortality were the Charlson index, the EuroSCORE II, limited mobility, kidney disease, a low left ventricular ejection fraction, and an in-hospital diagnostic echocardiogram. Independent predictors of mortality and an intervention waiting time > 2 months are summarized in Table 3. Repetition of the multivariate analysis with omission of the “intervention” variable produced no major alterations in the other predictors. The choice of scheduled procedure (TAVI or SAVR) showed no association with mortality, despite the older age of patients assigned to TAVI (79.9 ± 5.6 years vs 69.7 ± 10.2 years; P = .002).
Clinical Characteristics of Nonsurvivors and Survivors Among Nonintervened Patients and Patients Undergoing Intervention During the 1-Year Study Period
| Variables | Nonintervened | Intervened | ||||
|---|---|---|---|---|---|---|
| Nonsurvivors (n = 8) | Survivors (n = 34) | P | Nonsurvivors (n = 19) | Survivors (n = 239) | P | |
| Age, y | 73.3 ± 9.8 | 74.5 ± 8.5 | .74 | 78.5 ± 7.0 | 73.8 ± 9.2 | .03 |
| Women | 2 (25.0) | 21(61.8) | .05 | 8 (42.1) | 111 (46.2) | .72 |
| Acute myocardial infarction | 3 (37.5) | 4 (11.8) | .12 | 5 (26.3) | 29 (12.1) | .11 |
| Heart failure | 4 (50.0) | 13(38.2) | .41 | 10 (52.6) | 92 (38.5) | .23 |
| Peripheral vascular disease | 1 (12.5) | 2 (5.9) | .57 | 1 (5.3) | 28 (11.7) | .32 |
| Cerebrovascular disease | 1 (12.5) | 3 (8.8) | .57 | 1 (5.3) | 21 (8.8) | .53 |
| Charlson index | 3.2 ± 0.5 | 1.8 ± 0.3 | .05 | 2.7 ± 2.0 | 1.7 ± 1.7 | .02 |
| EuroSCORE II | 8.5 ± 2.3 | 2.0 ± 0.4 | < .001 | 11.6 ± 14.4 | 2.4 ± 2.7 | < .001 |
| Limited mobility | 3 (37.5) | 2 (5.9) | .04 | 3 (15.8) | 13 (5.4) | .05 |
| Chronic obstructive pulmonary disease | 1 (12.5) | 10(29.4) | .33 | 0 | 37 (15.5) | .05 |
| Glomerular filtration rate < 45 mL/min | 2 (25.0) | 1 (2.9) | .01 | 8 (42.0) | 25 (10.5) | .003 |
| Dyspnea | 7 (87.5) | 26(76.5) | .06 | 16 (84.2) | 198 (82.8) | .88 |
| Syncope | 1 (12.5) | 2 (5.9) | .33 | 2 (10.5) | 21 (8.8) | .80 |
| Angina | 3 (37.5) | 4 (11.8) | .11 | 7 (36.8) | 74 (31.0) | .59 |
| Angina at rest | 3 (37.5) | 1 (2.9) | .01 | 7 (36.8) | 74 (31.0) | .59 |
| Left ventricular ejection fraction, % | 57 ± 3.1 | 66.2 ± 1.9 | .03 | 50.9 ± 20.3 | 60.8 ± 11.4 | .01 |
| Moderate or severe mitral regurgitation | 2 (25.0) | 4 (11.8) | .54 | 6 (31.6) | 29 (12.2) | .03 |
| Moderate or severe aortic regurgitation | 2 (25.0) | 7 (20.6) | .78 | 6 (31.6) | 50 (20.9) | .62 |
| Moderate or severe left ventricular hypertrophy | 7 (87.5) | 12(37.5) | .02 | 11 (57.9) | 132 (55.2) | .57 |
| In-hospital diagnosis | 4 (50.0) | 3 (8.8) | .02 | 11 (57.4) | 76 (31.8) | .03 |
Quantitative variables are expressed as mean ± standard deviation and categorical variables as No. (%).
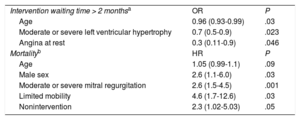
Independent Predictors of Intervention Waiting Time and Mortality
| Intervention waiting time > 2 monthsa | OR | P |
| Age | 0.96 (0.93-0.99) | .03 |
| Moderate or severe left ventricular hypertrophy | 0.7 (0.5-0.9) | .023 |
| Angina at rest | 0.3 (0.11-0.9) | .046 |
| Mortalityb | HR | P |
| Age | 1.05 (0.99-1.1) | .09 |
| Male sex | 2.6 (1.1-6.0) | .03 |
| Moderate or severe mitral regurgitation | 2.6 (1.5-4.5) | .001 |
| Limited mobility | 4.6 (1.7-12.6) | .03 |
| Nonintervention | 2.3 (1.02-5.03) | .05 |
HR, hazard ratio; OR, odds ratio.
This substudy analyzed mean intervention waiting time and mortality predictors in severe AS patients assigned to aortic valve intervention. Identified mortality risk factors were male sex, moderate or severe mitral regurgitation, and nonintervention. Knowledge of these risk factors has the potential to help identify high-risk patients who would benefit from early intervention or close clinical management.
Only 36% of patients in the IDEAS registry received aortic valve intervention, with all other patients managed conservatively.14 This percentage is nevertheless similar to the rates reported in earlier studies; for example, it is slightly higher than the 32% of intervened patients reported in a recent retrospective study20 and equal to the rate in another population studied over 5 years.16
The waiting time for cardiac surgery is a major influence on patient prognosis. Waiting-list mortality varies with the type of scheduled surgery and is higher among patients waiting for valve intervention.21 Published data reveal wide variation in mean time to intervention,17 and in recent years there have been calls to establish standardized priority criteria for scheduling interventions.22 The patients in the current study experienced longer waiting times than reported for a cohort in Chicago.16 In that study, intervention was performed within 6 weeks of indication in 83% of patients assigned to SAVR and 61% of those assigned to TAVI, in marked contrast to the long waiting times found in the current analysis. The shorter mean waiting time for TAVI than for SAVR in the present study likely reflects the influence of multiple factors, including logistic considerations. Simlarly, the differences between waiting times in the present study and the Chicago cohort may be explained, at least in part, by the inherent structural differences between the health care systems concerned.
In the IDEAS registry, the mortality rate among patients assigned to intervention but who had not received it after 1 year (19%) is comparable with previous reports for a similar study period.13,16,23,24 Moreover, half of the waiting-list deaths occurred in the first 100 days after recommendation, underlining the need to identify patients at high risk and schedule early intervention. Indicators of poor prognosis included limited mobility, male sex, and significant mitral regurgitation. Some of these variables are risk factors for AS patients,25–27 and previous evidence indicates that TAVI increases mortality in patients with mitral regurgitation.28
Higher mortality has been reported for patients awaiting TAVI than for those awaiting SAVR, probably reflecting the more advanced age of TAVI candidates and their higher rate of comorbidities.16 However, in the the present study, the mortality rate was similar for both patient groups. Furthermore, we did not detect the previously reported negative prognostic impact of cardiovascular-associated comorbidities such as diabetes mellitus and kidney disease.29 In contrast, associations with increased mortality risk were found for limited mobility and male sex. In a study of patients treated by TAVI, preintervention mortality was higher in women than in men30; however, despite increased rates of vascular complications and major bleeding, mortality in that study was lower in women at 1 year postintervention, consistent with the data presented here. The predictors of a poor clinical course reported here are similar to those identified in other series.13,16,23
There are no recommended intervention waiting times established for patients with severe AS; however, it is important to consider certain factors when deciding the timing of aortic valve intervention. Currently, these interventions are predominantly elective procedures; moreover, waiting times vary from center to center17 and depend on the resources available and the particular health care system in operation. Mortality in the IDEAS registry was highest in nonintervened patients, whereas it was lowest among those undergoing intervention after 2 months on the waiting list. In our view, this likely reflects the higher risk that patients with severe disease will die when kept on a waiting list for an extended period. It is therefore likely that better results would be obtained if high-risk patients were to undergo intervention earlier, as a semiurgent procedure. Supporting this view, a recent Spanish study of patients with an indication for TAVI found that a waiting time < 3 months was more cost-effective than longer periods.31 The clinical decision to recommend TAVI or to SAVR according to surgical risk should be combined with estimates of possible waiting time and mortality. The factors associated with increased risk reported here could help to determine the best option and are easily obtained from patient medical histories; they should therefore be analyzed systematically.
LimitationsThis study has the limitations inherent to an observational study, including the lack of intergroup comparability and the possible existence of confounding effects between waiting time and other prognostic characteristics; the findings should therefore be analyzed with caution. The small number of waiting-list deaths during the 1-year obervation period also limits the rigor of the findings in these patients. Decisions to intervene were taken by the physicians in charge, without recourse to a standardized protocol. There are no records of emerging comorbidities among the nonintervened patients; however, these would have been absent in January 2014, appearing only later in the observation year, and we think that this would have been a rare occurrence. Finally, patients were not randomized to the intervened and nonintervened groups, thus limiting the information that can be obtained on the prognostic implications of performing an intervention. Nevertheless, half of the deaths among nonintervened patients occurred during the first 100 days after the recommendation date, and the data obtained thus suggest the advisability of carrying out aortic valve interventions as soon as possible after indication.
CONCLUSIONSPatients with severe AS on the intervention waiting list are at high risk of death. Waiting times for SVAR are longer than for TAVI. Clinical indicators associated with poor prognosis are available that could be used to prioritize patients for early intervention.
CONFLICTS OF INTERESTE. Abu-Assi is an Associate Editor at the Revista Española de Cardiología.
- –
Symptomatic severe AS is associated with a high 1-year mortality, and the only available treatments are SAVR or TAVI. Nevertheless, patients with an indication for intervention seldom receive it immediately.
- –
For various reasons, waiting times to intervention are highly variable across geographic regions; moreover, previous studies have reported different mortality rates among patients experiencing long delays before intervention.
- –
Despite this, in Spain there are no published multicenter data on patient mortality that would allow clinicians to estimate the magnitude of the problem. Moreover, there is a lack of information about which patients are at a higher risk of dying while on the intervention waiting list.
- –
In a large Spanish multicenter registry, 14% of patients with an indication for an aortic valve intervention had not received it 1 year after their inclusion. The mortality rate among these patients was 19%.
- –
Elevated mortality risk was independently associated with easily identifiable clinical factors, including significant mitral regurgitation, male sex, and limited mobility.
.
We thank Dr. Enrique Gutiérrez Ibañes for his invaluable help in the execution of this study.