There is growing interest in pulse wave velocity (PWV) and central aortic systolic pressure (CASP) as cardiovascular disease risk markers that go beyond conventional (brachial) blood pressure (BP).1,2 Pulse wave velocity estimates arterial stiffness, and CASP is representative of the “true” BP in major organs. Both parameters can now be reliably estimated through brachial cuff-based oscillometric methods3; however, their clinical usefulness is limited by the scarcity of normative data.
Two major international studies have reported pooled normative PWV and CASP values,4,5 but neither included Spanish data. Therefore, this is the first study to report normative values for these parameters in older adults in Spain.
Data were taken from 1824 community-dwelling adults aged ≥ 65 years belonging to the third wave of the Seniors-ENRICA study, a cohort set up in Spain from 2008 to 2010, which has had CASP and PWV data since 2014-2015.6 Participants gave written consent, and the study was approved by the La Paz Hospital Clinical Research Ethics Committee.
Fasting lipids and glucose were analyzed in a central laboratory. Participants reported diagnosed cardiovascular disease. Diabetes was defined as glucose ≥ 126mg/dL, previous diagnosis, or current treatment; dyslipidemia as total cholesterol ≥ 240mg/dL, low-density lipoprotein cholesterol ≥ 160mg/dL, high-density lipoprotein cholesterol ≤ 40mg/dL (men) and ≤ 50mg/dL (women), triglycerides ≥ 250mg/dL, previous diagnosis, or current treatment.
Brachial BP, CASP, and PWV were measured under standardized conditions with a validated oscillometric device (Mobil-O-Graph 24h PWA, I.E.M., Stolberg, Germany; Mediscan, Spain).3 The mean of the last 3 of 4 measurements was used for analysis. Hypertension was defined as mean brachial systolic BP ≥ 140mmHg, diastolic BP ≥ 90mmHg, or current treatment.
Of the 1824 participants, 1544 had valid, complete data on the study variables (Figure of the supplementary material). Of these 1544, 946 were excluded for being treated for hypertension or dyslipidemia, having diabetes, or previous cardiovascular disease.4,5 Of the 598 remaining individuals, 263 were normotensive, with 129 without cardiovascular risk factors (untreated dyslipidemia or current smoking) forming the “normal population”, and 134 with other cardiovascular risk factors. These latter 134 participants plus the untreated hypertensive patients without (n=180) or with (n=155) other cardiovascular risk factors formed the “reference population”.
Normative data are expressed in percentiles, stratified by age and sex. Analyses were performed using the SPSS v.21.
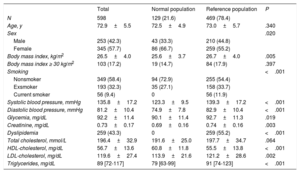
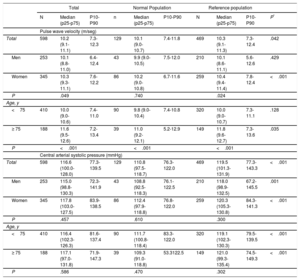
The participants mean age was 72.9 years (57.7%, women) (Table 1). Mean body mass index, glucose, lipids, and BP were higher in the reference population. PWV and CASP distributions were nonnormal, asymmetric to the right, and with moderate kurtosis. For the total population, median PWV was 10.2 m/s and was higher in the reference than in the normal population (10.3 vs 10.1; P=.042 with Mann-Whitney test and<.001 with Wald-Wolfowitz test), in women (10.3 vs 10.1 in men; P=.049), and in participants aged ≥ 75 years (11.6 vs 10.0 in <75 years; p <.001) (Table 2). Median CASP was 116.6mmHg, and was higher in the reference population (P <.001 with both nonparametric tests); this pattern remained when the analysis was stratified by age and sex. The concordance between measurements was close to good (intraclass correlation coefficients in the 3 populations for both PWV and CASP: ∼0.61-0.67).
Characteristics of the Study Participants
| Total | Normal population | Reference population | P | |
|---|---|---|---|---|
| N | 598 | 129 (21.6) | 469 (78.4) | |
| Age, y | 72.9±5.5 | 72.5±4.9 | 73.0±5.7 | .340 |
| Sex | .020 | |||
| Male | 253 (42.3) | 43 (33.3) | 210 (44.8) | |
| Female | 345 (57.7) | 86 (66.7) | 259 (55.2) | |
| Body mass index, kg/m2 | 26.5±4.0 | 25.6±3.7 | 26.7±4.0 | .005 |
| Body mass index ≥ 30 kg/m2 | 103 (17.2) | 19 (14.7) | 84 (17.9) | .397 |
| Smoking | <.001 | |||
| Nonsmoker | 349 (58.4) | 94 (72.9) | 255 (54.4) | |
| Exsmoker | 193 (32.3) | 35 (27.1) | 158 (33.7) | |
| Current smoker | 56 (9.4) | 0 | 56 (11.9) | |
| Systolic blood pressure, mmHg | 135.8±17.2 | 123.3±9.5 | 139.3±17.2 | <.001 |
| Diastolic blood pressure, mmHg | 81.2±10.4 | 74.9±7.8 | 82.9±10.4 | <.001 |
| Glycemia, mg/dL | 92.2±11.4 | 90.1±11.4 | 92.7±11.3 | .019 |
| Creatinine, mg/dL | 0.73±0.17 | 0.69±0.16 | 0.74±0.16 | .003 |
| Dyslipidemia | 259 (43.3) | 0 | 259 (55.2) | <.001 |
| Total cholesterol, mmol/L | 196.4±32.9 | 191.6±25.0 | 197.7±34.7 | .064 |
| HDL-cholesterol, mg/dL | 56.7±13.6 | 60.8±11.8 | 55.5±13.8 | <.001 |
| LDL-cholesterol, mg/dL | 119.6±27.4 | 113.9±21.6 | 121.2±28.6 | .002 |
| Triglycerides, mg/dL | 89 [72-117] | 79 [63-99] | 91 [74-123] | <.001 |
HDL-cholesterol, high-density lipoprotein cholesterol; LDL-cholesterol, low-density lipoprotein cholesterol.
Values are mean±standard deviation or median [interquartile range] for continuous variables or No. (%) for categorical variables. Differences in study characteristics between groups were tested with the Student t test for normally distributed continuous variables or the Mann-Whitney U test otherwise, and the chi-square for categorical variables.
Normal and Reference Values for Pulse Wave Velocity (m/sec) and Central Arterial Systolic Pressure by Age and Sex
| Total | Normal Population | Reference population | ||||||||
|---|---|---|---|---|---|---|---|---|---|---|
| N | Median (p25-p75) | P10-P90 | n | Median (p25-p75) | P10-P90 | N | Median (p25-p75) | P10-P90 | P* | |
| Pulse wave velocity (m/seg) | ||||||||||
| Total | 598 | 10.2 (9.1-11.1) | 7.3-12.3 | 129 | 10.1 (9.0-10.7) | 7.4-11.8 | 469 | 10.3 (9.1-11.3) | 7.3-12.4 | .042 |
| Men | 253 | 10.1 (8.8-11.0) | 6.4-12.4 | 43 | 9.9 (9.0-10.5) | 7.5-12.0 | 210 | 10.1 (8.6-11.1) | 5.6-12.6 | .429 |
| Women | 345 | 10.3 (9.3-11.1) | 7.6-12.2 | 86 | 10.2 (9.0-10.8) | 6.7-11.6 | 259 | 10.4 (9.4-11.4) | 7.8-12.4 | <.001 |
| P | .049 | .740 | .024 | |||||||
| Age, y | ||||||||||
| <75 | 410 | 10.0 (9.0-10.6) | 7.4-11.0 | 90 | 9.8 (9.0-10.4) | 7.4-10.8 | 320 | 10.0 (9.0-10.7) | 7.3-11.1 | .128 |
| ≥ 75 | 188 | 11.6 (9.5-12.6) | 7.2-13.4 | 39 | 11.0 (9.2-12.1) | 5.2-12.9 | 149 | 11.8 (9.6-12.7) | 7.3-13.6 | .035 |
| P | <.001 | <.001 | <.001 | |||||||
| Central arterial systolic pressure (mmHg) | ||||||||||
| Total | 598 | 116.6 (100.0-128.0) | 77.3-139.5 | 129 | 110.8 (97.5-118.7) | 76.3-122.0 | 469 | 119.5 (101.3-131.9) | 77.3-143.3 | <.001 |
| Men | 253 | 115.0 (98.8-130.3) | 72.3-141.9 | 43 | 108.8 (92.5-118.3) | 76.1-122.5 | 210 | 118.0 (98.9-132.5) | 67.2-145.5 | .001 |
| Women | 345 | 117.8 (103.0-127.5) | 83.9-138.5 | 86 | 112.4 (97.9-118.8) | 76.8-122.0 | 259 | 120.3 (105.3-130.8) | 84.3-141.3 | <.001 |
| P | .457 | .610 | .300 | |||||||
| Age, y | ||||||||||
| <75 | 410 | 116.4 (102.3-126.3) | 81.6-137.4 | 90 | 111.7 (100.8-118.4) | 83.3-122.0 | 320 | 119.1 (102.3-130.3) | 79.5-139.5 | <.001 |
| ≥ 75 | 188 | 117.1 (97.0-131.8) | 71.9-147.3 | 39 | 109.3 (91.0-118.8) | 53.3122.5 | 149 | 121.0 (99.3-135.4) | 74.5-149.3 | <.001 |
| P | .586 | .470 | .302 | |||||||
Central aortic systolic pressure values were lower in our study (median ∼117mmHg) than in older individuals from a worldwide database (median ∼126mmHg).5 Although the international pooling used tonometry-based techniques, oscillometric methods yield only smaller CASP values (∼0.6mmHg).3 Thus, we suggest that, despite methodological standardization across studies, pooling normal/reference data does not necessarily apply to a specific country. From a physiological viewpoint, for a given brachial pulse pressure, the lower the central pulse pressure the more beneficial the effect on the cardiovascular system, because the heart and the aorta would deal with a lower pulsatile load.1
Median PWV (10.1 m/s in our normal population) was similar to that in the pooled database (median, 10.2).4 On average, over half the older population would have arterial stiffness (PWV >10 m/s)2 and would thus be at higher cardiovascular risk.
The main limitation of this study is that we did not use the gold-standard method to estimate CASP and PWV; nevertheless, oscillometric methods are as effective as tonometry-based methods.1,3 Furthermore, by using the same technique and protocol for all participants, our study avoided the strong center/technique interaction in major pooling studies.4,5 Although our sample was not representative of the older population of Spain because ours was a cardiovascular health study, the sex distribution was comparable to that in Spain and, as expected, it had a relatively lower frequency of the oldest subpopulation since we excluded additional cardiovascular disease or risk factors.4,5 Additional exclusion of patients with renal disease did not change the main results substantially. Although some differences in parameters between normal and reference populations were statistically significant, they were generally small and not necessarily clinically relevant. Last, our limited sample size, especially the normal population, hampered wider stratification by age but nevertheless allowed for precision of estimates generally <5%.
This report represents one step toward the clinical application of PWV and CASP, providing guidelines for assessing older patients’ vascular status besides brachial systolic BP. However, further studies should obtain evidence for effective intervention on these parameters.
FUNDINGThis work was supported by Fondo de Investigación Sanitaria (FIS) grants no. PI13/02321 and 16/01460 (Instituto de Salud Carlos III and FEDER/FSE) and CIBERESP. The funding agencies had no role in study design, data analysis, interpretation of results, manuscript preparation or in the decision to submit this manuscript for publication.