Red cell distribution width has been linked to an increased risk for in-hospital bleeding in patients with non–ST-segment elevation acute coronary syndrome. However, its usefulness for predicting bleeding complications beyond the hospitalization period remains unknown. Our aim was to evaluate the complementary value of red cell distribution width and the CRUSADE scale to predict long-term bleeding risk in these patients.
MethodsRed cell distribution width was measured at admission in 293 patients with non–ST-segment elevation acute coronary syndrome. All patients were clinically followed up and major bleeding events were recorded (defined according to Bleeding Academic Research Consortium Definition criteria).
ResultsDuring a follow-up of 782 days [interquartile range, 510-1112 days], events occurred in 30 (10.2%) patients. Quartile analyses showed an abrupt increase in major bleedings at the fourth red cell distribution width quartile (> 14.9%; P=.001). After multivariate adjustment, red cell distribution width >14.9% was associated with higher risk of events (hazard ratio=2.67; 95% confidence interval, 1.17-6.10; P=.02). Patients with values≤14.9% and a CRUSADE score≤40 had the lowest events rate, while patients with values >14.9% and a CRUSADE score >40 points (high and very high risk) had the highest rate of bleeding (log rank test, P<.001). Further, the addition of red cell distribution width to the CRUSADE score for the prediction of major bleeding had a significant integrated discrimination improvement of 5.2% (P<.001) and a net reclassification improvement of 10% (P=.001).
ConclusionsIn non–ST-segment elevation acute coronary syndrome patients, elevated red cell distribution width is predictive of increased major bleeding risk and provides additional information to the CRUSADE scale.
Keywords
Hemorrhagic complications represent an important adverse prognostic factor in patients with acute coronary syndromes (ACS).1–3 Previous studies indicate that patients with major bleeding (MB) in this setting have up to a 20% of risk of death, myocardial infarction, or stroke during the first 30 days compared with 5% in those who do not develop MB during the first 30 days.1 This risk extends beyond the time of procedures, and even when the severity of the bleeding does not indicate that it is life-threatening.1 Mechanistically, the risk associated with MB is thought to be multifactorial, resulting from the interruption of effective antithrombotic drugs, the reduction of oxygen delivery to the myocardium as a result of hypoperfusion, platelet activation, and the potentially adverse effects of transfusion.4
Given the deleterious association between MB and outcome in ACS, the identification of risk factors able to predict hemorrhage is important and has been explored using clinical risk models. It is logical to explore laboratory factors as well as to provide information to complement bleeding risk scales. Red cell distribution width (RDW) is a quantitative measure of the variability in size of the circulating erythrocytes,5 and has been recently found to be strongly predictive of cardiovascular outcomes in multiple patient populations, including those with ACS.6–12
Most recently, increased RDW has also been linked to a higher rate of bleeding in patients with ACS.13,14 However, these studies assessed only the role of RDW for the prediction of in-hospital bleeding, and did not report the usefulness of RDW for the prediction of bleeding during follow-up.
Therefore, the objective of the present study was to assess the role of RDW values to predict risk of MB over the long-term follow up of patients with non–ST-segment elevation ACS (NSTEACS), and to evaluate whether RDW adds additional predictive value to a widely accepted model for predicting MB risk, the CRUSADE scale.15
METHODSSubjects and Study DesignFrom September 2006 to December 2008, we prospectively enrolled 293 consecutive patients with an established final diagnosis of high-risk unstable angina or non–ST-segment elevation myocardial infarction. High-risk NSTEACS was defined as ischemic symptoms lasting ≥10min and occurring within 72h before admission and either ST-segment deviation ≥1mm or elevated levels of cardiac biomarker of necrosis.16 Patients with evidence of infectious, connective tissue or inflammatory disease were excluded, as were patients taking iron supplements, folic acid, vitamin B12 or immunosuppressant agents. Furthermore, patients who refused or were incapable of giving informed consent were also excluded.
During the entire hospitalization period, baseline clinical characteristics were prospectively recorded. Risk of MB was calculated using CRUSADE risk scale. Patients were classified into 5 categories as a function of the CRUSADE risk scale: very low, ≤20 points; low, 21 points to 30; moderate, 31 to 40 points; high, 41 points to 50 points; and very high risk, >50 points. The clinical management decisions about each patient were taken by the responsible cardiologist, who had clinical access to the RDW value. The study was approved by the local ethics committee, and informed consent was obtained from each patient at inclusion.
BiochemistryAll blood samples were obtained on arrival at the emergency department and were processed immediately after extraction. All hematological parameters were determined using the XE-2100 automatic analyzer (Sysmex; Kobe, Japan) and all biochemical parameters using the PE modular analyzer (Roche Diagnostics; Manheim, Germany). Anemia was defined according to the World Health Organization criteria17: hemoglobin<13g/dL for men and <12g/dL for women. Renal function data were estimated from the calculation of the estimated glomerular filtration rate (mL/min/1.73m2) using the Cockroft-Gault18 (estimated glomerular filtration rate formula: ([140−age]×weight [kg])/(serum creatinine [mg/dL]×72) (×0.85 for women).
Follow-up and EndpointsAfter hospital discharge, patients were followed up for a median of 782 days [interquartile range, 510-1112 days]. All medical records were carefully reviewed, and the patients or their relatives were contacted by telephone to obtain the incidence of bleeding events during the follow-up. The clinical endpoint was defined as the occurrence of MB, which was defined according to the Bleeding Academic Research Consortium Definition criteria19 as bleeding types 3 to 5; type 3a, overt bleeding plus hemoglobin drop of of 3g/dL to 5g/dL, any transfusion with overt bleeding; type 3b, overt bleeding plus hemoglobin drop 5g/dL, cardiac tamponade, bleeding requiring surgical intervention for control (excluding dental/nasal/skin/hemorrhoid), bleeding requiring iv vasoactive agents; type 3c, intracranial hemorrhage (does not include microbleeds or hemorrhagic transformation, does include intraspinal), subcategories confirmed by autopsy or imaging or lumbar puncture, intraocular bleed compromising vision; type 4, coronary artery bypass graft-related bleeding (perioperative intracranial bleeding within 48h, reoperation after closure of sternotomy to control control bleeding, transfusion of ≥5U whole blood or packed red blood cells within a 48-h period, chest tube output ≥2L within a 24-h period); type 5, fatal bleeding (type 5a, probable; type 5b, definite).
Statistical AnalysisContinuous variables were tested for normal distribution using the Kolmogorov-Smirnov test. Normally distributed data are presented as mean (standard deviation) and nonnormally distributed data as median [interquartile range]. Categorical variables are expressed as percentages. Patients were grouped according to RDW quartiles. Differences in baseline characteristics were compared using analysis of variance or the Kruskal-Wallis test for continuous variables and the chi-square test for categorical variables. Comparisons of both biomarkers between groups with and without events were performed using the Mann-Whitney U test. We calculated hazard ratio and 95% confidence interval (95%CI) derived from the Cox regression analysis to identify predictors of MB during follow up. The independent effect of RDW on MB complications was calculated using Cox multivariate regression analyses, incorporating covariates with P<.05 on univariate analysis. Linearity assumption was tested using Martingale residuals. Log-cumulative hazard plots, time-dependent covariates, and Schoenfeld residuals were used to evaluate adherence of the Cox proportional hazard assumptions. The covariates within the CRUSADE risk scale with P<0.05 were first entered individually in the multivariate model (model 1). Subsequently, all covariates within the CRUSADE risk score, including those with P>.05, were analyzed as a single variable, the risk scale, in model 2. The improvement in predictive accuracy was evaluated by calculating the net reclassification improvement and integrated discrimination improvement, as described by Pencina et al.20 Finally, the cumulative incidence of MB was estimated according to the Kaplan-Meier method and the log-rank statistic was used for comparisons. Statistical significance was set at P<.05. Statistical analysis was performed using the SPSS version 18.0 for Windows (SPSS Inc.; Chicago, Illinois, United States).
RESULTSThe study population consisted of 293 patients with NSTEACS (Table 1). The median RDW value was 13.9% [13.2-14.9%]. Patients with higher RDW values were elderly, more frequently female, and had a greater prevalence of comorbidities including hypertension, diabetes mellitus, hyperlipemia, anemia, previous stroke, and renal dysfunction. These patients also had worse CRUSADE risk scale and were less commonly revascularized. As expected, patients with higher RDW had lower hemoglobin and mean corpuscular volume, while they had higher C-reactive protein levels. At discharge, patients with higher RDW values were less commonly on clopidogrel (Table 1 of supplementary Material).
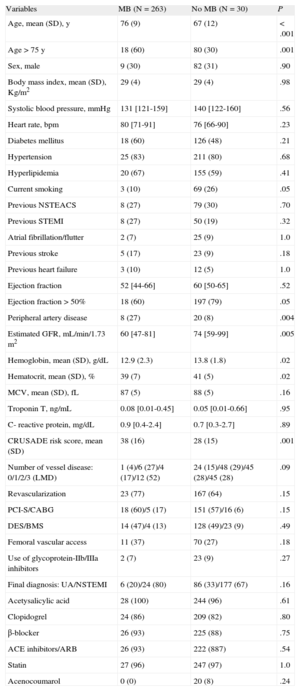
Study Population Clinical Characteristics as a Function of Major Bleeding
| Variables | MB (N=263) | No MB (N=30) | P |
| Age, mean (SD), y | 76 (9) | 67 (12) | <.001 |
| Age>75 y | 18 (60) | 80 (30) | .001 |
| Sex, male | 9 (30) | 82 (31) | .90 |
| Body mass index, mean (SD), Kg/m2 | 29 (4) | 29 (4) | .98 |
| Systolic blood pressure, mmHg | 131 [121-159] | 140 [122-160] | .56 |
| Heart rate, bpm | 80 [71-91] | 76 [66-90] | .23 |
| Diabetes mellitus | 18 (60) | 126 (48) | .21 |
| Hypertension | 25 (83) | 211 (80) | .68 |
| Hyperlipidemia | 20 (67) | 155 (59) | .41 |
| Current smoking | 3 (10) | 69 (26) | .05 |
| Previous NSTEACS | 8 (27) | 79 (30) | .70 |
| Previous STEMI | 8 (27) | 50 (19) | .32 |
| Atrial fibrillation/flutter | 2 (7) | 25 (9) | 1.0 |
| Previous stroke | 5 (17) | 23 (9) | .18 |
| Previous heart failure | 3 (10) | 12 (5) | 1.0 |
| Ejection fraction | 52 [44-66] | 60 [50-65] | .52 |
| Ejection fraction>50% | 18 (60) | 197 (79) | .05 |
| Peripheral artery disease | 8 (27) | 20 (8) | .004 |
| Estimated GFR, mL/min/1.73m2 | 60 [47-81] | 74 [59-99] | .005 |
| Hemoglobin, mean (SD), g/dL | 12.9 (2.3) | 13.8 (1.8) | .02 |
| Hematocrit, mean (SD), % | 39 (7) | 41 (5) | .02 |
| MCV, mean (SD), fL | 87 (5) | 88 (5) | .16 |
| Troponin T, ng/mL | 0.08 [0.01-0.45] | 0.05 [0.01-0.66] | .95 |
| C- reactive protein, mg/dL | 0.9 [0.4-2.4] | 0.7 [0.3-2.7] | .89 |
| CRUSADE risk score, mean (SD) | 38 (16) | 28 (15) | .001 |
| Number of vessel disease: 0/1/2/3 (LMD) | 1 (4)/6 (27)/4 (17)/12 (52) | 24 (15)/48 (29)/45 (28)/45 (28) | .09 |
| Revascularization | 23 (77) | 167 (64) | .15 |
| PCI-S/CABG | 18 (60)/5 (17) | 151 (57)/16 (6) | .15 |
| DES/BMS | 14 (47)/4 (13) | 128 (49)/23 (9) | .49 |
| Femoral vascular access | 11 (37) | 70 (27) | .18 |
| Use of glycoprotein-IIb/IIIa inhibitors | 2 (7) | 23 (9) | .27 |
| Final diagnosis: UA/NSTEMI | 6 (20)/24 (80) | 86 (33)/177 (67) | .16 |
| Acetysalicylic acid | 28 (100) | 244 (96) | .61 |
| Clopidogrel | 24 (86) | 209 (82) | .80 |
| β-blocker | 26 (93) | 225 (88) | .75 |
| ACE inhibitors/ARB | 26 (93) | 222 (887) | .54 |
| Statin | 27 (96) | 247 (97) | 1.0 |
| Acenocoumarol | 0 (0) | 20 (8) | .24 |
ACE, angiotensin-converting enzyme; ARB, angiotensin-receptor blockers; BMS, bare metal stent; CABG, coronary artery bypass graft; DES, drug-eluting stent; GFR, glomerular filtration rate; LMD, left main disease; MCV, mean corpuscular volume; NSTEACS: Non–ST-segment elevation acute coronary syndrome; NSTEMI, non–ST-segment elevation myocardial infarction; PCI-S, percutaneous coronary intervention with stent implantation; SD, standard deviation; STEMI, ST-segment elevation myocardial infarction; UA; unstable angina.
Data are expressed as No. (%), mean (standard deviation) or median [interquartile range].
During follow up, a total of 30 patients (2.3 per 104 patient year) had MB; 16 (53.3%) had type 3a, 8 (26.7%) type 3b, 2 (6.7%) type 3c, 2 (6.7%) type 4, and 2 (6.7%) type 5b. The location of MB was gastrointestinal in 12 (40%), intracranial in 4 (13.3%), cardiac tamponade in 4 (13.3%), pulmonary in 2 (6.7%), musculoskeletal in 2 (6.7%), urologic in 2 (6.7%), coronary artery bypass graft-related bleeding in 2 (6.7%), and puncture site in 2 (6.7%). Eight patients (27%) had MB during the index hospitalization, 14 patients (47%) had MB during the first 30 days, 22 (73%) during the first year, and 25 (83%) through the second year.
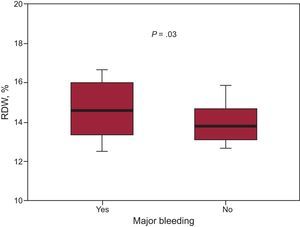
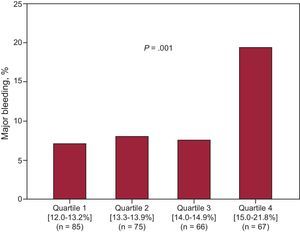
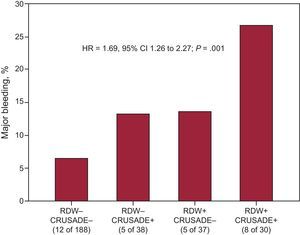
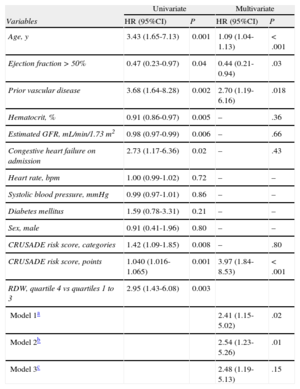
The distribution of characteristics and laboratory parameters according to the occurrence of MB is shown in Table 1. Notably, patients who experienced MB had higher RDW values (14.6% [13.4-16] vs 13.8% [13.1-14.7]; P=0.03) (Figure 1). Quartile analyses of RDW values examined as a function of MB rates revealed that there was an abrupt increase in MB at the fourth RDW quartile (RDW ≤ 13.2%=5.1 per 104 patient year, RDW from 13.3% to 13.9%, 5.8 per 104 patient year; RDW from 14.0% to 14.9%, 8.7 per 104 patient year, RDW>14.9%, 2.1 per 104 patient year) (Figure 2). In addition, Kaplan-Meier survival analysis showed that, compared with patients with RDW ≤14.9%, those with RDW values above the fourth quartile (RDW>14.9%) had a higher rate of MB (19.4% vs 7.5%, log rank test, P<.001). On multivariate Cox regression analysis (Table 2), RDW>14.9% (hazard ratio=2.41; 95%CI: 1.15–5.02; P=.02) was associated with a more than 2-fold increase in the risk for MB. In reclassification analysis, RDW>14.9% added significant information to the CRUSADE risk scale. The relative integrated discrimination improvement from the addition of RDW>14.9% was 5.2% (P=.01) whereas the net reclassification improvement was 10% (95%CI, 6-19%; P=.02). The probability of correctly predicting MB and non–MB events when RDW>14.9% was added to the CRUSADE risk scale was reflected in the percentage of both non–MB and MB events correctly reclassified (7% and 3%, respectively). Moreover, the addition of RDW>14.9% was associated with a nonsignificant improvement in the C-index from 0.63 (95%CI, 0.57-0.69) to 0.68 (95%CI, 0.62.-0.73); P=.15. Illustrating this finding, as detailed in Figure 3, patients with a CRUSADE risk scale <40 points (nonhigh risk for bleeding) and RDW ≤ 14.9% had the lowest MB rate (6.4%), while those with a CRUSADE risk scale >40 points (high risk for bleeding) and RDW >14.9% had the highest rate (26.7%; P<.001).

Box plots of red cell distribution width values in patients with and without major bleeding. The bottom and top whiskers indicate the 5th and 95th percentile values, the lower and upper boundaries of the boxes represent 25th and 75th percentile values, and the horizontal line within the box, the median value.

Cox Proportional Hazards Analysis for Prediction of Major Bleeding
| Univariate | Multivariate | |||
| Variables | HR (95%CI) | P | HR (95%CI) | P |
| Age, y | 3.43 (1.65-7.13) | 0.001 | 1.09 (1.04-1.13) | <.001 |
| Ejection fraction>50% | 0.47 (0.23-0.97) | 0.04 | 0.44 (0.21-0.94) | .03 |
| Prior vascular disease | 3.68 (1.64-8.28) | 0.002 | 2.70 (1.19-6.16) | .018 |
| Hematocrit, % | 0.91 (0.86-0.97) | 0.005 | – | .36 |
| Estimated GFR, mL/min/1.73 m2 | 0.98 (0.97-0.99) | 0.006 | – | .66 |
| Congestive heart failure on admission | 2.73 (1.17-6.36) | 0.02 | – | .43 |
| Heart rate, bpm | 1.00 (0.99-1.02) | 0.72 | – | – |
| Systolic blood pressure, mmHg | 0.99 (0.97-1.01) | 0.86 | – | – |
| Diabetes mellitus | 1.59 (0.78-3.31) | 0.21 | – | – |
| Sex, male | 0.91 (0.41-1.96) | 0.80 | – | – |
| CRUSADE risk score, categories | 1.42 (1.09-1.85) | 0.008 | – | .80 |
| CRUSADE risk score, points | 1.040 (1.016-1.065) | 0.001 | 3.97 (1.84-8.53) | <.001 |
| RDW, quartile 4 vs quartiles 1 to 3 | 2.95 (1.43-6.08) | 0.003 | ||
| Model 1a | 2.41 (1.15-5.02) | .02 | ||
| Model 2b | 2.54 (1.23-5.26) | .01 | ||
| Model 3c | 2.48 (1.19-5.13) | .15 | ||
95%CI, 95% confidence interval; GFR, glomerular filtration rate; HR, hazard ratio; RDW, red cell distribution width.
The CRUSADE risk score was tested separately as continuous and dichotomized variables, and multivariate hazard ratios and P values for other variables are listed from model 1.
Adjusted by age, ejection fraction > 50%, hematocrit estimated glomerular filtration rate, prior vascular disease and congestive heart failure on admission.
, ≤ 14.9%: red cell distribution width (+), >14.9%; CRUSADE (+), >40 points (high risk for bleeding); CRUSADE (–), <40 points (nonhigh risk for bleeding). Hazard ratio per category and adjusted by age (years) and left ventricular ejection fraction>50%. 95%CI, 95% confidence interval; HR, hazard ratio; RDW, red cell distribution width.")
Addition of red cell distribution width values to the CRUSADE risk score for risk stratification of major bleeding. Rates of major bleeding were significantly higher with rising combined scores. Red cell distribution width (−), ≤ 14.9%: red cell distribution width (+), >14.9%; CRUSADE (+), >40 points (high risk for bleeding); CRUSADE (–), <40 points (nonhigh risk for bleeding). Hazard ratio per category and adjusted by age (years) and left ventricular ejection fraction>50%. 95%CI, 95% confidence interval; HR, hazard ratio; RDW, red cell distribution width.
In the present study, we examined the role of RDW in the prediction of MB complications in a cohort of patients with NSTEACS. In this population, we demonstrated that most MB episodes occurred well after the index hospitalization. Additionally, patients with elevated RDW (> 14.9%) at the time of hospitalization were at higher risk for MB, with a more >2-fold increase in risk compared with those with RDW ≤ 14.9%. Moreover, we also showed that RDW adds useful information to the CRUSADE risk scale for predicting this important outcome. Lastly, the risk associated with an elevated RDW was presented early, and lasted throughout the follow up.
The RDW is routinely assessed as part of the complete blood count to gather information on the heterogeneity in the size of circulating erythrocytes. Computationally, RDW is the coefficient of variation of the mean corpuscular volume and therefore higher RDW values reflect greater heterogeneity in mean corpuscular volume (anisocytosis), which is usually caused by perturbation in erythrocyte maturation or degradation.5 The RDW is used as an auxiliary index to help in the diagnosis of different types of anemia, but has also been evaluated as a potential screening marker for colon cancer and celiac disease.21 Furthermore, increased RDW has also been related to nutritional deficiencies (eg, iron, folate, or vitamine B12)21,22 and the release of cytokines in response to inflammation.23 Thus, oxidative stress directly damages erythrocytes and leads to shortened erythrocyte survival; likewise, theses cytokines attenuate the activity of erythropoietin and cause production of ineffective red blood cells, leading to elevated RDW.24–26
As mentioned earlier, several studies have suggested that increased RDW is predictive of higher risk for adverse events in patients with a wide array of different cardiovascular disorders.6–12 However, there are few data about the relationship between RDW and bleeding complications in patients with ACS. In addition, the mechanism through which RDW is associated with bleeding remains largely unknown, but seems to be multifactorial. Given that elevated RDW is often seen in patients with extensive comorbidities,27 RDW may predict the occurrence of these diseases as well as that of other age-associated conditions. Accordingly, in the present study, patients with elevated RDW had an unfavorable baseline clinical profile that included older age, more frequent female sex, and a higher prevalence of comorbidities known to increase the risk of bleeding, such as hypertension, diabetes mellitus, anemia, previous stroke, and renal dysfunction. Moreover, these patients also had higher C-reactive protein levels, and consequently inflammation may play a role in bleeding risk. In fact, increased inflammation states have been linked to changes in hemostasis with a prothrombotic state predisposing to thromboembolism and coagulopathy with a tendency for bleeding.28,29 Additionally, other indirect mechanism such as erythropoietin deficiency may contribute to the increased risk of MB.27 Further research is needed to understand the pathways through which RDW is associated with bleeding.
In a recent study that included 513 patients with NSTEACS, Gonçalves et al13 showed that those with a RDW>15.7% had a 3-fold increased in-hospital MB compared with those with a RDW<15.7%. Similarly, Fatemi et al,14 also showed a 2.3-fold increased in-hospital MB risk by comparing the highest RDW quartile (> 14.3%) to the lowest quartile (< 12.7%) in a large population of 6689 patients who underwent percutaneous coronary intervention. Findings from our study not only confirm these previous results but also expand on them, given that we also show that RDW is a strong predictor for MB beyond the hospitalization period. Moreover, unlike these previous studies, we used a standardized MB definition based on the Bleeding Academic Research Consortium Definition criteria,19 which may be helpful for future comparisons. We also demonstrated that RDW measurement adds valuable clinical information about the potential increased likelihood of MB to the CRUSADE bleeding risk scale in patients with NSTEACS.
Interestingly, in this study enhanced predictions of RDW over the CRUSADE risk scale appeared to be the result of an increased percentage of correct reclassification of both events and nonevents, the net reclassification improvement being 10%. Another important finding of our study is that even in the setting of a CRUSADE risk scale <40 points (nonhigh risk for bleeding), the presence of RDW>14.9% confers a high risk for MB, suggesting that the addition of this parameter to bleeding risk scores may be valuable.
LimitationsThe present study has several limitations. It is a small analysis, conducted at a single center. Additionally, as with all observational investigations, the applicability of the present results should therefore be viewed with caution in centers with other types of patients and medical facilities, and should be considered as hypothesis-generating. While our results are compelling, we cannot link RDW to bleeding causality; because patients with high RDW often have other associated risk factors for bleeding, such as advanced age, a higher prevalence of hypertension or poorer renal function, it is likely that RDW marks risk, rather than mediates it.6,14,30 Another limitation of this study is that laboratory assessments were made at a single time point and therefore we were unable to evaluate fluctuations in RDW. Furthermore, RDW values were not blinded, which may have influenced clinical management. In addition, makers of erythropoiesis, nutritional status, and oxidative stress were not available, but could provide valuable clues as to the pathophysiology underlying anisocytosis. Finally, for the prediction of outcomes, the number of covariates included in the multivariate models was>1 for every 10 events. Therefore, the models may have been overadjusted, and consequently the present results could fail to be replicated in future samples.
CONCLUSIONSAlthough examined in a relatively small cohort, our proof-of-concept analysis showing RDW as a predictor for MB beyond the hospitalization period in patients with NSTEACS is novel. In light of these findings, and the results of previous studies that have firmly established the strong link between bleeding complications and subsequent adverse outcomes, we suggest that future research should assess the potential role of including RDW values into the bleeding risk scales in order to improve the stratification process of these patients, especially after hospital discharge.
CONFLICTS OF INTERESTDr. Marín has received funding for research, consultancy and lecturing from Abbott, Boston Scientifics, Bayer, AstraZeneca, Daiichi-Sankyo, BMS/Pfizer and Boehringer Ingelheim. Dr. Januzzi reports grant support from Roche Diagnostics, Critical Diagnostics, Siemens and Singulex.