Our objective was to study the relationship of healthy vascular aging (HVA) with lifestyle and the components of metabolic syndrome. We also analyzed the differences between chronological age and heart age (HA) and vascular age (VA) in the Spanish adult population without cardiovascular disease.
MethodsThis descriptive cross-sectional study selected 501 individuals without cardiovascular disease (mean age, 55.9 years; 50.3% women) via random sampling stratified by age and sex. HA was estimated with the Framingham equation, whereas VA was estimated with the VaSera VS-1500 device. HVA was defined as a <5-year difference between the chronological age and the HA or VA and the absence of a vascular lesion, hypertension, and diabetes mellitus.
ResultsCompared with the chronological age, the mean HA and VA were 2.98±10.13 and 3.08±10.15 years lower, respectively. Smoking (OR, 0.23), blood pressure ≥ 130/85mmHg (OR, 0.11), altered baseline blood glucose (OR, 0.45), abdominal obesity (OR, 0.58), triglycerides ≥ 150mg/dL (OR, 0.17), and metabolic syndrome (OR, 0.13) decreased the probability of HVA estimated by HA; an active lifestyle (OR, 1.84) and elevated high-density lipoprotein-cholesterol (OR, 3.26) increased the probability of HVA estimated by HA. Smoking (OR, 0.45), blood pressure ≥ 130/85mmHg (OR, 0.26), altered baseline blood glucose (OR, 0.42), and metabolic syndrome (OR, 0.40) decreased the probability of HVA estimated by VA; abdominal obesity (OR, 1.81) had the opposite effect.
ConclusionsHA and VA were 3 years lower than the chronological age. HA was associated with tobacco consumption, physical activity, and the components of metabolic syndrome. Meanwhile, VA was associated with tobacco consumption, blood pressure, waist circumference, and altered baseline glycemia.
Clinical trial registration: http://www.clinicaltrials.gov. Identifier: NCT02623894.
Keywords
Estimation of cardiovascular risk (CVR) is a priority of health care professionals to identify individuals with higher probability of developing cardiovascular disease. However, absolute CVR has some limitations.1 Accordingly, various alternatives have been developed, such as estimation of the relative CVR, heart age (HA), and vascular age (VA).1 Compared with chronological age, HA and VA more accurately reflect the structural and functional changes that occur in aging arteries and better predict health outcomes.2 In addition, patients better understand CVR expressed in the form of HA or VA than 10-year absolute risk, which helps to promote their adoption of healthier lifestyle habits.3,4 Since the introduction of the concepts of HA and VA, derived from the Framingham Heart Study,5 numerous studies have proposed different ways to define and measure the HA or VA as tools to improve CVR prediction or patient understanding, without evidence or consensus regarding the most suitable method.1,3–6 D’Agostino et al.5 introduced the epidemiological concept of HA and reported various algorithms to estimate it from the Framingham Heart Study. In addition, several studies have used the estimated VA, which considers arterial stiffness, because this measure reflects the disconnect between the VA and the chronological age of the major arteries.7 The VaSera VS-1500 device estimates central and peripheral arterial stiffness and VA using the cardio-ankle vascular index (CAVI).8
In recent years, various studies have analyzed the relationship between lifestyle and vascular aging, but most measured stiffness using carotid-femoral pulse wave velocity; a recent review concluded that vascular aging was influenced by physical activity and alcohol and tobacco consumption.6 In addition, vascular aging has been associated with components of metabolic syndrome (MetS).9 However, no studies have examined the relationship of healthy vascular aging (HVA), estimated using HA and VA, with lifestyle habits and MetS and its components in the general Spanish population. Accordingly, we designed this study to assess the relationship of HVA with lifestyle and MetS components and to analyze the differences in chronological age from HA and VA in the adult Spanish population without cardiovascular disease.
METHODSDesignThe present work was designed as a cross-sectional study of EVA study participants.10
Study populationThe study was performed in the Primary Health Care Research Unit of Salamanca. The reference population comprised 43946 residents of Salamanca (age, 35-75 years) with a public health care card and assigned to any of 5 health centers. From the health care card database, we selected 501 individuals via random sampling with replacement and stratified them by age group (35, 45, 55, 65, and 75 years) and sex; each group was balanced according to sex and contained 100 individuals. Patient selection was performed from June 2016 to November 2017. Inclusion criteria were age from 35 to 75 years and provision of signed informed consent. Exclusion criteria were end-stage disease, inability to attend the health care center, history of cardiovascular disease, glomerular filtration rate < 30mL/min/1.73 m2, history of chronic inflammatory disease or an acute inflammatory process in the previous 3 months, or treatment with estrogen, testosterone, or growth hormone.
The study flow chart shows the reference population, participant inclusion and exclusion, and the reasons for exclusion by age group and sex (figure 1 of the supplementary data).
The 501 study participants were sufficient to detect a mean difference between the chronological age and HA and VA≥2 years, accepting an alpha risk of .05 and a beta risk of .20 with a 2-sided test and assuming a common standard deviation of 16 years.
Measurement variables and instrumentsA detailed description has previously been published of the study procedures, inclusion and exclusion criteria, and the response rate.10,11 Two health care professionals (a physician and a nurse) managed the blood collection, examinations, and questionnaires. Both professionals were trained according to a standardized protocol.
Measurement of vascular agingHA was estimated based on CVR calculated according to the Framingham study (D’Agostino scale).5 The risk factors used by this scale include age, sex, total cholesterol, high-density lipoprotein-cholesterol (HDL-C), and systolic blood pressure as quantitative variables and hypotensive drug therapy, smoking, and history of diabetes mellitus as dichotomous variables. VA was estimated using the VaSera VS-1500 device software (Fukuda Denshi Co Ltd, Japan).8 The difference between the estimated HA and VA and the chronological age was used to evaluate heart aging and vascular aging, respectively. HVA was considered to be present in individuals with differences in their HA or VA from their chronological age < 5 years, following the criteria established by Appiah et al.,3 and without hypertension, diabetes mellitus, or a vascular lesion.
Measurement of the cardio-ankle vascular indexThe CAVI was measured using the VaSera VS-1500 device software (Fukuda Denshi Co Ltd), which was validated and performed according to the manufacturer's instructions. The CAVI is a measure of arterial stiffness that reflects the stiffness from the ascending aorta to the ankle arteries (peripheral and central arterial stiffness).8 It uses an oscillometric method and is largely unaffected by the patient's blood pressure during the examination. Participants could not smoke or consume caffeine within 1 hour before the examination and were asked to wear comfortable clothes and to lie down for at least 10minutes before the measurement. Cuffs were adjusted to the circumference of the arms and ankles. Electrodes were attached to the arms and ankles and a heart sound microphone was fixed with double-sided tape to the sternum in the second intercostal space and the patient had to stay still and quiet for 5minutes. CAVI measurements were considered valid if they were obtained for at least 3 consecutive heartbeats.8 CAVI values were automatically calculated using the following equation: CAVI = a [(2P/ΔP) In (Ps/Pd) PWV2] + b
where ρ is the blood density, PWV is the pulse wave velocity from the aortic valve to the ankle, Ps and Pd are the systolic and diastolic blood pressure (in mmHg), respectively, and ΔP is the change in blood pressure.8
Measurement of metabolic syndrome componentsClinical blood pressure was measured 3 times using a validated blood pressure cuff (Omron model M10-IT, Omron Health Care, Japan) following the recommendations of the European Society of Hypertension7; the average of the last 2 readings was used. Waist circumference was measured according to the 2007 recommendations of the Spanish Society for the Study of Obesity. Plasma glucose, total cholesterol, HDL-C, and triglycerides were measured in a venous blood sample, which was collected in the Primary Health Care Research Unit of Salamanca between 8:00 am and 9:00 am in fasted patients who had not smoked or consumed alcohol or caffeine-containing drinks in the previous 12hours. All participants’ samples were analyzed in the laboratory of the coordinating hospital.
MetS was considered to be present in patients meeting 3 or more of the following criteria: abdominal obesity (≥102cm for men;≥88cm for women), triglycerides≥150mg/dL, low HDL-C (men, < 50mg/dL; women, <40mg/dL), elevated blood pressure (≥130/85mmHg), blood glucose ≥100mg/dL, or diabetes mellitus.7
Lifestyle factorsThe assessment of lifestyle factors is detailed in the supplementary data under the heading “Lifestyle”.
Statistical analysisContinuous variables are presented as mean±standard deviation and categorical variables as No. and percentage. Means were compared between 2 independent groups using the t test and among more than 2 groups using 1-way analysis of variance (ANOVA). The chi-square test was used to compare categorical variables. Various multiple regression and logistic regression models were used to analyze the determinants of HVA. In the multiple regression models, the dependent variables were the difference in HA and VA from chronological age, whereas the independent variables were lifestyle habits and MetS components. In the logistic regression models, the dependent variables were HVA estimated by HA and VA (coded as with HVA=1 and without HVA=1), whereas the independent variables were lifestyle habits in 2 categories: appropriate alcohol consumption, smoking, adherence to the Mediterranean diet, physically active (no=0, yes=1), and presence of MetS components (no=0, yes=1). All of the models were adjusted for age, heart rate, sex (female=0, male=1), and use of hypotensive, hypoglycemic, and lipid-lowering drugs (no=0, yes=1). All analyses were performed using the statistical software SPSS for Windows version 25.0 (IBM Corp, United States). In the hypothesis testing, an α risk of .05 was considered significant.
Ethical standardsAll participants were informed about the study and signed an informed consent form before inclusion. The study was approved by the Clinical Research Ethics Committee of Salamanca. The study adhered to the recommendations of the Declaration of Helsinki.
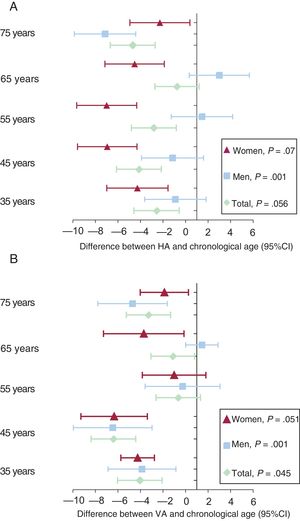
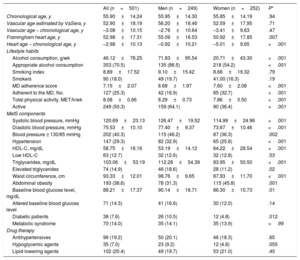
RESULTSOverall and sex-stratified demographic characteristics, lifestyle habits, and MetS components are described in table 1. The mean age was 55.90±14.24 years. HA was 2.98±10.13 years lower than the chronological age (men, 0.92±10.21 years; women, 5.01±9.63 years; P<.001) while VA was 3.08±10.15 years lower than the chronological age (men, 2.76±10.64 years; women, 3.41±9.63 years; P=.47). In particular, 18% of the study population smoked, 29% were hypertensive, 19% were obese, 8% had diabetes, and 14% had MetS.
Participants’ clinical and demographic characteristics
| All (n=501) | Men (n=249) | Women (n=252) | P* | |
|---|---|---|---|---|
| Chronological age, y | 55.90±14.24 | 55.95±14.30 | 55.85±14.19 | .94 |
| Vascular age estimated by VaSera, y | 52.90±18.19 | 56.20±18.46 | 52.59±17.95 | .71 |
| Vascular age − chronological age, y | –3.08±10.15 | –2.76±10.64 | –3.41±9.63 | .47 |
| Framingham heart age, y | 52.98±17.31 | 55.09±16.53 | 50.92±17.85 | .007 |
| Heart age − chronological age, y | –2.98±10.13 | –0.92±10.21 | –5.01±9.65 | <.001 |
| Lifestyle habits | ||||
| Alcohol consumption, g/wk | 46.12±78.25 | 71.83±95.54 | 20.71±43.30 | <.001 |
| Appropriate alcohol consumption | 353 (70.5) | 135 (86.5) | 218 (54.2) | <.001 |
| Smoking index | 8.89±17.52 | 9.10±15.42 | 8.68±19.32 | .79 |
| Smokers | 90 (18.0) | 49 (19.7) | 41.00 (16.3) | .19 |
| MD adherence score | 7.15±2.07 | 6.68±1.97 | 7.60±2.08 | <.001 |
| Adherent to the MD, No. | 127 (25.3) | 42 (16.9) | 85 (32.7) | <.001 |
| Total physical activity, MET/h/wk | 8.08±0.66 | 8.29±0.73 | 7.86±0.50 | <.001 |
| Active | 249 (50.3) | 159 (64.1) | 90 (36.4) | <.001 |
| MetS components | ||||
| Systolic blood pressure, mmHg | 120.69±23.13 | 126.47±19.52 | 114.99±24.96 | <.001 |
| Diastolic blood pressure, mmHg | 75.53±10.10 | 77.40±9.37 | 73.67±10.46 | <.001 |
| Blood pressure ≥ 130/85 mmHg | 202 (40.3) | 115 (46.2) | 87 (36.3) | .002 |
| Hypertension | 147 (29.3) | 82 (32.9) | 65 (25.8) | <.001 |
| HDL-C, mg/dL | 58.75±16.16 | 53.19±14.12 | 64.22±28.54 | <.001 |
| Low HDL-C | 63 (12.7) | 32 (12.6) | 32 (12.8) | .53 |
| Triglycerides, mg/dL | 103.06±53.19 | 112.28±54.39 | 93.95±50.50 | <.001 |
| Elevated triglycerides | 74 (14.9) | 46 (18.6) | 28 (11.2) | .02 |
| Waist circumference, cm | 93.33±12.01 | 98.76±9.65 | 87.93±11.70 | <.001 |
| Abdominal obesity | 193 (38.6) | 78 (31.3) | 115 (45.8) | .001 |
| Baseline blood glucose level, mg/dL | 88.21±17.37 | 90.14±18.71 | 86.30±15.73 | .01 |
| Altered baseline blood glucose level | 71 (14.3) | 41 (16.6) | 30 (12.0) | .14 |
| Diabetic patients | 38 (7.6) | 26 (10.5) | 12 (4.8) | .012 |
| Metabolic syndrome | 70 (14.0) | 35 (14.1) | 35 (13.9) | >.99 |
| Drug therapy | ||||
| Antihypertensives | 96 (19.2) | 50 (20.1) | 46 (18.3) | .65 |
| Hypoglycemic agents | 35 (7.0) | 23 (9.2) | 12 (4.8) | .055 |
| Lipid-lowering agents | 102 (20.4) | 49 (19.7) | 53 (21.0) | .40 |
HDL-C, high-density lipoprotein-cholesterol; MD, Mediterranean diet; MET, metabolic equivalent; MetS, metabolic syndrome.
Continuous variables are expressed as mean±standard deviation and categorical variables as No. (%).
Age differences by age group (decade) and by sex are shown in figure 1A,B.
 and VA (B) from chronological age by age and sex. 95%CI, 95% confidence interval; HA, heart age; VA, vascular age.")
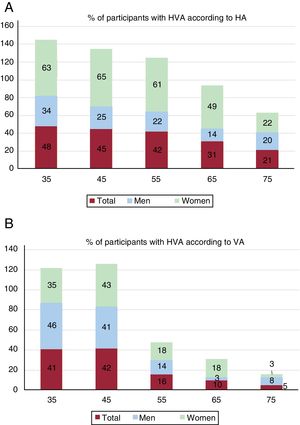
Of the participants, 38% (men, 23%; women, 52%; P<.001) had HVA according to HA; 22% (men, 21%; women, 23%; P=.044) had HVA according to VA. The percentages of participants with HVA decreased with age, overall and by sex (figure 2).
 and VA (B) according to age group, overall and by sex. HA, heart age; HVA, healthy vascular aging; VA, vascular age. Men vs women, P <.05.")
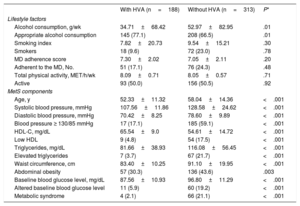
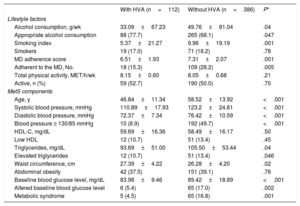
The mean values of lifestyle habits and MetS components of individuals with and without HVA are shown in table 2 and table 3 according to HA and VA, respectively. Individuals with HVA estimated by HA exhibited lower levels of alcohol consumption and MetS components than those without HVA, but higher levels of HDL-C. When VA criteria were used, individuals with HVA had lower alcohol consumption, smoking index, adherence to the Mediterranean diet, blood pressure, and baseline blood glucose and triglyceride levels and higher waist circumference than those with HVA.
Differences in lifestyle factors and metabolic syndrome components between individuals with and without HVA according to HA
| With HVA (n=188) | Without HVA (n=313) | P* | |
|---|---|---|---|
| Lifestyle factors | |||
| Alcohol consumption, g/wk | 34.71±68.42 | 52.97±82.95 | .01 |
| Appropriate alcohol consumption | 145 (77.1) | 208 (66.5) | .01 |
| Smoking index | 7.82±20.73 | 9.54±15.21 | .30 |
| Smokers | 18 (9.6) | 72 (23.0) | .78 |
| MD adherence score | 7.30±2.02 | 7.05±2.11 | .20 |
| Adherent to the MD, No. | 51 (17.1) | 76 (24.3) | .48 |
| Total physical activity, MET/h/wk | 8.09±0.71 | 8.05±0.57 | .71 |
| Active | 93 (50.0) | 156 (50.5) | .92 |
| MetS components | |||
| Age, y | 52.33±11.32 | 58.04±14.36 | <.001 |
| Systolic blood pressure, mmHg | 107.56±11.86 | 128.58±24.62 | <.001 |
| Diastolic blood pressure, mmHg | 70.42±8.25 | 78.60±9.89 | <.001 |
| Blood pressure ≥ 130/85 mmHg | 17 (17.1) | 185 (59.1) | <.001 |
| HDL-C, mg/dL | 65.54±9.0 | 54.61±14.72 | <.001 |
| Low HDL | 9 (4.8) | 54 (17.5) | <.001 |
| Triglycerides, mg/dL | 81.66±38.93 | 116.08±56.45 | <.001 |
| Elevated triglycerides | 7 (3.7) | 67 (21.7) | <.001 |
| Waist circumference, cm | 83.40±10.25 | 91.10±19.95 | <.001 |
| Abdominal obesity | 57 (30.3) | 136 (43.6) | .003 |
| Baseline blood glucose level, mg/dL | 87.56±10.93 | 96.80±11.29 | <.001 |
| Altered baseline blood glucose level | 11 (5.9) | 60 (19.2) | <.001 |
| Metabolic syndrome | 4 (2.1) | 66 (21.1) | <.001 |
HA, heart age; HDL, high-density lipoprotein; HDL-C, high-density lipoprotein-cholesterol; HVA, healthy vascular aging; MD, Mediterranean diet; MET, metabolic equivalent; MetS, metabolic syndrome.
Continuous variables are expressed as mean±standard deviation and categorical variables as No. (%).
Differences in lifestyle factors and metabolic syndrome components between individuals with and without HVA according to VA
| With HVA (n=112) | Without HVA (n=386) | P* | |
|---|---|---|---|
| Lifestyle factors | |||
| Alcohol consumption, g/wk | 33.09±67.23 | 49.76±81.04 | .04 |
| Appropriate alcohol consumption | 88 (77.7) | 265 (68.1) | .047 |
| Smoking index | 5.37±21.27 | 9.96±19.19 | .001 |
| Smokers | 19 (17.0) | 71 (18.2) | .78 |
| MD adherence score | 6.51±1.93 | 7.31±2.07 | .001 |
| Adherent to the MD, No. | 18 (15.3) | 109 (28.2) | .005 |
| Total physical activity, MET/h/wk | 8.15±0.60 | 8.05±0.68 | .21 |
| Active, n (%) | 59 (52.7) | 190 (50.0) | .70 |
| MetS components | |||
| Age, y | 46.84±11.34 | 58.52±13.92 | <.001 |
| Systolic blood pressure, mmHg | 110.89±17.93 | 123.2±24.81 | <.001 |
| Diastolic blood pressure, mmHg | 72.37±7.34 | 76.42±10.59 | <.001 |
| Blood pressure ≥ 130/85 mmHg | 10 (8.9) | 192 (49.7) | <.001 |
| HDL-C, mg/dL | 59.69±16.36 | 58.49±16.17 | .50 |
| Low HDL | 12 (10.7) | 51 (13.4) | .45 |
| Triglycerides, mg/dL | 93.69±51.00 | 105.50±53.44 | .04 |
| Elevated triglycerides | 12 (10.7) | 51 (13.4) | .046 |
| Waist circumference, cm | 27.39±4.22 | 26.28±4.20 | .02 |
| Abdominal obesity | 42 (37.5) | 151 (39.1) | .76 |
| Baseline blood glucose level, mg/dL | 83.98±9.46 | 89.42±18.89 | <.001 |
| Altered baseline blood glucose level | 6 (5.4) | 65 (17.0) | .002 |
| Metabolic syndrome | 5 (4.5) | 65 (16.8) | .001 |
HDL, high-density lipoprotein; HDL-C, high-density lipoprotein-cholesterol; HVA, healthy vascular aging; MD, Mediterranean diet; MET, metabolic equivalent; MetS, metabolic syndrome; VA, vascular age.
Continuous variables are expressed as mean±standard deviation and categorical variables as No. (%).
The association of the difference between chronological age and HA and VA with lifestyle habits and MetS components is shown in table 1 of the supplementary data.
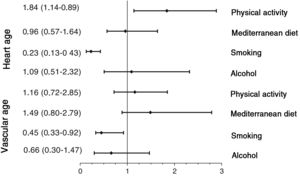
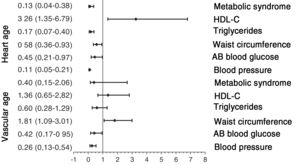
The results of adjusted logistic regression models are shown in figure 3 (lifestyle habits) and figure 4 (MetS and its components). The probability of HVA was reduced by several factors: smoking (odds ratio [OR], 0.232), blood pressure≥130/85mmHg (OR, 0.107), baseline blood glucose≥100 mg/dL (OR, 0.451), abdominal obesity (OR, 0.577), triglycerides≥150mg/dL (OR, 0.169), and MetS components (OR, 0.125). In contrast, the probability of HVA estimated by HA was increased by an active lifestyle (OR, 1.838) and elevated HDL-C (OR, 3.259). However, smoking (OR, 0.455), blood pressure 130/85mmHg (OR, 0.259), baseline blood glucose level≥100mg/dL (OR, 0.422), and MetS components (OR, 0.403) decreased the probability of HVA, whereas abdominal obesity (OR, 1.809) increased the probability of HVA estimated by VA.
. Independent variables: adequate lifestyle habits in 2 categories (no=0; yes=1). Adjustment variables: age, heart rate, sex (female=0; male=1), and use of hypotensive, hypoglycemic, and lipid-lowering drugs (no=0; yes=1). HA, heart age; HVA, healthy vascular aging; VA, vascular age.")
Association of HVA with lifestyle habits. Logistic regression analysis. Dependent variables: individuals with HVA estimated by HA and by VA (with HVA=0; without HVA=1). Independent variables: adequate lifestyle habits in 2 categories (no=0; yes=1). Adjustment variables: age, heart rate, sex (female=0; male=1), and use of hypotensive, hypoglycemic, and lipid-lowering drugs (no=0; yes=1). HA, heart age; HVA, healthy vascular aging; VA, vascular age.
. Independent variables: presence of MetS components (no=0; yes=1). Adjustment variables: age, heart rate, sex (female=0; male=1), and use of hypotensive, hypoglycemic, and lipid-lowering drugs (no=0; yes=1). AB, altered baseline; HA, heart age; HDL-C, high-density lipoprotein-cholesterol; HVA, healthy vascular aging; MetS, metabolic syndrome; VA, vascular age.")
Association of HVA with MetS and its components. Logistic regression analysis. Dependent variables: individuals with HVA estimated by HA and by VA (with HVA=0; without HVA=1). Independent variables: presence of MetS components (no=0; yes=1). Adjustment variables: age, heart rate, sex (female=0; male=1), and use of hypotensive, hypoglycemic, and lipid-lowering drugs (no=0; yes=1). AB, altered baseline; HA, heart age; HDL-C, high-density lipoprotein-cholesterol; HVA, healthy vascular aging; MetS, metabolic syndrome; VA, vascular age.
To the best of our knowledge, this is the first study to analyze the value of HA estimated with the Framingham equation and of VA estimated with the VaSera VS-1500 device using the difference between HA or VA and chronological age as an indicator of HVA. In addition, we examined the relationship of HVA with lifestyle factors and MetS components in the Spanish adult population between 35 to 75 years old and with no history of cardiovascular disease.
The main findings of this study are that the study population has a HA and VA 3 years lower than the chronological age. In addition, HVA was exhibited by 38% of the population when estimated by HA and by 22% when estimated by VA, with men showing lower percentages of HVA. Logistic regression analysis determined that HVA estimated by HA was associated with smoking index, physical activity, and all MetS components, whereas that estimated by VA was associated with smoking index, blood pressure, and abdominal obesity.
Vascular age and heart ageMost previous studies estimating HA or VA were performed using the Framingham equation.5 In contrast to the results of this work, all previous work showed that HA or VA was higher than chronological age by between 2 and 26 years.4 For example, a study assessing health in 12 European countries and Australia found a HA increase of 4.9 years in men and 3.3 years in women.12 Yang et al.,13 with data from 2011 to 2013 from the Behavioral Risk Factors Surveillance System in the United States, determined a VA increase of 7.8 years in men and 5.4 years in women from 30 to 74 years of age, whereas Tabaei et al.,14 with data from 2013 to 2015, found a HA increase of 5.7 years and that 43% of the participants had an estimated HA at least 5 years higher than their chronological age. In addition, the results of Appiah et al.,3 obtained from adults without cardiovascular disease included in the World Health Organization Study on Global Aging and Adult Health and in the US National Health and Nutritional Examination Survey, found excess HAs of 3.6, 4.2, 7.6, 8.1, 9.5, 10.5, and 6.2 years in participants from India, Ghana, Russia, China, Mexico, South Africa, and United States, respectively, with the following proportions of individuals with a HA excess > 5 years: Russia, 52%; China, 56%; Mexico, 59%; South Africa, 65%; United States, 45%; Ghana, 36%; and India, 36%; most of these percentages are higher than the 38% found in this study. The possible reasons for the differences from our results include overestimation of CVR with the Framingham equation,15 a lower prevalence of the main CVR factors used by the scales, and the percentage of individuals with a higher education (37.3%), higher than that reported in other work.3 Both hormonal and nonhormonal factors influence the differences between sexes. The protective effect of endogenous estrogen in premenopausal women is well-documented. In addition, arterial stiffness increases linearly in men from puberty and women inherently have stiffer main arteries than men, effects that are mitigated by sex steroids during reproductive life. Other possibly influencing factors include height, body fat distribution, and inflammatory factors.16,17
Association with lifestyle habitsIn line with the results of this study, various authors have reported that HVA is associated with lower tobacco consumption and higher physical activity.3,6,14 Nonetheless, the association of HVA with exercise was not found in the Framingham study.18 This discrepancy is probably due to differences in how physical activity was measured, objectively with accelerometry in this study and subjectively in the Framingham study. In agreement with these results, previous work has reported that higher physical activity (measured with accelerometry) is associated with lower vascular stiffness.19 However, not all lifestyle factors behaved as expected. For example, although alcohol consumption was lower in individuals with HVA, after adjustment for possible confounding variables, the regression analysis failed to find an association, in contrast to the results of previous studies.3,6 Adherence to the Mediterranean diet was also not associated with HVA in this work, in line with the findings of the Framingham study.18 However, other authors have reported such an association with some components of the Mediterranean diet, such as increased intake of fruit and vegetables.3,4,6
Association with metabolic syndrome componentsThe results indicate that all of the MetS components are associated with HVA estimated by HA, in line with the findings of previous publications that have used HA or VA estimated with SCORE as aging parameters.4,6,9,20 However, this relationship is not evident when HVA is estimated by VA using the VaSera device. In this case, it is only associated with blood pressure, altered baseline blood glucose, and waist circumference, although the association is opposite to what might be expected. Several studies, both in the healthy general population and in that with CVR factors, have shown a negative association of the CAVI with waist circumference and a positive association with blood pressure and blood glucose.21–24 However, the association with lipid components is not as clear, and some studies have confirmed the independence from dyslipidemia if rigidity is measured with the CAVI.21,22 The inverse association of the CAVI with waist circumference can be explained by metabolic reserves, an attenuated response to the renin-angiotensin-aldosterone system, increased muscle strength, and protective cytokines.21–23 In addition, a positive correlation has been described between body mass index and the aortic diameter measured by magnetic resonance.25 Finally, the CAVI reflects central and peripheral arterial stiffness and is less influenced by blood pressure values at the time of measurement.8 Nonetheless, further clarification is required of the cause-effect relationship between adipose tissue accumulation and the regulation of arterial pathophysiology.
In summary, the data from this study provide new information on the HA and VA of the Spanish adult population. These concepts have been shown to be more readily understood by patients than absolute CVR. This has led the Canadian Cardiovascular Society26 to recommend the use of HA and VA for communicating CVR and, in some cases, to modify drug therapy decisions, indicating that HA and VA reflect an individual's exposure to CVR factors better than chronological age.
Taking into account previous evidence2 and the results of this study, we believe that HA estimated with the Framingham equation is currently more supported than VA estimated with VaSera as a measure of vascular aging.
Strengths and limitationsThe main limitations of this work are the following: a) cross-sectional analyses cannot determine causality; b) the results of this study were obtained from an urban population of a Spanish city and individuals younger than 35 years and older than 75 were excluded; c) the Framingham equation can overestimate CVR; and d) intake was assessed using validated questionnaires, meaning that they were subjective measures. Finally, the prevalence of CVR factors in this study was lower than in other studies conducted in Caucasian populations. The main strengths are a random sampling of the population and that this is the first study to analyze the value of HA estimated with the Framingham equation and of the VA estimated with the VaSera VS-1500 device and to use the difference between participants’ HA or VA and their chronological age as an indicator of HVA.
CONCLUSIONSThe HA and VA of the Spanish population were 3 years lower than the chronological age. HA was associated with smoking, physical activity, and all MetS components, whereas VA was associated with smoking, blood pressure, waist circumference, and an altered baseline blood glucose level. Accordingly, these measures can be useful for evaluating vascular aging and establishing strategies to promote health in order to improve adherence to healthy lifestyles.
FUNDINGThis project was funded by the Spanish Ministry of Science and Innovation (MICINN), Instituto de Salud Carlos III/European Regional Development Fund (FEDER) (MICINN, ISCIII/FEDER) (Red RedIAPP, RD12/0005, RD16/0007), the Regional Health Service of Castile and León (GRS 1193/B/15), and the Research Activity Intensification Program (INT/M/02/17 and INT/M/04/15).
CONFLICTS OF INTERESTNone.
- –
Heart age and vascular age are better associated with chronological age than cardiovascular disease-related morbidity.
- –
They can be noninvasively measured using various methods.
- –
In most of the literature, both heart and vascular age are higher than the chronological age.
- –
This is the first study to analyze heart age and vascular age in a Spanish population sample.
- –
The results indicate that the general Spanish population without previous cardiovascular disease has heart and vascular ages 3 years lower than the chronological age.
- –
The association of healthy vascular aging with lifestyle factors and with metabolic syndrome components differs according to how it is estimated, by heart age or vascular age.
Manuel A. Gómez-Marcos, Luis García-Ortiz, José I. Recio-Rodríguez, Carlos Martínez-Salgado, Jesús M. Hernández-Rivas, Rogelio González-Sarmiento, Pedro L. Sánchez-Fernández, Emiliano Rodríguez-Sánchez, María C. Patino-Alonso, José A. Maderuelo-Fernández, Leticia Gómez-Sánchez, Jesús González-Sánchez, Rosa Alonso-Domínguez, Carmela Rodríguez-Martín, Marta Gómez-Sánchez, Ángela de Cabo-Laso, Benigna Sánchez-Salgado, Natalia Sánchez Aguadero, Sara Mora-Simón, Olaya Tamayo-Morales, José Ramón González-Porras, José María Bastida-Bermejo, and Isabel Fuentes-Calvo.
Supplementary data associated with this article can be found in the online version available at https://doi.org/10.1016/j.recesp.2020.06.033