
There is controversy about the optimal revascularization strategy in severe coronary artery disease (CAD), including left main disease and/or multivessel disease. Several meta-analyses have analyzed the results at 5-year follow-up but there are no results after the fifth year. We conducted a systematic review and meta-analysis of randomized clinical trials, comparing results after the fifth year, between coronary artery bypass grafting (CABG) and percutaneous coronary intervention (PCI) using drug-eluting stents in patients with severe CAD.
MethodsWe analyzed all clinical trials between January 2010 and January 2023. The primary endpoint was all-cause mortality. The databases of the original articles were reconstructed from Kaplan-Meier curves, simulating an individual-level meta-analysis. Comparisons were made at certain cutoff points (5 and 10 years). The 10-year restricted median survival time difference between CABG and PCI was calculated. The random effects model and the DerSimonian-Laird method were applied.
ResultsThe meta-analysis included 5180 patients. During the 10-year follow-up, PCI showed a higher overall incidence of all-cause mortality (HR, 1.19; 95%CI, 1.04-1.32; P=.008)]. PCI showed an increased risk of all-cause mortality within 5 years (HR, 1.2; 95%CI, 1.06-1.53; P=.008), while no differences in the 5–10-year period were revealed (HR, 1.03; 95%CI, 0.84-1.26; P=.76). Life expectancy of CABG patients was slightly higher than that of PCI patients (2.4 months more).
ConclusionsIn patients with severe CAD, including left main disease and/or multivessel disease, there was higher a incidence of all-cause mortality after PCI compared with CABG at 10 years of follow-up. Specifically, PCI has higher mortality during the first 5 years and comparable risk beyond 5 years.
Keywords
The 2021 American and 2018 European guidelines recommended percutaneous coronary intervention (PCI) as an alternative to coronary artery bypass grafting (CABG) in patients with left main disease (LMD) and multivessel disease (MVD), as well as with low-intermediate coronary complexity.1,2 These recommendations are based on 5-year follow-up results of randomized clinical trials (RCT) comparing PCI with drug-eluting stents (DES) and CABG, published during the last 10 years. However, the life expectancy for an 80-year-old person in Europe and the United States is around 9 years.3,4 Recent meta-analyses of RCTs comparing PCI with DES and CABG in patients with LMD and/or MVD have reported conflicting results between the 2 interventions in terms of 5-year overall survival, stroke, myocardial infarction (MI), and repeat revascularization, although most of the pooled results showed an advantage in favor of CABG over PCI.5–8 However, the choice of the optimal mode of coronary revascularization remains controversial, especially for many patients who have a life expectancy of more than 10 years.
The endpoints of many RCTs are limited to 5-year follow-up. However, survival curves of these RCTs frequently provide longer information. This information is not usually useful in individual studies due to low statistical power after 5 years because of deaths and censored events. However, this low statistical power could be overcome by a pooled analysis, which is one of the aims of the meta-analysis.9
Therefore, given the ongoing debate about the optimal revascularization strategy and considering that there are no meta-analyses of RCTs exploring the results of PCI with DES and CABG beyond 5 years, we conducted a comprehensive systematic review and meta-analysis with the aim of comparing very long-term outcomes between the 2 interventions.
METHODSThis meta-analysis was carried out in accordance with the Declaration of Helsinki of the World Medical Association. The study was exempted from ethics committee evaluation as the investigators of each trial obtained approval from their local ethics committees. The meta-analysis adhered to the Preferred Reporting Items for Systematic Reviews and Meta-Analyses (PRISMA) guidelines.10 The protocol was registered and published online in PROSPERO (The International Prospective Register of Systematic Reviews; ID: CRD42023401293).
Search strategyThe search strategy consisted of a comprehensive review of relevant studies published between January 1, 2010 and January 31, 2023 in 3 electronic databases: PubMed, Cochrane Central Register of Controlled Trials (CENTRAL), and EMBASE. The references lists of previous meta-analyses and relevant articles were also used to complete the search.
Using Boolean operators (“AND” or “OR”), the search strings included (‘multivessel coronary artery disease’) AND (‘left main disease’ OR ‘left main coronary artery disease’) AND (‘coronary artery bypass’ OR ‘CABG’) AND (‘percutaneous coronary intervention’ OR ‘PCI’) AND (‘drug-eluting stents’ OR ‘DES’ OR stenting) AND (‘randomized’ OR ‘randomized’ OR ‘trials’) AND (‘long-term follow-up’ OR ‘extended follow-up’). The literature search was refined by a medical librarian. The search algorithm is shown in the trial details in the supplementary data and on table 1 of the supplementary data.
Inclusion criteriaStudy eligibility criteria followed the PICOS format (Population; Intervention; Comparison; Outcomes; Studies). The population consisted of patients with severe CAD affected by LMD and or MVD and deemed eligible for either CABG or PCI; Intervention: PCI; Comparison: CABG operation; Outcomes: overall survival and incidence of stroke, MI and repeat revascularization at the maximum available follow-up; Studies: only RCTs written in the English language that reported graphed Kaplan-Meier curves of very long-term follow-up (beyond 5-years) of the outcomes of interest. Two authors (DT, CP) independently scanned and reviewed titles and abstracts and disagreement was resolved by a senior author (FF).
Data extraction and collectionTwo authors (AG, DT) independently extracted data from the main text and supplementary data of the RCTs included in the analysis. Data were then collected in a standard table sheet database (Microsoft Office Excel 2016, Microsoft, United States). The included trials were listed by first author, study period and year of publication, preoperative characteristics, and postoperative outcomes. Disagreement was resolved by a senior author (FF).
Risk of bias assessmentTwo authors (NF, FF) assessed the quality of the studies and the risk of bias using the Cochrane Collaboration revised tool for randomized control trials (RoB 2).11 See table 2 of the supplementary data.
EndpointsThe primary endpoint was the incidence of all-cause mortality. The secondary endpoints were the incidence of repeat coronary revascularization, myocardial infarction (MI), cardiovascular death, stroke, composite outcomes (all-cause mortality, stroke, and MI) and major adverse cardiac and cerebrovascular events (MACCE) including all-cause mortality, stroke, MI, and repeat coronary revascularization.
Statistical analysisContinuous variables are reported as mean ±standard deviation (SD). Variables expressed in median and interquartile ranges were converted into mean and SD using a validated formula.12 Categorical variables are reported as number and percentages.
The pooled size effect estimates for the primary and secondary endpoints were compared using odds ratio (OR) and 95% confidence interval (95%CI) and were calculated according to the random effect model and the DerSimonian-Laird method. Forest plots were created to represent the primary outcome and to determine the effect size. Heterogeneity was evaluated with chi-square and I2 tests and was defined as absent or low for I2 ranging from 0% to 25%, moderate for I2 ranging from 26% to 50%, and high for I2 above 50%.13 We performed a sensitivity analysis according to the leave-one-out method14 to identify the influence of a single study on the primary outcome if heterogeneity was significant.
To assess the entire length of follow-up of each trial, individual patient data (IPD) were extracted from the original K-M survival curves using the method described by Wei et al.15,16 We used dedicated software (GetData Graph Digitizer version 2.5.3, Digitizelt, Germany) to digitize the K-M curves by importing time (abscissa-x) and survival probability (ordinate-y) values from the original K-M curves. The IPD of each study were reconstructed by combining the extracted value of time and survival with the patients at risk. Then, we merged the reconstructed IPD from all studies to create the study dataset.17 Cox proportional hazards models with inclusion of frailty term to account for heterogeneity among trials were used to compare the 2 arms and the hazard ratio (HR) with 95%CI were calculated.18 The proportionality of hazard assumption was assessed for the primary endpoint and was tested by visual inspection of K-M curves, log-minus-log plots, predicted-vs-observed survival curves and the scaled Schoenfeld residuals.18,19 A P value <.05 indicated a violation of proportionality. Given the potential different long-term (0-5 years) and very long-term risks (5-10 years) of the 2 interventions, landmark analysis with a 5-years cutoff was planned and performed. Further, a flexible parametric model for survival analysis was used to obtain the time-dependent HRs (Royston-Parmar models) using a restricted cubic spline function. We used the restricted mean survival time (RMST) method to compare the mean survival time between CABG and PCI at a specified truncation time (t*). The RMST represents a measure of life expectancy between the time of intervention and the t* and was calculated as the area under the survival curve for each arm. We selected t*=5 years, t*=8 years and t*=10 years for the following reasons: a) all trials have follow-ups longer than 5 years; b) 8 years was the longest follow-up shared by the 4 trials; and c) 10 years was the maximum available longest follow-up. We calculated the difference of RMST between CABG and PCI, which is interpretable as the number of life years gained with CABG compared with PCI.18,20,21 All the statistical analyses were computed with Stata/SE version 16.1 (Stata Corp, United States). Statistical significance was indicated by a 2-tailed P value <.05.
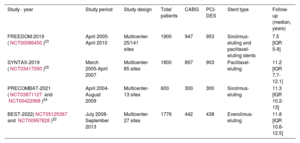
ResultsThe literature search identified 475 records and 13 studies were considered relevant and then retrieved. Among them, 4 RCTs (BEST,22 [NCT05125367-NCT00997828], FREEDOM,23 [NCT00086450], PRECOMBAT,24 [NCT03871127-NCT00422968] and SYNTAX,25 [NCT03417050]) met the eligibility criteria and were included in the final analysis. The PRISMA flow chart of study selection is shown in figure 1 of the supplementary data. The trials included 5180 patients, who were randomly assigned to CABG (n=2586) or to PCI-DES (n=2594). All trials reported follow-up beyond 5-years with a mean weighted length of follow-up of 10.23 years. Specifically, BEST,22 PRECOMBAT,24 and SYNTAX25 reported 10-year follow-ups for all-cause mortality, while FREEDOM23 reported an 8-year follow-up. In addition, FREEDOM separately reported the survival analysis of the whole cohort (n=1900) and of the extended cohort (n=943). SYNTAX25 included patients with LMD and MVD and the first-generation stent (paclitaxel-eluting stent) was used in all patients. FREEDOM23 exclusively included patients with diabetes with MVD and first-generation stents were used. BEST22 enrolled patients with at least 2 major epicardial vessels (≥ 2.0mm in diameter) in at least 2 separate coronary artery territories. PRECOMBAT24 enrolled patients with unprotected LMD. The baseline variables of patients enrolled in each trial are reported in table 1. Baseline characteristics of single trials are showed in table 2. The endpoint definition of single trials is shown in the supplementary data.
Baseline variables of enrolled patients
| Variables | BEST22 | FREEDOM23* | PRECOMBAT24 | SYNTAX 5 | ||||
|---|---|---|---|---|---|---|---|---|
| PCI | CABG | PCI | CABG | PCI | CABG | PCI | CABG | |
| No. of patients | 438 | 442 | 475/953 | 482/947 | 300 | 300 | 903 | 897 |
| Mean or no. | SD or % | Mean or no. | SD or % | Mean or no. | SD or % | Mean or no. | SD or % | Mean or no. | SD or % | Mean or no. | SD or % | Mean or no. | SD or % | Mean or no. | SD or % | |
|---|---|---|---|---|---|---|---|---|---|---|---|---|---|---|---|---|
| Age | 64 | 9.3 | 64.9 | 9.4 | 62.9 | 9.3 | 63.1 | 9.4 | 61.8 | 10 | 62.7 | 9.5 | 65.2 | 9.7 | 65 | 9.8 |
| Male sex | 304 | 69.4 | 325 | 73.5 | 361 | 76 | 344 | 71.4 | 228 | 76 | 231 | 77 | 690 | 76.4 | 708 | 78.9 |
| BMI | 24.7 | 2.9 | 25 | 2.9 | 29.7 | 5.2 | 29.9 | 5.4 | 24.6 | 2.7 | 24.5 | 3 | 28.1 | 4.8 | 27.9 | 4.5 |
| Medical diabetes | ||||||||||||||||
| Any | 177 | 40.4 | 186 | 42.1 | 953 | 100 | 947 | 100 | 102 | 34 | 90 | 30 | 231 | 25.6 | 221 | 24.6 |
| Requiring insulin | 20 | 84.6 | 18 | 4.1 | 322 | 33.8 | 293 | 947 | 10 | 3.3 | 9 | 3 | 89 | 9.9 | 93 | 10.4 |
| Hypertension | 296 | 67.6 | 295 | 66.7 | 411 | 86.5 | 407 | 84.4 | 163 | 54.3 | 154 | 51.3 | 630 | 69.8 | 574 | 64 |
| Hyperlipidemia | 239 | 54.6 | 222 | 50.2 | -- | -- | -- | -- | 127 | 4.3 | 120 | 40 | 711 | 78.7 | 692 | 77.2 |
| Smoker (current) | 88 | 20.1 | 89 | 20.1 | 80 | 16.8 | 82 | 17 | 89 | 29.7 | 83 | 27.7 | 167 | 18.5 | 197 | 22 |
| Previous PCI | 30 | 6.8 | 38 | 8.6 | -- | -- | -- | -- | 38 | 12.7 | 38 | 12.7 | -- | -- | -- | -- |
| Previous MI | 25 | 5.7 | 29 | 6.6 | 109 | 22.9 | 96 | 19.9 | 13 | 4.3 | 20 | 6.7 | 288 | 31.9 | 303 | 33.8 |
| Previous CHF | 16 | 3.7 | 12 | 2.7 | -- | -- | -- | -- | 0 | 0 | 2 | 0.7 | 36 | 4 | 47 | 5.3 |
| Previous stroke | 37 | 8.4 | 33 | 7.5 | 25 | 5.7 | 21 | 4.4 | 35 | 3.9 | 43 | 4.8 | ||||
| Chronic renal failure | 9 | 2.1 | 7 | 1.6 | -- | -- | -- | -- | 4 | 1.3 | 1 | 0.3 | ||||
| PVD | 15 | 3.4 | 12 | 2.7 | -- | -- | -- | -- | 15 | 5 | 7 | 2.3 | 73 | 8.1 | 75 | 8.4 |
| COPD | 8 | 1.8 | 6 | 1.4 | -- | -- | -- | -- | 6 | 2 | 10 | 3.3 | ||||
| Clinical presentation | ||||||||||||||||
| Stable angina | 210 | 47.9 | 204 | 46.2 | -- | -- | -- | -- | 160 | 53.3 | 137 | 45.7 | 514 | 56.9 | 513 | 57.2 |
| Unstable angina | 185 | 42.2 | 199 | 45 | -- | -- | -- | -- | 128 | 42.7 | 144 | 48 | 261 | 28.9 | 251 | 28 |
| AMI (< 90 d) | 43 | 9.8 | 39 | 8.8 | -- | -- | -- | -- | -- | -- | -- | -- | -- | -- | -- | -- |
| Recent MI (within 7 d of randomization) | -- | -- | -- | -- | -- | -- | -- | -- | -- | -- | -- | -- | -- | -- | -- | -- |
| Recent acute coronary syndrome | -- | -- | -- | -- | 161 | 33.9 | 152 | 31.5 | -- | -- | -- | -- | -- | -- | -- | -- |
| Unstable angina and recent NSTEMI | -- | -- | -- | -- | -- | -- | -- | -- | 12 | 4 | 19 | 6.3 | -- | -- | -- | -- |
| EF | 59.1 | 8.5 | 59.9 | 8.1 | 65.7 | 12.1 | 66.6 | 10.5 | 61.7 | 8.3 | 60.6 | 8.5 | -- | -- | -- | -- |
| No. of diseased vessels | ||||||||||||||||
| 3 | 330 | 75.3 | 349 | 79 | 394/474 | 83.1 | 414/480 | 86.3 | 122 | 40.7 | 123 | 41 | 546 | 60 | 549 | 61 |
| 2 | 108 | 24.7 | 93 | 21 | -- | -- | -- | -- | 101 | 33.7 | 90 | 30 | -- | -- | -- | -- |
| EuroSCORE | ||||||||||||||||
| Mean score | 2.9 | 2 | 3 | 2.1 | 2.8 | 2.7 | 2.8 | 2.8 | 2.6 | 1.8 | 2.8 | 1.9 | 2.8 | 2.6 | 3.8 | 2.7 |
| Median | 2.0 | (1.3-3.2) | 2.1 | (1.3-3.3) | -- | -- | -- | -- | -- | -- | -- | -- | ||||
| SYNTAX score | ||||||||||||||||
| Mean score | 24.2 | 7.5 | 24.6 | 8.1 | 26.9 | 8.2 | 26.1 | 8.1 | 24.3 | 9.6 | 25.3 | 10.9 | 28.4 | 11.5 | 29.1 | 11.4 |
| Median | -- | -- | -- | -- | 27 | (21-31.5) | 26 | (20-31) | -- | -- | -- | -- | -- | -- | -- | -- |
| ≥ 33 | 66 | 15.1 | 79 | 17.9 | 98 | 20.6 | 92/479 | 19.2 | 58 | 19.3 | 68 | 22.7 | 290 | 32.1 | 315 | 35.1 |
| 22-32 | 187 | 42.7 | 177 | 40.0 | 228 | 48 | 220/479 | 45.9 | 102 | 34.0 | 97 | 32.3 | 310 | 34.3 | 300 | 33.4 |
| ≤ 22 | 185 | 42.2 | 186 | 42.5 | 149 | 31.4 | 167/479 | 34.9 | 129 | 43.0 | 104 | 34.7 | 299 | 33.1 | 275 | 30.7 |
AMI, acute myocardial infarction; BMI (kg/m2), body mass index; CABG, coronary artery bypass grafting; CHF, congestive heart failure; COPD; chronic obstructive pulmonary disease; EF, ejection fraction; MI; myocardial infarction; NSTEMI, non-ST segment elevation myocardial infarction; PCI, percutaneous coronary intervention; PVD, peripheral vascular disease; SD, standard deviation.
Baseline characteristics of trials included in the meta-analysis
| Study - year | Study period | Study design | Total patients | CABG | PCI-DES | Stent type | Follow-up (median, years) |
|---|---|---|---|---|---|---|---|
| FREEDOM-2019 (NCT00086450)23 | April 2005-April 2010 | Multicenter-25/141 sites | 1900 | 947 | 953 | Sirolimus-eluting and paclitaxel-eluting stents | 7.5 [IQR 5-9] |
| SYNTAX-2019 (NCT03417050)25 | March 2005-April 2007 | Multicenter-85 sites | 1800 | 897 | 903 | Paclitaxel-eluting | 11.2 [IQR 7.7-12.1] |
| PRECOMBAT-2021 (NCT03871127 and NCT00422968)24 | April 2004-August 2009 | Multicenter-13 sites | 600 | 300 | 300 | Sirolimus-eluting | 11.3 [IQR 10.2-13] |
| BEST-2022(NCT05125367 and NCT00997828)22 | July 2008-September 2013 | Multicenter-27 sites | 1776 | 442 | 438 | Everolimus-eluting | 11.8 [IQR 10.6-12.5] |
CABG, coronary artery bypass grafting; CAD, coronary artery disease; DES, drug-eluting stent; PCI, percutaneous coronary intervention.
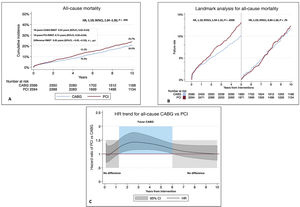
The Cox linear regression frailty model revealed that PCI was associated with a higher rate of all-cause mortality compared with CABG (HR, 1.19; 95%CI, 1.04-1.32; P=.008, frailty theta 0.08; figure 1A). The proportional hazard assumption was not violated (P=.4). Additional log-minus-log survival curves, predicted-vs-observed survival functions and the scaled Schoenfeld residuals plot are shown in the supplementary data (figures 2-4 of the supplementary data). The landmark analysis showed a greater risk of adverse events for PCI compared with CABG in the 0–5-year period (HR, 1.2; 95%CI, 1.06-1.53; P=.008), while no difference was found in the 5–10-year period (HR, 1.03; 95%CI, 0.84-1.26; P=.76, see figure 1B). The 10-year RMST difference was statistically significant at 0.20 years (95%CI, 0.05-0.35; P=.007), suggesting a prolonged life expectancy by 0.20 years (2.4 months) in patients with CABG compared with patients with PCI (figure 2; table 3 of the supplementary data).
 or percutaneous coronary intervention (PCI) and 10-year restricted mean survival time (RMST). B: landmark analysis for all-cause mortality following CABG or PCI. C: hazard ratio trend over time for all-cause CABG vs PCI estimated by a fully parametric model for survival analysis. 95%CI, 95% confidence interval; HR, hazard ratio.")
A: Kaplan-Meier incidence function plot of reconstructed individual patient data analysis for all-cause mortality following coronary artery bypass grafting (CABG) or percutaneous coronary intervention (PCI) and 10-year restricted mean survival time (RMST). B: landmark analysis for all-cause mortality following CABG or PCI. C: hazard ratio trend over time for all-cause CABG vs PCI estimated by a fully parametric model for survival analysis. 95%CI, 95% confidence interval; HR, hazard ratio.
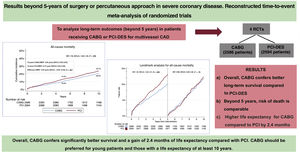
 comparing coronary artery grafting (CABG) and percutaneous coronary intervention (PCI) with drug-eluting stents (DES) in patients with coronary artery disease (CAD). Ten-year follow-up showed that PCI-DES was associated with an overall incidence of long-term mortality (HR, 1.19; 95%CI, 1.04-1.35; P=.008). At landmark analysis, PCI showed an increased risk of all-cause mortality within 5 years (HR, 1.2; 95%CI, 1.06-1.53; P=.008), while no differences in the 5–10-year period were revealed (HR, 1.03; CI 95%, 0.84-1.26, P=.76). Restricted mean survival time (RMST) showed a slightly higher life expectancy in CABG patients than that in PCI patients of 0.20 years more (2.4 months). 95%CI, 95% confidence interval; HR, hazard ratio.")
Central illustration. Reconstructed Kaplan-Meier survival curves of 4 randomized controlled trials (RCTs) comparing coronary artery grafting (CABG) and percutaneous coronary intervention (PCI) with drug-eluting stents (DES) in patients with coronary artery disease (CAD). Ten-year follow-up showed that PCI-DES was associated with an overall incidence of long-term mortality (HR, 1.19; 95%CI, 1.04-1.35; P=.008). At landmark analysis, PCI showed an increased risk of all-cause mortality within 5 years (HR, 1.2; 95%CI, 1.06-1.53; P=.008), while no differences in the 5–10-year period were revealed (HR, 1.03; CI 95%, 0.84-1.26, P=.76). Restricted mean survival time (RMST) showed a slightly higher life expectancy in CABG patients than that in PCI patients of 0.20 years more (2.4 months). 95%CI, 95% confidence interval; HR, hazard ratio.
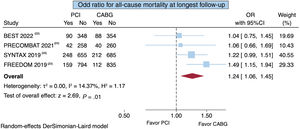
The time-varying HR analysis of PCI vs CABG was consistent with the results of the landmark analysis (figure 1C). PCI and CABG showed comparable results in the first year after surgery. Thereafter, the benefit of CABG became clearly superior to PCI until about 6 years. Beyond 6 years the benefit of CABG was lost, and the 2 interventions were comparable. The point estimate for all-cause mortality at the maximum available follow-up of 10 years showed a higher risk of death for PCI compared with CABG (OR, 1.24; 95%CI, 1.06–1.45; P=.01) with low heterogeneity (I2=14.37%) (figure 3).
Secondary endpoints or percutaneous coronary intervention (PCI). 95%CI, 95% confidence interval; OR, odds ratio.")
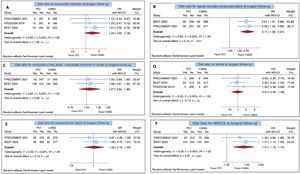
Data on MI beyond 5 years of follow-up were reported in BEST,22 FREEDOM23 and PRECOMBAT24. In the FREEDOM 23 trial, data on MI were recorded in 415 patients. The overall effect for MI showed that PCI and CABG were comparable (OR, 1.42; 95%CI, 0.92-2.18; P=.11) with no statistical heterogeneity (I2=0%; figure 4A).
 or percutaneous coronary intervention (PCI). B: overall effect for repeat coronary revascularization at the maximum follow-up of 10 years following CABG or PCI. C: overall effect for composite of all-cause mortality, myocardial infarction or stroke at the maximum 10-year follow-up following CABG or PCI. D: overall effect for stoke at the maximum 10-year follow-up following CABG or PCI. E: overall effect for cardiovascular death at the maximum 10-year follow-up following CABG or PCI. F: overall effect for major adverse and cerebrovascular event (MACCE) at the maximum follow-up following CABG or PCI. 95%CI, 95% confidence interval; OR, odds ratio.")
A: overall effect for myocardial infarction at the maximum follow-up of 10 years following coronary artery bypass grafting (CABG) or percutaneous coronary intervention (PCI). B: overall effect for repeat coronary revascularization at the maximum follow-up of 10 years following CABG or PCI. C: overall effect for composite of all-cause mortality, myocardial infarction or stroke at the maximum 10-year follow-up following CABG or PCI. D: overall effect for stoke at the maximum 10-year follow-up following CABG or PCI. E: overall effect for cardiovascular death at the maximum 10-year follow-up following CABG or PCI. F: overall effect for major adverse and cerebrovascular event (MACCE) at the maximum follow-up following CABG or PCI. 95%CI, 95% confidence interval; OR, odds ratio.
BEST22 and PRECOMBAT24 reported data for repeat coronary revascularization. The overall effect measure analysis showed that PCI was associated with a higher risk of repeat coronary revascularization (OR, 2.11; 95%CI, 1.58-2.81; P <.001) with no statistical heterogeneity (I2=0%; figure 4B). Both trials reported the K-M curves. The time-to-event reconstructed curves are presented in the supplementary data (figure 5 of the supplementary data).
BEST22 and PRECOMBAT24 reported data for composite of all-cause mortality, stroke, or MI. The overall effect measure analysis showed that PCI and CABG were comparable at the maximum available follow-up (OR 1.07; 95%CI, 0.84-1.36; P=.57) with no evidence of heterogeneity (I2=0%; figure 4C). Both trials reported K-M curves for this composite outcome. The time-to-event reconstructed curves are shown in figure 6 of the supplementary data.
Data on stroke beyond 5 years of follow-up were reported in BEST, 22 FREEDOM23 and PRECOMBAT.24 In FREEDOM,23 data were recorded in 415 patients. The rate of stroke was comparable between the 2 interventions (OR, 0.97; 95%CI, 0.59-1.59; P=.91) without heterogeneity (I2=0%; figure 4D).
BEST22 and PRECOMBAT24 reported data for cardiovascular death. The overall effect measure analysis showed that PCI and CABG were comparable (OR, 1.02; 95%CI, 0.75-1.40; P=.90) with no heterogeneity (I2=0%; figure 4E).
BEST22 and PRECOMBAT24 reported data for MACCE. PCI was associated with a higher rate of MACCE compared with CABG at the maximum available follow-up (OR, 1.41; 95%CI, 1.13-1.75; P <.0001) with no evidence of heterogeneity (I2=0%; figure 4F).
DISCUSSIONThe need for long-term investigation of the safety and efficacy of drugs used for the prevention and treatment of severe CAD has been suggested due to the ongoing biological effects of drugs commonly used in coronary patients.26 In parallel, there is evidence supporting the importance of conducting follow-ups longer than 5 years to better understand the effects of drug therapy compared with surgery27 or different interventional approaches.28
The principal finding of this reconstructed IPD study-level meta-analysis of RCTs is that, at the maximum follow-up period of 10 years, PCI was associated with a significantly greater risk of overall mortality than CABG. We estimated a 13.3% vs 10.2% incidence of death at 5 years following PCI and CABG, respectively. At 10 years, the incidence of death was still higher with PCI (23.7% and 20.5%, respectively). However, this benefit was evident in the first 5-year follow-up; after this time, the risk of death was similar between the 2 interventions. Overall, we estimated a 2.4-month total gain in life expectancy in patients treated with CABG, compared with those treated with PCI, indicating an overall favorable outcome for CABG. Of note, the results of the primary and secondary endpoints reported in this study were based on data extracted from the studies included in the meta-analysis and not from real-world data. Consequently, any assumptions about outcomes beyond 5 years up to 10 years should be considered associations rather than causation.
Because previous IPD meta-analyses of RCTs5,6,29 have already reported heterogeneous results of 5-year overall mortality in patients with LMD and/or MVD treated with CABG or PCI-DES, we considered it would be interesting to perform the landmark analysis at a cutoff time of 5 years, despite the proportional hazard assumption not being violated. Interestingly, the incidence of all-cause mortality was significantly higher with PCI at the 0 to 5-year interval, while no difference was observed at the 5- to 10-year interval. During this timeframe, survival curves stopped diverging and become parallel. Therefore, for many patients, the decision between CABG or PCI should not be based on life expectancy, but on frailty or other considerations. The reasons for these different scenarios are multifactorial. One explanation could be related to the follow-up available in the FREEDOM23 trial, which reported data from an 8-year follow-up including patients from only 25 of the 141 participating centers that agreed to participate in the extended follow-up study. Another explanation could be related to the cardiovascular-related death outcome, which might be challenging to define even in RCTs, and therefore cardiovascular death may not have been adjudicated appropriately in the 2 interventions.
Several factors, including the extensive use of multiple arterial grafts and performing graft anastomosis distal to the coronary stenosis, are associated with a significant reduction in the incidence of mortality in long-term follow-up. Several studies have reported a very high late survival rate (beyond 10 years) in patients who underwent CABG with multiple arterial grafts and these findings should be considered in Heart Team discussions.30–33 At the same time, advances in DES technology and increased adherence to dual antiplatelet therapy could greatly help to progressively reduce the incidence of mortality and complications after PCI.34,35
Based on the available data extracted to analyze the secondary endpoints at the maximum follow-up of 10 years, the principal findings include a comparable incidence of MI, stroke, cardiovascular death and the composite of death, MI, or stroke. Interestingly, the incidence of repeat coronary revascularization and MACCE were higher in PCI. Analysis of secondary endpoints is of strong interest to guide Heart-Teams in making the most appropriate choice between the 2 interventions in clinical scenarios where patients present with severe CAD potentially treatable with CABG or PCI. Unfortunately, the paucity of such data and the different definitions of the related outcomes adopted in the protocol of the included studies did not allow us to standardize the endpoints and have more complete and confident long-term results. Of note, the primary outcome of all-cause mortality was defined in the same way in all trials, while there may be some bias in the measurement of other outcomes. For instance, data on secondary endpoints were reported extensively in BEST and PRECOMBAT, while FREEDOM reported limited data on the incidence of stroke and myocardial infarction. Therefore, we acknowledge that the results of secondary endpoints should be interpreted with caution.
This meta-analysis has several strengths and limitations. To the best of our knowledge, a strength of this study is that it represents the first reconstructed study-level IPD meta-analysis of RCTs focusing on follow-up beyond 5-years and has important clinical implications. Firstly, it includes trials with follow-up longer than 5 years and some previously unreported data. Second, we performed a reconstructed IPD meta-analyses curve to generate aggregated Kaplan-Meier plots and landmark analyses of the primary endpoint at 5 years. The sample size beyond 5-years was more than 3700 patients, which allowed assessment of the entire follow-up duration of each RCT, and to calculate the overall RMST of the primary endpoint for each intervention.
LimitationsAs limitations, first, the inclusion and exclusion criteria differed in all the included trials; therefore, many patients were not included in the randomization according to the decision of the Heart Team of each trial. This might explain why patients with SYNTAX score >33 were poorly represented in all trials. Second, individual trials reported different endpoint definition. While all-cause mortality was an unbiased measure outcome in all included trial, the other outcomes of interest were reported heterogeneously and might be affected by competing risk bias. Third, the comparison beyond 5 years could be biased by competing risk because it did not include events occurring in the first 5 years. In addition, beyond 5 years, the number of outcomes and patients gradually decreased and could reduce the likelihood of detecting significant differences between groups. Fourth, the trials were conducted in a period of more than 10 years and different DES technology and generations were used. Finally, the results were derived from extracted data rather than real-world data and should be interpreted with caution.
CONCLUSIONSBased on the results of this reconstructed IPD meta-analysis, patients with LMD and or MVD had a significantly overall higher incidence of all-cause mortality after PCI compared with CABG beyond 5 years of follow-up. Specifically, CABG still showed favorable results beyond 5 years and maintained its role as the gold standard treatment for severe CAD. PCI showed higher mortality during the first 5 years and a comparable outcome beyond 5 years.
- –
Recent meta-analyses of randomized controlled trials comparing PCI with DES and CABG in patients with coronary artery disease have reported conflicting results in terms of 5-year overall survival, stroke, myocardial infarction and repeat revascularization, although most pooled results showed an advantage in favor of CABG over PCI with DES.
- –
However, there are no prior meta-analyses reporting follow-up beyond 5 years and the choice of the optimal mode of coronary revascularization remains controversial, especially for many patients who have a life expectancy of more than 10 years.
- –
This study shows that CABG is associated with a lower cumulative incidence of late all-cause mortality than PCI with DES over a 10-year follow-up.
- –
Specifically, CABG remains favorable within the first 5 years, while the 2 procedures have a comparable risk beyond 5 years.
- –
Overall, the 10-year life expectancy of patients undergoing CABG is 2.4 months longer than that of patients undergoing PCI.
- –
Based on these results, CABG should be preferred for young patients and those with a life expectancy of at least 10 years.
This meta-analysis was performed without funding.
ETHICAL CONSIDERATIONSThe study was exempted from ethics committee evaluation as the investigators of each trial obtained approval from their local ethics Committees.
STATEMENT ON THE USE OF ARTIFICIAL INTELLIGENCENo artificial intelligence software or systems have been used in the manuscript.
AUTHORS’ CONTRIBUTIONSThe authors confirm contributions to the article as follows: F. Formica was in charge of the conceptualization, methodology, formal analysis, and supervision; he prepared the original draft, and reviewed, edited and validated the final draft. D. Hernandez-Vaquero was in charge of the formal analysis, and reviewed, edited and validated the final draft. D. Tuttolomondo was in charge of data extraction. A. Gallingani was in charge of data extraction. G. Singh reviewed and edited the final draft. C. Pattuzzi was in charge of data extraction. G. Niccoli was in charge of methodology. R. Lorusso reviewed and edited the final draft. F. Nicolini was in charge of the conceptualization, methodology, and supervision. All authors reviewed the results and approved the final version of the manuscript.
CONFLICTS OF INTERESTNone declared.
The authors wish to thank Giorgia Pavan for her tireless contribution in English revision of the manuscript and Evelina Ceccato (medical librarian at University of Parma, Italy) for her invaluable support in literature search.