Recent genome-wide association studies have identified a locus on chromosome 12q13.3 associated with plasma levels of triglyceride and high-density lipoprotein cholesterol, with rs11613352 being the lead single nucleotide polymorphism in this genome-wide association study locus. The aim of the study is to investigate the involvement of rs11613352 in a population with high cardiovascular risk due to familial hypercholesterolemia.
MethodsThe single nucleotide polymorphism was genotyped by Taqman® assay in a cohort of 601 unrelated familial hypercholesterolemia patients and its association with plasma triglyceride and high-density lipoprotein cholesterol levels was analyzed by multivariate methods based on linear regression.
ResultsMinimal allele frequency was 0.17 and genotype frequencies were 0.69, 0.27, and 0.04 for CC, CT, and TT genotypes, respectively. The polymorphism is associated in a recessive manner (TT genotype) with a decrease in triglyceride levels (P=.002) and with an increase in high-density lipoprotein cholesterol levels (P=.021) after adjusting by age and sex.
ConclusionsThe polymorphism rs11613352 may contribute to modulate the cardiovascular risk by modifying plasma lipid levels in familial hypercholesterolemia patients.
Keywords
Familial hypercholesterolemia (FH) is among the most common inherited disorders and is characterized by severely elevated plasma low-density lipoprotein (LDL) cholesterol levels and premature atherosclerotic disease. Mutations of the classical LDL receptor gene are the main cause of this disease. However, there is a substantial variation in the onset and severity of atherosclerosis in heterozygous FH patients, which might be due to environmental, metabolic, and additional genetic factors.1,2
Among candidate genes/regions involved in lipid metabolism, the single nucleotide polymorphism rs11613352 found in genome-wide association studies (GWAS) as a lead single nucleotide polymorphism in the locus on chromosome 12q13.3 was associated with a significant decrease in triglycerides (TG) and with an increase in high-density lipoproteins (HDL) plasma levels3 as well as with lower serum urate levels.4
The aim of the study was to analyze for the first time the association of this polymorphism with plasma lipid levels in this atherosclerosis-prone population (FH).
METHODSPopulation StudiedThe 601 unrelated patients were randomly selected index cases of FH families from the Spanish FH Longitudinal Cohort Study (SAFEHEART) for inclusion in the study. The main characteristics of the FH Cohort have been previously reported.5,6 Anthropometric data such as body mass index (Kg/m2), waist circumference, waist-to-hip ratio calculated by dividing waist circumference by hip circumference, and presence of arcus cornealis, xanthomas, diabetes mellitus, hypertension, and smoking habit, along with biochemical levels of plasma lipids were obtained for each subject as previously described5,6 and are more deeply detailed in the .
The FH patients were considered positive for clinical manifestations of cardiovascular disease (CVD) if they had a documented history of myocardial infarction, coronary artery bypass graft surgery, percutaneous transluminal coronary angioplasty, angina pectoris with angiographically coronary atherosclerosis (>50% stenosis), ischemic atherothrombotic stroke, or chronic arterial peripheral vascular disease.
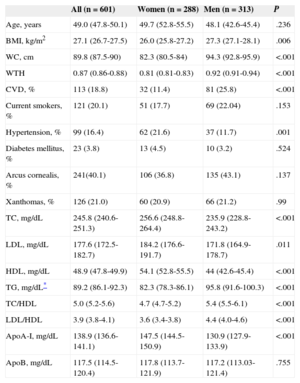
All patients included in the study were heterozygous carriers for mutations in the LDL receptor (LDLR gene).7 The biochemical and clinical characteristics of the FH population are shown in Table 1.
Baseline Characteristics of Studied Familial Hypercholesterolemia Population
| All (n=601) | Women (n=288) | Men (n=313) | P | |
|---|---|---|---|---|
| Age, years | 49.0 (47.8-50.1) | 49.7 (52.8-55.5) | 48.1 (42.6-45.4) | .236 |
| BMI, kg/m2 | 27.1 (26.7-27.5) | 26.0 (25.8-27.2) | 27.3 (27.1-28.1) | .006 |
| WC, cm | 89.8 (87.5-90) | 82.3 (80.5-84) | 94.3 (92.8-95.9) | <.001 |
| WTH | 0.87 (0.86-0.88) | 0.81 (0.81-0.83) | 0.92 (0.91-0.94) | <.001 |
| CVD, % | 113 (18.8) | 32 (11.4) | 81 (25.8) | <.001 |
| Current smokers, % | 121 (20.1) | 51 (17.7) | 69 (22.04) | .153 |
| Hypertension, % | 99 (16.4) | 62 (21.6) | 37 (11.7) | .001 |
| Diabetes mellitus, % | 23 (3.8) | 13 (4.5) | 10 (3.2) | .524 |
| Arcus cornealis, % | 241(40.1) | 106 (36.8) | 135 (43.1) | .137 |
| Xanthomas, % | 126 (21.0) | 60 (20.9) | 66 (21.2) | .99 |
| TC, mg/dL | 245.8 (240.6-251.3) | 256.6 (248.8-264.4) | 235.9 (228.8-243.2) | <.001 |
| LDL, mg/dL | 177.6 (172.5-182.7) | 184.2 (176.6-191.7) | 171.8 (164.9-178.7) | .011 |
| HDL, mg/dL | 48.9 (47.8-49.9) | 54.1 (52.8-55.5) | 44 (42.6-45.4) | <.001 |
| TG, mg/dL* | 89.2 (86.1-92.3) | 82.3 (78.3-86.1) | 95.8 (91.6-100.3) | <.001 |
| TC/HDL | 5.0 (5.2-5.6) | 4.7 (4.7-5.2) | 5.4 (5.5-6.1) | <.001 |
| LDL/HDL | 3.9 (3.8-4.1) | 3.6 (3.4-3.8) | 4.4 (4.0-4.6) | <.001 |
| ApoA-I, mg/dL | 138.9 (136.6-141.1) | 147.5 (144.5-150.9) | 130.9 (127.9-133.9) | <.001 |
| ApoB, mg/dL | 117.5 (114.5-120.4) | 117.8 (113.7-121.9) | 117.2 (113.03-121.4) | .755 |
ApoA, apolipoprotein A; ApoB, apolipoprotein B; BMI, body mass index; CVD, cardiovascular disease; HDL, high-density lipoprotein; LDL, low-density lipoprotein; TC, total cholesterol; TG, triglycerides; WC, waist circumference; WTH, waist-to-hip ratio.
Data are expressed as mean (95% confidence interval) or No. (%).
Statistical significance was tested by Student t test or Fisher exact test, respectively.
Statistical significance was set at P < .05.
DNA was obtained from whole blood by using the Kit Wizard DNA Purification from Promega. The polymorphism rs11613352 was genotyped using an allele-speficic Taqman® assay on the Applied Biosystems® 7900 Real-Time PCR System. The allelic discrimination of the alleles was done using an ABI PRISM® 7900 as for genotyping.
Statistical AnalysisQuantitative data were expressed as the mean (standard deviation) and categorical data by percentages. Triglyceride values were logarithmically transformed for statistical analysis. Statistical significance was assessed by Student t test for quantitative data and by Fisher exact test or chi-square for categorical data.
Allele frequencies were calculated from the genotypes of the subjects. The genotype distribution in the population was assessed for Hardy-Weinberg equilibrium by chi-square test. Quantitative differences in lipid levels between genotypes were adjusted for age and sex, tested by linear regression, and summarized by means, standard errors, mean differences respect to a reference category, and 95% confidence interval (95%CI) of the differences. Various models of inheritance (general model or codominant, dominant, and recessive) were tested and genetic effects were calculated for each genotype compared to the reference genotype in each model. Statitiscal analysis was done using SPSS 19.0 (SPSS Inc.; Chicago, Illinois, United States) and SNPStats.8P values < .05 were considered significant. The statistical power to detect significant differences among the genotype groups in plasma lipid levels were analyzed by Power Calculator (Quantor v2.1).
RESULTSClinical and Biochemical Characteristics of Studied Familial Hypercholesterolemia PopulationThe baseline characteristics of the FH (48% women, 52% men) population studied is shown in Table 1. The majority of patients (87%) were on lipid-lowering therapy at study inclusion and there were no differences in treatment across genotype groups (data not shown).
Association of rs11613352 With Triglycerides and High-density Lipoproteins LevelsThe observed genotypic frequencies were consistent with Hardy-Weinberg equilibrium, (P=.32). The frequency of C and T alleles was 0.83 and 0.17, respectively in FH. The frequency of CC, CT and TT genotypes was 69%, 27% and 4%, respectively.
There were no differences in genotypes frequencies by sex or antropometric traits such as waist circumference, waist-to-hip ratio, or body mass index, nor with history of CVD, current smoking habit, or lipid levels other than TG and HDL (Student t test, P=.003 and P=.007, respectively). Interestingly, however, no genotype TT was observed in patients with presence of xanthomas (P=.012, Fisher exact test) ().
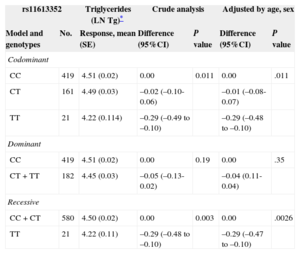
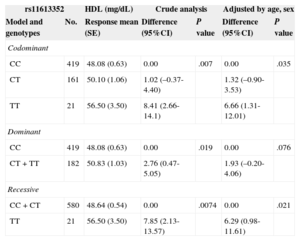
Genotype association with plasma lipid levels was only significant with TG and HDL as previously described3 and is shown in Tables 2 and 3, respectively. The best association is reached with a recessive inheritance model for plasma TG and HDL levels. Crude analysis of genetic association showed a significant association of TT genotype with a decrease in TG levels (P=.003), and an increase in plasma HDL levels (P=.0074). The association remains significant after adjusting by age and sex, P=.0026, mean difference of -0.29 (95%CI=-0.48 to -0.10) for natural logarithm TG values, corresponding to a change of 22mg/dL between genotypes (Table 2) and P=.021, mean difference of 6.29mg/dl (95%CI, 0.98-11.61mg/dL) for HDL (Table 3).
rs11613352 Association With Triglycerides Levels
| rs11613352 | Triglycerides (LN Tg)* | Crude analysis | Adjusted by age, sex | |||
|---|---|---|---|---|---|---|
| Model and genotypes | No. | Response, mean (SE) | Difference (95%CI) | P value | Difference (95%CI) | P value |
| Codominant | ||||||
| CC | 419 | 4.51 (0.02) | 0.00 | 0.011 | 0.00 | .011 |
| CT | 161 | 4.49 (0.03) | –0.02 (–0.10-0.06) | –0.01 (–0.08-0.07) | ||
| TT | 21 | 4.22 (0.114) | –0.29 (–0.49 to –0.10) | –0.29 (–0.48 to –0.10) | ||
| Dominant | ||||||
| CC | 419 | 4.51 (0.02) | 0.00 | 0.19 | 0.00 | .35 |
| CT+TT | 182 | 4.45 (0.03) | –0.05 (–0.13-0.02) | –0.04 (0.11-0.04) | ||
| Recessive | ||||||
| CC+CT | 580 | 4.50 (0.02) | 0.00 | 0.003 | 0.00 | .0026 |
| TT | 21 | 4.22 (0.11) | –0.29 (–0.48 to –0.10) | –0.29 (–0.47 to –0.10) | ||
95%CI, 95% confidence interval; SE, standard error.
rs11613352 Association With High-density Lipoprotein Levels
| rs11613352 | HDL (mg/dL) | Crude analysis | Adjusted by age, sex | |||
|---|---|---|---|---|---|---|
| Model and genotypes | No. | Response mean (SE) | Difference (95%CI) | P value | Difference (95%CI) | P value |
| Codominant | ||||||
| CC | 419 | 48.08 (0.63) | 0.00 | .007 | 0.00 | .035 |
| CT | 161 | 50.10 (1.06) | 1.02 (–0.37-4.40) | 1.32 (–0.90-3.53) | ||
| TT | 21 | 56.50 (3.50) | 8.41 (2.66-14.1) | 6.66 (1.31-12.01) | ||
| Dominant | ||||||
| CC | 419 | 48.08 (0.63) | 0.00 | .019 | 0.00 | .076 |
| CT+TT | 182 | 50.83 (1.03) | 2.76 (0.47-5.05) | 1.93 (–0.20-4.06) | ||
| Recessive | ||||||
| CC+CT | 580 | 48.64 (0.54) | 0.00 | .0074 | 0.00 | .021 |
| TT | 21 | 56.50 (3.50) | 7.85 (2.13-13.57) | 6.29 (0.98-11.61) | ||
95%CI, 95% confidence interval; HDL, high-density lipoproteins; SE, standard error.
Statistical power calculations assumed independence of individuals, minimal allele frequency or 0.17, a recessive genetic effect, a population mean of 4.49 and standard deviation of 0.48 for the natural logarithm of TG, mean HDL value of 48.9mg/dL and standard deviation of 13.2mg/dL, and a type I error of 0.05 (1-sided). With 601 FH subjects, we had 80% power to detect an effect size of –0.3 for TG, which corresponds to an approximate change of 22mg/dL from the mean of the population, and over 70% of power to detect an effect size > 7mg/dL from the mean HDL value.
DISCUSSIONInvestigation of new GWAS candidates and their polymorphisms could help us to understand the phenotypic variability for developing clinical CVD manifestation in FH patients. Additionally, they may be of interesf for future therapeutic use against atherosclerosis.
Elevated LDL, elevated TG, and decreased HDL are important risk factors for coronary artery disease9–11. Not only the quantity of lipoprotein levels, but also the size and quality of lipoprotein particles are involved in atherogenesis. The particle sizes of LDL and HDL are related to plasma levels of TG and the TG/HDL ratio correlates well with the HDL particle size and with coronary artery disease.7 In FH, patients with elevated TG (> 150mg/dL) display more atherogenic HDL particles with reduced anti-inflammatory capacity and a decreased ability to promote cholesterol efflux from macrophages, in comparison with control subjects.12 Thus, genetic variants affecting HDL and TG may be highly relevant for the atherosclerotic process. However, the role of mutations (essentially affecting HDL levels) on CVD has been recently questioned by genetic randomization studies.13
By GWAS, common and rare genetic variants have been found in candidate genes contributing to dislypidemia, although a large portion of variability remains unknown.14,15 The recently discovered GWAS polymorphism, rs11613352, was mainly associated with TG levels3 and also with HDL levels. The present study performed in an FH population shows for the first time that the polymorphism rs11613352 associates with variable TG and HDL levels. The TT genotype associates with the beneficial profile of lower TG and higher HDL.
The potential protective effect of the TT genotype is also emphasized by the total absence of tendon xanthomas in FH patients with TT genotype, and the presence of CVD was about half as prevalent in patients with TT genotype (), although the size of the sample did not result in statistical significance.
Several genes lie in the ±500 Kb region of the TG-suggestive GWAS signal of rs116133523. Among the relevant candidate genes in this region () are the LDL receptor-related protein 1 (LRP1)3, a member of the LDL-receptor family3,6,16; the genes in the intergenic region R3HDM2-INHBC-INHBE (12q1.31-33),4 encoding the poorly characterized protein R3HDM2 (KIAA1002), an R3H domain which has been shown to bind single-stranded nucleic acid17; and INHBC and INHBE genes from the TGF-beta superfamily, which include among their multiple functions their roles in regulation of metabolism, homeostasis, and immune responses; and recently ARHGAP9 have been identified as a candidate gene in adipose tissue.18 As of yet, no functional data exists linking any of the genes in proximity of rs11613352 to lipid levels.
LRP1 is a receptor involved in lipid uptake17,19–21 and it is localized at about 200kb of rs11613352. In a previous study of genetic association with LRP1 variants in FH population,6 we did not observe an association of 10 LRP1 single nucleotide polymorphisms with fasting plasma lipid levels (total cholesterol, LDL, HDL, and TG) in FH (data not shown); neither have we found LD between these LRP1 single nucleotide polymorphisms and the lead TG GWAS single nucleotide polymorphism, rs11613352; thus, we do not think that LRP1 would be the candidate gene involved in modulating TG and HDL plasma levels.
CONCLUSIONSWe found that the polymorphism rs11613352 may contribute to attenuate cardiovascular risk by modifying plasma lipid levels in FH patients, as the TT genotype displays a profile of lower TG and higher HDL. Effects are consistent with previous large-scale GWAS results for lipid levels,3,4 although confirmation is needed through replication in other independent FH populations.
Rs11613352 is located within intron 1 of the poorly known gene R3HDM2 (or KIAAA1002) and near the transcriptionally opposite cluster INHBC-INHBE, a region rich in transcriptional regulatory sites. Additional expression studies are needed to elucidate the gene(s) affected by this genetic variant and its molecular function in modulating plasma lipid levels and risk of CVD.
FUNDINGThis study was supported in part by funding from SAF (Servicio de Actividad Física) —SAF2010-16549—, CNIC (Centro Nacional de Investigaciones Cardiovasculares) —CNIC-08-2008—, RIC (Red de Investigación Cardiovascular)—RD12/0042/0027—y TerCel (Red de Terapia Celular)—RD12/0019/0026—from ISCIII (Instituto de Salud Carlos III), Spain.
CONFLICTS OF INTERESTNone declared.
We thank the Spanish Familial Hypercholesterolemia Foundation for assistance in the recruitment of participants and controls, and to the FH patients for their valuable contribution and willingness to participate. We would like to acknowledge Montse Gómez-Pardo for her technical assistance and the Fundacion de Investigación Cardiovascular-Fundación Jesus Serra for their support for the study.