To analyze the association between sitting time and biomarkers of insulin resistance and inflammation in a sample of healthy male workers.
MethodsCross-sectional study carried out in a sample of 929 volunteers belonging to the Aragon Workers’ Health Study cohort. Sociodemographic, anthropometric, pharmacological and laboratory data were collected: lipids—total cholesterol, high-density lipoprotein cholesterol, low-density lipoprotein cholesterol, triglycerides, apolipoproteins A-1 and B-100, lipoprotein (a)—, insulin resistance—glucose, glycated hemoglobin, homeostasis model assessment of insulin resistance, insulin, and triglyceride/high-density lipoprotein cholesterol ratio—, and inflammatory profile—C-reactive protein and leukocytes. Information on sitting time and physical activity was assessed using a questionnaire. Sedentary behavior was analyzed in terms of prevalences and medians, according to tertiles, using a multivariate model (crude and adjusted linear regression) with biomarkers of inflammation and insulin resistance.
ResultsThe most sedentary individuals had higher body mass index, greater waist circumference, and higher systolic blood pressure, with a significant upward trend in each tertile. Likewise, they had a worse lipid profile with a higher C-reactive protein level, homeostasis model assessment of insulin resistance index, triglyceride/high-density lipoprotein cholesterol ratio, and insulin concentration. In the multivariate analysis, we observed a significant association between the latter parameters and sitting time in hours (log C-reactive protein [β = 0.07], log homeostasis model assessment of insulin resistance index [β = 0.05], triglyceride/high-density lipoprotein cholesterol ratio [β = 0.23], and insulin [β = 0.44]), which remained after adjustment for metabolic equivalents-h/week.
ConclusionsWorkers who spend more time sitting show a worse inflammatory and insulin resistance profile independently of the physical activity performed.
Keywords
Cardiovascular disease is expected to cause 25 million deaths in the entire world in 2020.1 The curbing of the mortality rate associated with this disease in developed countries that has taken place in recent decades is mainly due to the advances in treatment and early diagnosis, rather than to a decrease in the incidence of the disease. This is basically attributable to the fact that most of the modifiable cardiovascular risk factors, such as diabetes mellitus and obesity, far from being less widespread, have increased in prevalence in recent years. Moreover, the developing societies have to face a hostile setting characterized by changes in lifestyle, basically aimed toward an increase in the consumption of foods with a high caloric density, a reduction of physical activity, and an increase in tobacco use.
Despite the health-promoting effects associated with regular physical exercise, physical inactivity not only continues to be a common problem, but is becoming increasingly widespread.2,3 In its 2010 report on the status of noncommunicable diseases, the World Health Organization estimated that 3.2 million people die each year due to the failure to engage in physical activity, which constitutes the fourth most important risk factor leading to death in the entire world (6% of all deaths), surpassed only by hypertension (13%), tobacco use (9%), and high blood glucose levels (6%).4
In recent years, there has been increasing interest in studying the effects of sedentary behavior on the development and progression of cardiovascular disease and its risk factors from a different perspective: not as a continuum that progresses inversely to the physical activity, defined as little or no activity, but as an independent concept; thus, a given person could engage in high levels of physical activity, yet spend a great deal of time occupied in sedentary behavior.5
Despite the fact that there is no standard definition of sedentary lifestyle, sedentary behaviors can be considered those activities performed during waking hours that are carried out in a sitting or reclining position and require low energy expenditure: from 1 to 1.5 times the basal metabolic rate.5–7 This imprecision has led to the analysis and quantification of sedentary behavior from different perspectives: the most common approach is to employ questionnaires to study the time spent with sedentary activities during leisure time, like watching television and playing video games or computer games, or to analyze more specifically the sitting time during working hours. Instruments that enable objective measurements, like accelerometers, are recently being incorporated.8
In this study, we propose to analyze the relationship between the time that adult workers at a large car manufacturer in Aragon, an autonomous community in northeastern Spain, spend sitting throughout the day, both at work and in their leisure time, and the new biomarkers, such as those that indicate insulin resistance and inflammation. These two biomarkers are present from the start in atherosclerosis, a disease with multiple causes that has an inflammatory pathophysiology.
METHODSStudy Design and PopulationThe AWHS (Aragon Workers’ Health Study) is a prospective, longitudinal, epidemiological cohort study based on the data obtained in the annual physical examinations of workers at the automobile assembly plant of General Motors España in Figueruelas, in the province of Zaragoza, in northeastern Spain. The design and methodology have been described previously.9 Each year, one third of the participating workers (aged 40 years to 55 years) are randomly selected to undergo complementary vascular imaging studies and to complete additional questionnaires. The present report describes a cross-sectional study that includes 929 subjects who enrolled in the first year (2011). The study was approved by the Clinical Research Ethics Committee of Aragon and informed consent was obtained from all the participants.
Clinical and Anthropometric VariablesThe clinical, laboratory, and anthropometric data were obtained from the annual physical examinations carried out in the Department of Occupational Risk Management at General Motors España, using procedures that have been standardized, validated, and certified by international standard ISO 9001-2008.
The glucose, triglyceride, high-density lipoprotein cholesterol (HDL-C), and total cholesterol concentrations were determined by enzyme analysis using the ILAB 650 analyzer from Instrumentation Laboratory. Apolipoprotein A-1, apolipoprotein B-100, lipoprotein (a), and C-reactive protein (CRP) were determined by nephelometry using the IMMAGE 800 system from Beckman Coulter. Insulin was determined by means of the Access ultrasensitive chemiluminescence immunoassay from Beckman Coulter. Glycated hemoglobin was determined by cation exchange chromatography on a reverse phase column using the ADAMS A1c HA-810 analyzer from Arkray Factory. Differential leukocyte counts were performed with a Coulter analyzer (CoulterAC•T 5diff AL, Beckman Coulter). In addition, we calculated the HOMA-IR (homeostasis model assessment of insulin resistance) index as a measure of insulin resistance10 and the triglyceride/HDL-C ratio as its clinical expression.11 Low-density lipoprotein cholesterol concentrations were calculated using the Friedewald formula when the triglyceride levels were < 400mg/dL.12
Arterial blood pressure was measured after a 5-min rest period with an OMRON M10-IT digital blood pressure monitor (OMRON Healthcare Co. Ltd., Japan), and we recorded the average of 3 consecutive automatic readings. Weight, height, and waist circumference were also measured and the body mass index was calculated. The participants provided information on their clinical history, reporting their personal and family history with respect to early cardiovascular disease, medication, tobacco use, and diagnosis of hypertension or diabetes mellitus.
Physical Activity and Sedentary BehaviorPhysical activity was assessed using the validated Spanish version13 of the questionnaire on the frequency of engaging in physical activity used in the Nurses’ Health Study and the Health Professionals’ Follow-up Study.14,15 The participants were asked about the average time they had devoted to 17 different sports activities over the year prior to the day of the interview. The questionnaire has 10 categories ranging from “never” to “more than 11h a week”. Moreover, the volunteers were also queried about the number of months of the year that they had engaged in each of the different activities.
To calculate the total physical activity of each volunteer, MET (metabolic equivalents) were assigned to all the activities,16 the values were multiplied by the number of hours a week that the participant claimed to have devoted to said activity, and the total MET-h/week was computed by adding up the MET-h for the different activities.
The questionnaire also included a series of questions on habits and lifestyle, such as hours spent watching television or videos and hours spent at the computer, hours of sleep, and sitting time in hours, differentiating between typical working days and typical weekend days.
To estimate the time devoted to a sedentary lifestyle, we utilized the variable “sitting time”, which corresponded to the hours or fraction of an hour (if the time was < 1 h) that the worker reported that he spent sitting each day, during both the working day and leisure time, differentiating between weekdays and weekend days. The weighted mean was then calculated on the basis of the hours that the participant remained seated on working days and on the weekend.
Dietary AssessmentTo evaluate the dietary intake, we used a semiquantitative food frequency questionnaire that had previously been validated in Spain.17 In this questionnaire, each participant provided information on the foods consumed over the year prior to the day of the interview. Seasonal variations and the differences between the patterns of consumption on working days and on the weekend were taken into account.
Sociodemographic VariablesThe participants also completed an additional questionnaire on their sociodemographic characteristics that included: date of birth, level of education, number of years working in the company, shift and type of work carried out, marital status, number of children, and number of persons in the family unit.
Definition of Cardiovascular Risk FactorsThe criteria for defining the different cardiovascular risk factors are based on the European clinical practice guidelines. Hypertension was defined as arterial blood pressure levels > 140/90 mmHg (130/80mmHg in participants with diabetes mellitus) or current antihypertensive therapy.18 Hypercholesterolemia was defined as total cholesterol concentrations > 190mg/dL or current lipid-lowering therapy.18 We also considered a volunteer to be diabetic if he had at least one of the following characteristics: fasting glucose level ≥ 126 mg/dL or glycated hemoglobin ≥ 6.5% in at least one analysis, a diagnosis of diabetes mellitus in a previous medical record, or was taking antidiabetic medication.19
Statistical AnalysisThe major variables are expressed as the median [interquartile range] in the case of continuous variables, and frequency distribution was used to describe the prevalence of cardiovascular risk factors. The between-group differences in sedentary behavior were analyzed using the Kruskal-Wallis nonparametric H statistic or the chi-square test, and the trend across tertiles of sitting time were studied by means of either the Cuzick test or the Cochrane-Armitage test, as appropriate. We had previously tested for the normal distribution of the data using the Shapiro-Wilk test and, in the case of the variables CRP and HOMA-IR, we applied logarithmic transformation to normalize the data and analyze them as dependent variables.
We performed multivariate linear regression analysis, introducing as dependent variable the insulin resistance parameters triglyceride/HDL-C ratio, insulin, and HOMA-IR, and the inflammatory parameters CRP and leukocyte concentrations. The independent variable was the sitting time reported by the worker in the form of a continuous variable. We present a crude model and another two models adjusted for possible confounding factors identified in earlier studies or because of their biological relationship with the outcome variable, regardless of whether or not there was a correlation in the bivariate analysis. Model A is adjusted for age, body mass index category (normal weight, overweight, and obesity), tobacco use (smoker, ex-smoker, and nonsmoker), alcohol consumption (g/day), diagnosis of diabetes mellitus (yes/no), antihypertensive therapy (yes/no), and lipid-lowering therapy (yes/no). The energy consumption (kcal/day) was not included in the model because of its strong relationship to body mass index. Model B is adjusted for all the variables mentioned for model A plus MET-h/week. The results with these models are expressed as adjusted coefficient and 95% confidence interval.
The statistical analysis was carried out using STATA 12.0 and SPSS 16.0. All of the tests were two-tailed and the significance level was 5%.
RESULTSThe final sample consisted of 861 workers. We excluded those with a CRP level ≥ 3mg/dL and/or an erythrocyte sedimentation rate ≥ 20 mm (during the first hour).
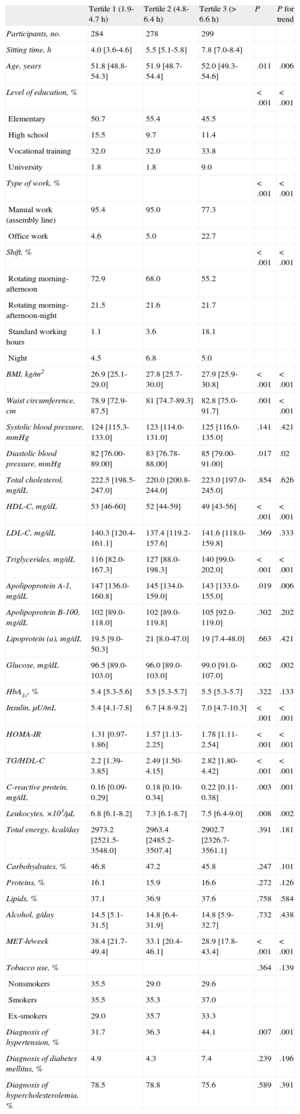
The description of the main variables is provided in Table 1; the participants were classified into 3 groups according to the tertile of sitting time. Tertile 1 included those workers who remained seated from 1.9h/day to 4.7h/day; the tertile 2, from 4.8h/day to 6.4h/day; and the tertile 3, more than 6.6h/day.
Characteristics of the Participants by Tertiles of Sitting Time
| Tertile 1 (1.9-4.7 h) | Tertile 2 (4.8-6.4 h) | Tertile 3 (> 6.6 h) | P | P for trend | |
| Participants, no. | 284 | 278 | 299 | ||
| Sitting time, h | 4.0 [3.6-4.6] | 5.5 [5.1-5.8] | 7.8 [7.0-8.4] | ||
| Age, years | 51.8 [48.8-54.3] | 51.9 [48.7-54.4] | 52.0 [49.3-54.6] | .011 | .006 |
| Level of education, % | < .001 | < .001 | |||
| Elementary | 50.7 | 55.4 | 45.5 | ||
| High school | 15.5 | 9.7 | 11.4 | ||
| Vocational training | 32.0 | 32.0 | 33.8 | ||
| University | 1.8 | 1.8 | 9.0 | ||
| Type of work, % | < .001 | < .001 | |||
| Manual work (assembly line) | 95.4 | 95.0 | 77.3 | ||
| Office work | 4.6 | 5.0 | 22.7 | ||
| Shift, % | < .001 | < .001 | |||
| Rotating morning-afternoon | 72.9 | 68.0 | 55.2 | ||
| Rotating morning-afternoon-night | 21.5 | 21.6 | 21.7 | ||
| Standard working hours | 1.1 | 3.6 | 18.1 | ||
| Night | 4.5 | 6.8 | 5.0 | ||
| BMI, kg/m2 | 26.9 [25.1-29.0] | 27.8 [25.7-30.0] | 27.9 [25.9-30.8] | < .001 | < .001 |
| Waist circumference, cm | 78.9 [72.9-87.5] | 81 [74.7-89.3] | 82.8 [75.0-91.7] | .001 | < .001 |
| Systolic blood pressure, mmHg | 124 [115.3-133.0] | 123 [114.0-131.0] | 125 [116.0-135.0] | .141 | .421 |
| Diastolic blood pressure, mmHg | 82 [76.00-89.00] | 83 [76.78-88.00] | 85 [79.00-91.00] | .017 | .02 |
| Total cholesterol, mg/dL | 222.5 [198.5-247.0] | 220.0 [200.8-244.0] | 223.0 [197.0-245.0] | .854 | .626 |
| HDL-C, mg/dL | 53 [46-60] | 52 [44-59] | 49 [43-56] | < .001 | < .001 |
| LDL-C, mg/dL | 140.3 [120.4-161.1] | 137.4 [119.2-157.6] | 141.6 [118.0-159.8] | .369 | .333 |
| Triglycerides, mg/dL | 116 [82.0-167.3] | 127 [88.0-198.3] | 140 [99.0-202.0] | < .001 | < .001 |
| Apolipoprotein A-1, mg/dL | 147 [136.0-160.8] | 145 [134.0-159.0] | 143 [133.0-155.0] | .019 | .006 |
| Apolipoprotein B-100, mg/dL | 102 [89.0-118.0] | 102 [89.0-119.8] | 105 [92.0-119.0] | .302 | .202 |
| Lipoprotein (a), mg/dL | 19.5 [9.0-50.3] | 21 [8.0-47.0] | 19 [7.4-48.0] | .663 | .421 |
| Glucose, mg/dL | 96.5 [89.0-103.0] | 96.0 [89.0-103.0] | 99.0 [91.0-107.0] | .002 | .002 |
| HbA1c, % | 5.4 [5.3-5.6] | 5.5 [5.3-5.7] | 5.5 [5.3-5.7] | .322 | .133 |
| Insulin, μU/mL | 5.4 [4.1-7.8] | 6.7 [4.8-9.2] | 7.0 [4.7-10.3] | < .001 | < .001 |
| HOMA-IR | 1.31 [0.97-1.86] | 1.57 [1.13-2.25] | 1.78 [1.11-2.54] | < .001 | < .001 |
| TG/HDL-C | 2.2 [1.39-3.85] | 2.49 [1.50-4.15] | 2.82 [1.80-4.42] | < .001 | < .001 |
| C-reactive protein, mg/dL | 0.16 [0.09-0.29] | 0.18 [0.10-0.34] | 0.22 [0.11-0.38] | .003 | .001 |
| Leukocytes, ×103/μL | 6.8 [6.1-8.2] | 7.3 [6.1-8.7] | 7.5 [6.4-9.0] | .008 | .002 |
| Total energy, kcal/day | 2973.2 [2521.5-3548.0] | 2963.4 [2485.2-3507.4] | 2902.7 [2326.7-3561.1] | .391 | .181 |
| Carbohydrates, % | 46.8 | 47.2 | 45.8 | .247 | .101 |
| Proteins, % | 16.1 | 15.9 | 16.6 | .272 | .126 |
| Lipids, % | 37.1 | 36.9 | 37.6 | .758 | .584 |
| Alcohol, g/day | 14.5 [5.1-31.5] | 14.8 [6.4-31.9] | 14.8 [5.9-32.7] | .732 | .438 |
| MET-h/week | 38.4 [21.7-49.4] | 33.1 [20.4-46.1] | 28.9 [17.8-43.4] | < .001 | < .001 |
| Tobacco use, % | .364 | .139 | |||
| Nonsmokers | 35.5 | 29.0 | 29.6 | ||
| Smokers | 35.5 | 35.3 | 37.0 | ||
| Ex-smokers | 29.0 | 35.7 | 33.3 | ||
| Diagnosis of hypertension, % | 31.7 | 36.3 | 44.1 | .007 | .001 |
| Diagnosis of diabetes mellitus, % | 4.9 | 4.3 | 7.4 | .239 | .196 |
| Diagnosis of hypercholesterolemia, % | 78.5 | 78.8 | 75.6 | .589 | .391 |
BMI, body mass index; HDL-C, high-density lipoprotein cholesterol; HbA1c, glycated hemoglobin; HOMA-IR, homeostasis model assessment of insulin resistance index; LDL-C, low-density lipoprotein cholesterol; MET, metabolic equivalents; TG, triglycerides.
Unless otherwise indicated, the values are expressed as median [interquartile range].
In the most sedentary group (tertile 3), the participants were older and there was a greater prevalence of workers who had attended college and held administrative positions. The least sedentary participants (tertile 1) were associated with lower body mass index (tertiles 1 to 3, 26.9, 27.8, and 27.9, respectively; P < .001) and waist circumference (78.9cm, 81.0cm, and 82.8cm, respectively; P = .001. In addition, their diastolic blood pressure was lower (82mmHg, 83mmHg, and 85mmHg, respectively; P = .017); there were no differences in the systolic blood pressure.
Dietary HabitsNo significant differences were observed between the tertiles of sedentary behavior with respect to the consumption pattern, macronutrient distribution, or total caloric intake, which ranged from 2973kcal in the tertile 1 to 2902kcal in the tertile 3 (P = .391).
Lipid ProfileThe most sedentary participants had the worst lipid profile, with lower levels of HDL-C (P < .001) and apolipoprotein A-1 (P = .019), and higher triglyceride levels (P < .001), specifically, 49mg/dL, 143mg/dL, and 140mg/dL, respectively, compared to 53mg/dL, 147mg/dL, and 116mg/dL, respectively, in the least sedentary group. However, we observed no significant differences in the total cholesterol, apolipoprotein B-100, or lipoprotein (a) levels.
Insulin Resistance and Inflammatory ParametersWith the exception of glycated hemoglobin, which was similar in the different tertiles of sitting time, the remaining parameters studied differed from one group to another, showing an upward trend from the lowest tertile to the most sedentary group in glucose level (96.5mg/dL, 96.0mg/dL, and 99.0mg/dL, respectively; P = .002), HOMA-IR (1.31mg/dL, 1.57mg/dL, and 1.78mg/dL, respectively; P < .001), insulin (5.4 U/mL, 6.7 U/mL, and 7.0 U/mL, respectively; P < .001), triglyceride/HDL-C ratio (2.2, 2.5, and 2.8, respectively; P < .001), leukocytes (6.8 × 10³/μL, 7.3 × 10³/μL, and 7.5 × 10³/μL, respectively; P = .008), and CRP (0.16mg/dL, 0.18mg/dL, and 0.22mg/dL, respectively; P = .003).
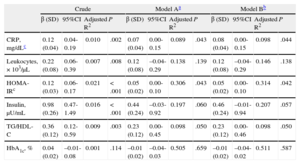
Table 2 shows the results of the multivariate linear regression model. The first model represents the crude risk and models A and B present the risk adjusted for possible confounding variables. There was a significant association between sitting time and all the parameters studied with the exception of glycated hemoglobin. After adjustment for the confounding variables described in the “Methods” section, the log CRP, log HOMA-IR and triglyceride/HDL-C ratio continued to be significantly associated with the sitting time (adjusted coefficients, β = 0.07, β = 0.05, β = 0.23, and β = 0.44). There was no variation in the standardized regression coefficient after adjustment for the physical activity performed.
Crude and Adjusted Linear Regression Analysis Between Sitting Time (Tertiles) and Biomarkers of Inflammation and Insulin Resistance
| Crude | Model Aa | Model Bb | ||||||||||
| β (SD) | 95%CI | Adjusted R2 | P | β (SD) | 95%CI | Adjusted R2 | P | β (SD) | 95%CI | Adjusted R2 | P | |
| CRP, mg/dLc | 0.12 (0.04) | 0.04-0.19 | 0.010 | .002 | 0.07 (0.04) | 0.00-0.15 | 0.089 | .043 | 0.08 (0.04) | 0.00-0.15 | 0.098 | .044 |
| Leukocytes, × 103/μL | 0.22 (0.08) | 0.06-0.39 | 0.007 | .008 | 0.12 (0.08) | –0.04-0.29 | 0.138 | .139 | 0.12 (0.08) | –0.04-0.29 | 0.146 | .138 |
| HOMA-IRc | 0.12 (0.03) | 0.06-0.17 | 0.021 | < .001 | 0.05 (0.02) | 0.00-0.10 | 0.306 | .043 | 0.05 (0.02) | 0.00-0.10 | 0.314 | .042 |
| Insulin, μU/mL | 0.98 (0.26) | 0.47-1.49 | 0.016 | < .001 | 0.44 (0.24) | –0.03-0.92 | 0.197 | .060 | 0.46 (0.24) | –0.01-0.94 | 0.207 | .057 |
| TG/HDL-C | 0.36 (0.12) | 0.12-0.59 | 0.009 | .003 | 0.23 (0.12) | 0.00-0.45 | 0.098 | .050 | 0.23 (0.12) | 0.00-0.46 | 0.098 | .050 |
| HbA1c, % | 0.04 (0.02) | –0.01-0.08 | 0.001 | .114 | –0.01 (0.02) | –0.04-0.03 | 0.505 | .659 | –0.01 (0.02) | –0.04-0.02 | 0.511 | .587 |
95%CI, 95% confidence interval; CRP, C-reactive protein; HbA1c, glycated hemoglobin; HDL-C, high-density lipoprotein cholesterol; HOMA-IR, homeostasis model assessment of insulin resistance index; SD, standard deviation; TG, triglycerides.
The present report shows that the most sedentary male workers have a worse metabolic profile, with higher levels of biomarkers of insulin resistance and inflammation, independently of their physical activity. Although we have known about the association between physical inactivity and increased cardiovascular risk for years, it has been in the last 5 years when attention has turned to the sitting time as a factor independent of the physical activity performed.
CRP is an inflammatory marker that has been clearly shown to be inversely associated with physical activity20,21; however, controversy exists as to whether it is the physical activity itself that reduces CRP or the weight loss that accompanies it.21,22 The finding in our study of a direct association between the sitting time and markers of insulin resistance and inflammation independently of the intensity of the physical activity performed supports the hypothesis, reflected in other studies, that the proinflammatory state is associated not only with limited physical activity, but with sitting for long periods of time as well. The coefficients resulting from the model are low, a circumstance that is to be expected and is congruent with the findings reported in other similar studies when the purpose is to analyze factors that influence the development of a disease with multiple causes.
Although the pathophysiology of sedentary behavior has yet to be fully clarified, this finding is congruent with recently proposed pathophysiological mechanisms.23–26 Some studies carried out in animals have concluded that the influence of prolonged sitting can lead to a loss of contractile stimulation which, in turn, can produce a dysfunction of the regulation of the enzyme lipoprotein lipase.27 Elevated circulating glucose, triglyceride, and free fatty acid concentrations can generate an excess of free radicals and trigger a cascade of biochemical events leading to inflammation, endothelial dysfunction, hypercoagulability, and an increase in sympathetic activity.28
On the other hand, it has been pointed out that the strong association between unhealthy dietary habits and a sedentary lifestyle may be a confounding factor that affects the results of some studies. There is growing evidence that sedentary behaviors in adolescents are a predictor of obesity and diabetes mellitus in adulthood.23,29 However, in our study, we observed no differences between the number of calories consumed or the percentage of major nutrients and the tertiles of sedentary behavior or tertiles of the physical activity performed. The explanation may possibly be found in the homogeneity of the dietary habits of the sample population.
In Spain, 47% of the population is sedentary (Ministry of Health, Government of Spain, 2006). However, it proves difficult to compare the results of studies on the prevalence of sedentary behavior because of the heterogeneity of the definitions used in published reports. Most of them focus more on the measurement of physical inactivity or on the time devoted to watching television or playing video games, especially in the case of young individuals. We know that Spain has one of the most sedentary populations in Europe, although things have improved in recent years.30
It is necessary to promote physical activity through appropriate programs, but at the same time, it is very complex. We still do not have sufficient evidence as to which interventions produce the best and most cost-efficient results. In this context, the lines of research that have emerged in recent years to investigate the pathophysiology of sedentary behavior may prove to be highly interesting in terms of public health: on the one hand, because of the foreseeable increase in the prevalence of sedentary behaviors in all the developed and developing countries in the coming years and, on the other, because of the impact that the results may have on the recommendations for health promotion measures aimed at reducing the number of hours of uninterrupted sitting, introducing short pauses to achieve muscle activation and a somewhat higher energy expenditure, which apparently could have important beneficial effects from a cardiovascular perspective.31
However, the research on the influence of sedentary behaviors on the development of atherosclerotic disease is relatively recent. Epidemiological studies like the present one, taking into account different adjustment variables, are necessary for the establishment of hypotheses that should subsequently be confirmed using other more controlled prospective designs and with objective measures that take into account not only the length of time we remain seated, but changes in position as well.
In the coming years, this information will enable us to verify and evaluate the clinical significance of the association found in cross-sectional epidemiological studies and the utility of sedentary behavior as a predictive factor for changes in the biomarkers related to the initiation and progression of atherosclerotic disease.
Strengths and LimitationsThis study benefits from a strict general protocol applied to the quality of each of the laboratory and clinical measurement techniques.
The measures of physical activity and sedentary behavior obtained from the questionnaire have their limitations. The former have previously been validated using accelerometers, but the questions relative to sedentary behavior have not. Moreover, we cannot discern whether the sitting time is continuous or intermittent. The instruments dedicated specifically to these measures are unable to clearly differentiate the resting sitting position, they are costly and, for the time being, their use has not become widespread.
This sample is not representative of the general population. Only men have been included and, as all of them are workers, there is a bias since they are healthy, or at least have no known disabling diseases. In the general population, the levels of sedentary behavior and physical inactivity would probably be different. However, there is no reason to believe that the associations described here occur exclusively in the population from which our sample was recruited.
It could be that possible confounding factors were not taken into account or that the measuring instruments employed (questionnaires) are not accurate enough to avoid a residual confounding effect that could affect our results. In any case, the statistical adjustment was performed based on the best information available and, thus, generates the highest level of evidence for this analysis.
CONCLUSIONSThe present report demonstrates that the most sedentary workers among those included in the follow-up of the AWHS have a worse metabolic profile for cardiovascular risk and higher levels of biomarkers of insulin resistance and inflammation than those who spend less time sitting down, independently of the physical activity performed.
CONFLICTS OF INTERESTNone declared.
This study was funded in part by the Spanish Fund for Health Research (Fondo de Investigaciones Sanitarias) FIS PS09/01936 and FIS PI10/00021.