The Cardiovascular Imaging Association of the Spanish Society of Cardiology conducted a survey in 20171 and 20202 to collect data on cardiovascular imaging activity in Spanish hospitals. To ensure longitudinal continuity and add to the cardiovascular imaging registry, it conducted a third survey in June 2021 to collect data for the previous year. Ninety-four hospitals were contacted and 52 (55%) responded; 92% were public hospitals and all of Spain's autonomous communities except the Canary Islands were represented.
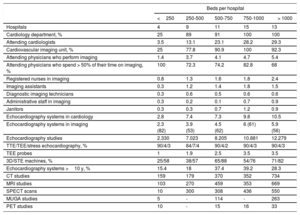
A summary of human and material resources and volume of cardiovascular imaging activity by modality is provided in table 1. In brief, 73% of attending physicians spent more than 50% of their working hours on cardiovascular imaging activities. Sixty-eight percent of the echocardiography systems were less than 10 years old and more than 59% of those in large hospitals (> 500 beds) had advanced analysis capabilities (strain and 3D imaging). In total 48% of echocardiography laboratories kept records of indications, 58% of events, and 60% of internal quality control procedures. Of the physicians who performed echocardiography, 46% were accredited in transthoracic echocardiography, 26% in transesophageal echocardiography, and 7% in transesophageal echocardiography. The studies were performed outside the laboratory in the vast majority of hospitals; 88% of hospitals, for example, performed echocardiograms in outpatient clinics; 55% prepared a semiquantitative/standard report and 52% stored data on a DICOM server. Focused cardiac ultrasounds were performed by other departments in 73% of hospitals. In departments supervised by cardiology, the level of diagnostic agreement was good (84%). In total, 89% of hospitals included a written report on findings in the patients’ medical records.
Human and material resources and volume of activity according to hospital size
| Beds per hospital | |||||
|---|---|---|---|---|---|
| <250 | 250-500 | 500-750 | 750-1000 | > 1000 | |
| Hospitals | 4 | 9 | 11 | 15 | 13 |
| Cardiology department, % | 25 | 89 | 91 | 100 | 100 |
| Attending cardiologists | 3.5 | 13.1 | 23.1 | 28.2 | 29.3 |
| Cardiovascular imaging unit, % | 25 | 77.8 | 90.9 | 100 | 92.3 |
| Attending physicians who perform imaging | 1.4 | 3.7 | 4.1 | 4.7 | 5.4 |
| Attending physicians who spend > 50% of their time on imaging, % | 100 | 72.3 | 74.2 | 82.8 | 68 |
| Registered nurses in imaging | 0.8 | 1.3 | 1.6 | 1.8 | 2.4 |
| Imaging assistants | 0.3 | 1.2 | 1.4 | 1.8 | 1.5 |
| Diagnostic imaging technicians | 0.3 | 0.6 | 0.5 | 0.6 | 0.6 |
| Administrative staff in imaging | 0.3 | 0.2 | 0.1 | 0.7 | 0.9 |
| Janitors | 0.3 | 0.3 | 0.7 | 1.2 | 0.9 |
| Echocardiography systems in cardiology | 2.8 | 7.4 | 7.3 | 9.8 | 10.5 |
| Echocardiography systems in imaging | 2.3 (82) | 3.9 (53) | 4.5 (62) | 6 (61) | 5.9 (56) |
| Echocardiography studies | 2.330 | 7.023 | 8.205 | 10.881 | 12.279 |
| TTE/TEE/stress echocardiography, % | 90/4/3 | 84/7/4 | 90/4/2 | 90/4/3 | 90/4/3 |
| TEE probes | 1 | 1.9 | 2.5 | 3.5 | 3.5 |
| 3D/STE machines, % | 25/58 | 38/57 | 65/88 | 54/76 | 71/82 |
| Echocardiography systems >10 y, % | 15.4 | 18 | 37.4 | 39.2 | 28.3 |
| CT studies | 159 | 179 | 370 | 352 | 734 |
| MRI studies | 103 | 270 | 459 | 353 | 669 |
| SPECT scans | 10 | 300 | 308 | 436 | 550 |
| MUGA studies | 5 | - | 114 | - | 263 |
| PET studies | 10 | - | 15 | 16 | 33 |
3D, 3-dimensional; MUGA, multigated acquisition; PET, positron emission tomography; SPECT, single photon emission computed tomography; STE, speckle-tracking echocardiography; TEE, transesophageal echocardiography; TTE, transthoracic echocardiography.
Unless otherwise indicated, values are expressed as No., No. (%), or median.
Fifty hospitals (96%) performed cardiac computed tomography (CT) and 8 performed more than 500 studies a year. A cardiologist was involved in 60% of cases (mean time spent, 5.4h/wk). All the scanning systems used at least 64 detectors and were on average 4 years old; 78% of hospitals recorded radiation doses but only 46% kept a record of results. Twenty-eight percent of cardiologists who participated in cardiac CT scanning had completed the European accreditation process (available since 2019).
Forty-nine hospitals (94%) offered cardiac magnetic resonance imaging (MRI) and 9 performed than 500 studies a year; cardiologists were involved in 65% of acquisitions (mean time spent, 6.1h/wk). Stress cardiac MRI was available at 17 hospitals (11%), 4 of which performed more than 100 studies a year. Field intensity was 1.5 T in 76% of cases and 3.0 T in 24%; the machines was on average 6 years old. Sixty percent of cardiologists performing cardiac MRI had international accreditation.
Thirty-seven hospitals (71%) performed cardiac nuclear medicine studies, with 5 hospitals performing more than 500 studies a year; a cardiologist was involved in 36% of cases. Overall, 43% of hospitals recorded radiation doses and 27% results. Just 3 of the cardiologists had European accreditation in cardiac nuclear medicine.
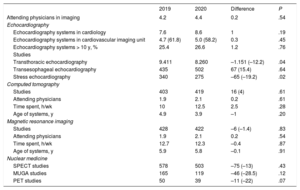
Data from the 50 hospitals that participated in the surveys to collect data for 2019 and 2020 are compared in table 2.
Comparison of cardiovascular imaging activity between II and III Spanish Cardiovascular Imaging Registry Surveys
| 2019 | 2020 | Difference | P | |
|---|---|---|---|---|
| Attending physicians in imaging | 4.2 | 4.4 | 0.2 | .54 |
| Echocardiography | ||||
| Echocardiography systems in cardiology | 7.6 | 8.6 | 1 | .19 |
| Echocardiography systems in cardiovascular imaging unit | 4.7 (61.8) | 5.0 (58.2) | 0.3 | .45 |
| Echocardiography systems > 10 y, % | 25.4 | 26.6 | 1.2 | .76 |
| Studies | ||||
| Transthoracic echocardiography | 9.411 | 8.260 | –1.151 (–12.2) | .04 |
| Transesophageal echocardiography | 435 | 502 | 67 (15.4) | .64 |
| Stress echocardiography | 340 | 275 | –65 (–19.2) | .02 |
| Computed tomography | ||||
| Studies | 403 | 419 | 16 (4) | .61 |
| Attending physicians | 1.9 | 2.1 | 0.2 | .61 |
| Time spent, h/wk | 10 | 12.5 | 2.5 | .28 |
| Age of systems, y | 4.9 | 3.9 | –1 | .20 |
| Magnetic resonance imaging | ||||
| Studies | 428 | 422 | –6 (–1.4) | .83 |
| Attending physicians | 1.9 | 2.1 | 0.2 | .54 |
| Time spent, h/wk | 12.7 | 12.3 | –0.4 | .87 |
| Age of systems, y | 5.9 | 5.8 | –0.1 | .91 |
| Nuclear medicine | ||||
| SPECT studies | 578 | 503 | –75 (–13) | .43 |
| MUGA studies | 165 | 119 | –46 (–28.5) | .12 |
| PET studies | 50 | 39 | –11 (–22) | .07 |
MRI, magnetic resonance imaging; MUGA, multigated acquisition; PET, positron emission tomography; SPECT, single photon emission computed tomography.
Unless otherwise indicated, values are expressed as No. or No. (%).
Comparison between 50 hospitals that participated in both surveys (7.7% had <250 beds, 17.3% had 250-500 beds, 21.2% had 500-750 beds, 28.8% had 750-1000 beds, and 25% had >1000 beds).
In relation to the impact of coronavirus disease 2019 (COVID-19) on activity in 2020, 60% of hospitals had at least 1 cardiovascular imaging staff member infected by severe acute respiratory syndrome coronavirus 2 during the first wave of the pandemic. The respective percentages for the second and third waves were 38% and 37%. During the initial phases of the pandemic, 25% of hospitals experienced a shortage of surgical masks (25%), 63% of filtering face piece 2 (FFP2) masks, and 52% of personal protective equipment (PPE). Eighty-three percent cut their activity by at least 50% and restricted tests involving a high risk of infection to emergency situations. In subsequent waves of the pandemic, 71% of hospitals did not implement measures to reduce activity and 60% applied extraordinary measures to catch up with backlogs (61% increased working hours/volume of activity and 29% modified indications). Just over half of the hospitals (52%) recovered prepandemic response times. Most echocardiographic studies of patients with COVID-19 were performed by cardiovascular imaging staff (63% studied unstable patients and 87% studied unstable patients). The most common indications were clinical instability, clinical suspicion of myocarditis, thromboembolism, infective endocarditis, and elevated myocardial injury markers in blood tests. Use of cardiac CT scanning as an alternative to transesophageal echocardiography, stress echocardiography, and invasive coronary angiography increased in 20% of hospitals. Seventeen hospitals performed cardiac MRI in patients with COVID-19; the indications were acute infection in 46% of cases and follow-up of persistent symptoms in 54%. At the time of the survey, 73% of hospitals continued to use FFP2 masks and PPE and required polymerase chain reaction tests before transesophageal and stress echocardiograms.
Registries are essential tools for standardizing and reducing variability in health care. The current findings complement other initiatives such as the RECALCAR (Resources and Quality in Cardiology Units) project.3 The results of the third edition of the Spanish Cardiovascular Imaging survey reflect the impact of the COVID-19 pandemic and in particular show a reduction in echocardiography and nuclear medicine practice. They also highlight the continuing trend for echocardiographic studies to be performed outside cardiovascular imaging units and for focus cardiac ultrasound examination to be performed by noncardiologists. Improvements continued to be noted in a number of areas, notably the performance of echocardiography studies outside cardiovascular imaging units, increasing accreditation rates for certain techniques, and a growing use of advanced imaging techniques with low annual volumes in most hospitals.
FundingNone
Authors’ ContributionsDesign: M. Barreiro-Pérez, L. J. Jiménez-Borreguero, A. Martínez-Monzonis. Data collection and analysis and preparation of draft manuscript: M. Barreiro-Pérez. All the authors critically reviewed the manuscript.
Conflicts of InterestNone declared.


