We present the data corresponding to implantable cardioverter-defibrillator (ICD) implants in Spain in 2019.
MethodsThe data were drawn from implant centers voluntarily completing a data collection sheet.
ResultsIn 2019, 7003 implant sheets were received compared with the 7389 reported by Eucomed (European Confederation of Medical Suppliers Associations), indicating that data were collected from 94.8% of the devices implanted in Spain. Completion of the implant sheet ranged from 99.7% in the field “name of the implanting hospital” to 17.8% in the variable “reference hospital”. In 2019, 172 hospitals performed ICD implants and participated in the registry, a figure similar to that of 2018 (173). The total rate of registered implants was 149/million inhabitants; the rate reported by Eucomed was 157. Although this value represents the highest in the historical series, it is still much lower than the average rate of ICD implants in Europe (303).
ConclusionsThe Spanish Implantable Cardioverter-Defibrillator Registry for 2019 reflects a growth in the number of ICD implants and is the year with the highest number of ICD implants in Spain. However, similar to previous years, the total number of implants in Spain is still much lower than the European Union average, with substantial differences between Spanish autonomous communities.
Keywords
Implantable cardioverter-defibrillators (ICDs) are the main therapeutic tool for the prevention of sudden cardiac death and their implantation is associated with reduced mortality in patients with heart failure and left ventricular systolic dysfunction.1,2 By continually monitoring cardiac rhythm, ICDs are able to effectively identify and treat ventricular tachycardias meeting specific heart rate and duration criteria. Various clinical practice guidelines list the indications for ICD therapy in patients with ventricular arrhythmias or at risk of developing them and include both primary and secondary prevention measures for sudden cardiac death.1–3 Sudden cardiac death has a huge socioeconomic impact. Although its current incidence in Spain is unknown, the incidence in Europe is 400 000 deaths per year, with 40% occurring in people younger than 65 years.4
The Heart Rhythm Association of the Spanish Society of Cardiology (SEC) has published the Spanish Implantable Cardioverter-defibrillator Registry since 2005.5–8 This document presents the data on ICD implantation in Spain reported to the Spanish Implantable Cardioverter-defibrillator Registry in 2019. Most Spanish centers implanting ICDs have contributed to the registry. Similar to previous annual reports, we review patients’ indications and clinical characteristics, implantation data, device type and programming, and intraprocedural complications.
METHODSThe registry is based on information voluntarily collected by the participating centers during device implantation and concerns both first implantations and replacements. The information was entered in a database by a team comprising a technician, an SEC computer scientist, and a member of the Heart Rhythm Association of the SEC. Data cleaning was performed by the technician and the first author, and all authors of this article analyzed the data and are responsible for this publication. For the first time, data have been collected via an online platform designed by the SEC.9 This website was used to provide information on 1075 implantations, which represent 15.4% of the total.
The census data for the calculations of rates per million population, both national and by autonomous community and province, were obtained from the data of the Spanish National Institute of Statistics as of January 1, 2020.10 As in previous years, the data from the present registry were compared with those provided by the European Confederation of Medical Suppliers Associations (Eucomed).
The percentages of each of the variables analyzed were calculated by taking into account the total number of implantations with available information on the parameter. Only the most serious condition was included if various types of arrhythmias were recorded.
Statistical analysisResults are expressed as mean ± standard deviation or median [interquartile range], depending on the distribution of the variable. Continuous quantitative variables were analyzed using analysis of variance or the Kruskal-Wallis test, whereas qualitative variables were analyzed using the chi-square test. Linear regression models were used to analyze the number of implantations and devices implanted per million population, the total number of implantations, and the number of implantations for primary prevention in each center.
RESULTSA total of 7003 implantation forms were received but 7389 procedures were reported by Eucomed; hence, data were collected on 94.8% of devices implanted in Spain. Completion ranged from 99.7% for the field name of implantation hospital to 17.8% for referral hospital.
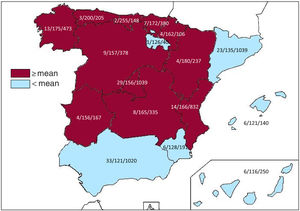
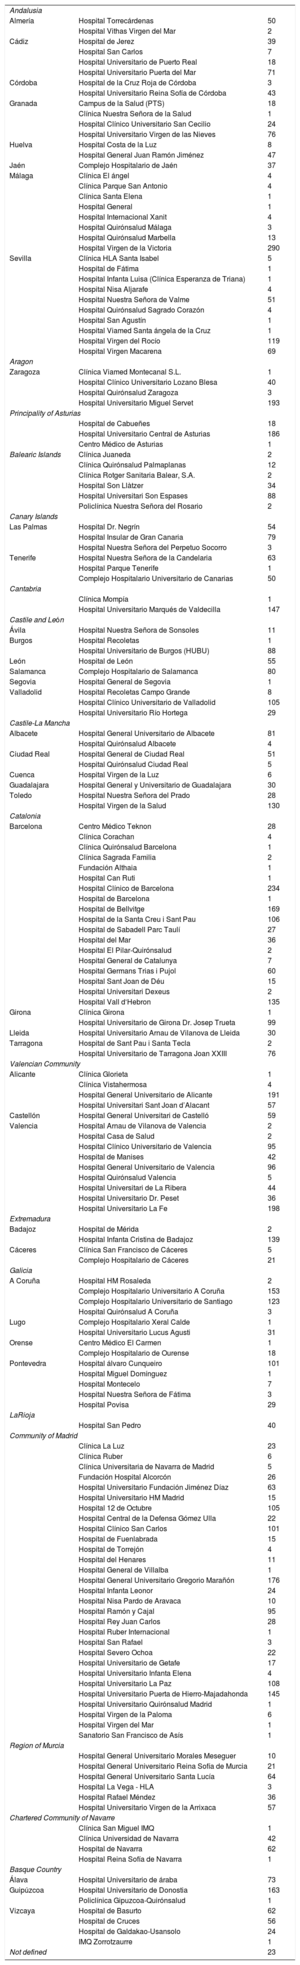
Implantation centersIn 2019, 172 hospitals performing ICD implantation participated in the registry. This figure is similar to that of 2018 (173) but slightly lower than that of 2017 (181, the highest number recorded since registry formation). Data from the 172 hospitals are shown in table 1; 106 were publicly-funded health centers. Figure 1 shows the total number of implantation centers, the rate per million population, and the total number of implantations by autonomous community according to the data sent to the registry. In 2019, 23 centers implanted ≥ 100 devices, 74 implanted between 11 and 99 devices, 76 ≤ 10, and 31 only 1.
Implantations by autonomous community, province, and hospital
| Andalusia | ||
| Almería | Hospital Torrecárdenas | 50 |
| Hospital Vithas Virgen del Mar | 2 | |
| Cádiz | Hospital de Jerez | 39 |
| Hospital San Carlos | 7 | |
| Hospital Universitario de Puerto Real | 18 | |
| Hospital Universitario Puerta del Mar | 71 | |
| Córdoba | Hospital de la Cruz Roja de Córdoba | 3 |
| Hospital Universitario Reina Sofía de Córdoba | 43 | |
| Granada | Campus de la Salud (PTS) | 18 |
| Clínica Nuestra Señora de la Salud | 1 | |
| Hospital Clínico Universitario San Cecilio | 24 | |
| Hospital Universitario Virgen de las Nieves | 76 | |
| Huelva | Hospital Costa de la Luz | 8 |
| Hospital General Juan Ramón Jiménez | 47 | |
| Jaén | Complejo Hospitalario de Jaén | 37 |
| Málaga | Clínica El ángel | 4 |
| Clínica Parque San Antonio | 4 | |
| Clínica Santa Elena | 1 | |
| Hospital General | 1 | |
| Hospital Internacional Xanit | 4 | |
| Hospital Quirónsalud Málaga | 3 | |
| Hospital Quirónsalud Marbella | 13 | |
| Hospital Virgen de la Victoria | 290 | |
| Sevilla | Clínica HLA Santa Isabel | 5 |
| Hospital de Fátima | 1 | |
| Hospital Infanta Luisa (Clínica Esperanza de Triana) | 1 | |
| Hospital Nisa Aljarafe | 4 | |
| Hospital Nuestra Señora de Valme | 51 | |
| Hospital Quirónsalud Sagrado Corazón | 4 | |
| Hospital San Agustín | 1 | |
| Hospital Viamed Santa ángela de la Cruz | 1 | |
| Hospital Virgen del Rocío | 119 | |
| Hospital Virgen Macarena | 69 | |
| Aragon | ||
| Zaragoza | Clínica Viamed Montecanal S.L. | 1 |
| Hospital Clínico Universitario Lozano Blesa | 40 | |
| Hospital Quirónsalud Zaragoza | 3 | |
| Hospital Universitario Miguel Servet | 193 | |
| Principality of Asturias | ||
| Hospital de Cabueñes | 18 | |
| Hospital Universitario Central de Asturias | 186 | |
| Centro Médico de Asturias | 1 | |
| Balearic Islands | Clínica Juaneda | 2 |
| Clínica Quirónsalud Palmaplanas | 12 | |
| Clínica Rotger Sanitaria Balear, S.A. | 2 | |
| Hospital Son Llàtzer | 34 | |
| Hospital Universitari Son Espases | 88 | |
| Policlínica Nuestra Señora del Rosario | 2 | |
| Canary Islands | ||
| Las Palmas | Hospital Dr. Negrín | 54 |
| Hospital Insular de Gran Canaria | 79 | |
| Hospital Nuestra Señora del Perpetuo Socorro | 3 | |
| Tenerife | Hospital Nuestra Señora de la Candelaria | 63 |
| Hospital Parque Tenerife | 1 | |
| Complejo Hospitalario Universitario de Canarias | 50 | |
| Cantabria | ||
| Clínica Mompía | 1 | |
| Hospital Universitario Marqués de Valdecilla | 147 | |
| Castile and León | ||
| Ávila | Hospital Nuestra Señora de Sonsoles | 11 |
| Burgos | Hospital Recoletas | 1 |
| Hospital Universitario de Burgos (HUBU) | 88 | |
| León | Hospital de León | 55 |
| Salamanca | Complejo Hospitalario de Salamanca | 80 |
| Segovia | Hospital General de Segovia | 1 |
| Valladolid | Hospital Recoletas Campo Grande | 8 |
| Hospital Clínico Universitario de Valladolid | 105 | |
| Hospital Universitario Río Hortega | 29 | |
| Castile-La Mancha | ||
| Albacete | Hospital General Universitario de Albacete | 81 |
| Hospital Quirónsalud Albacete | 4 | |
| Ciudad Real | Hospital General de Ciudad Real | 51 |
| Hospital Quirónsalud Ciudad Real | 5 | |
| Cuenca | Hospital Virgen de la Luz | 6 |
| Guadalajara | Hospital General y Universitario de Guadalajara | 30 |
| Toledo | Hospital Nuestra Señora del Prado | 28 |
| Hospital Virgen de la Salud | 130 | |
| Catalonia | ||
| Barcelona | Centro Médico Teknon | 28 |
| Clínica Corachan | 4 | |
| Clínica Quirónsalud Barcelona | 1 | |
| Clínica Sagrada Familia | 2 | |
| Fundación Althaia | 1 | |
| Hospital Can Ruti | 1 | |
| Hospital Clínico de Barcelona | 234 | |
| Hospital de Barcelona | 1 | |
| Hospital de Bellvitge | 169 | |
| Hospital de la Santa Creu i Sant Pau | 106 | |
| Hospital de Sabadell Parc Taulí | 27 | |
| Hospital del Mar | 36 | |
| Hospital El Pilar-Quirónsalud | 2 | |
| Hospital General de Catalunya | 7 | |
| Hospital Germans Trias i Pujol | 60 | |
| Hospital Sant Joan de Déu | 15 | |
| Hospital Universitari Dexeus | 2 | |
| Hospital Vall d‘Hebron | 135 | |
| Girona | Clínica Girona | 1 |
| Hospital Universitario de Girona Dr. Josep Trueta | 99 | |
| Lleida | Hospital Universitario Arnau de Vilanova de Lleida | 30 |
| Tarragona | Hospital de Sant Pau i Santa Tecla | 2 |
| Hospital Universitario de Tarragona Joan XXIII | 76 | |
| Valencian Community | ||
| Alicante | Clínica Glorieta | 1 |
| Clínica Vistahermosa | 4 | |
| Hospital General Universitario de Alicante | 191 | |
| Hospital Universitari Sant Joan d’Alacant | 57 | |
| Castellón | Hospital General Universitari de Castelló | 59 |
| Valencia | Hospital Arnau de Vilanova de Valencia | 2 |
| Hospital Casa de Salud | 2 | |
| Hospital Clínico Universitario de Valencia | 95 | |
| Hospital de Manises | 42 | |
| Hospital General Universitario de Valencia | 96 | |
| Hospital Quirónsalud Valencia | 5 | |
| Hospital Universitari de La Ribera | 44 | |
| Hospital Universitario Dr. Peset | 36 | |
| Hospital Universitario La Fe | 198 | |
| Extremadura | ||
| Badajoz | Hospital de Mérida | 2 |
| Hospital Infanta Cristina de Badajoz | 139 | |
| Cáceres | Clínica San Francisco de Cáceres | 5 |
| Complejo Hospitalario de Cáceres | 21 | |
| Galicia | ||
| A Coruña | Hospital HM Rosaleda | 2 |
| Complejo Hospitalario Universitario A Coruña | 153 | |
| Complejo Hospitalario Universitario de Santiago | 123 | |
| Hospital Quirónsalud A Coruña | 3 | |
| Lugo | Complejo Hospitalario Xeral Calde | 1 |
| Hospital Universitario Lucus Agusti | 31 | |
| Orense | Centro Médico El Carmen | 1 |
| Complejo Hospitalario de Ourense | 18 | |
| Pontevedra | Hospital álvaro Cunqueiro | 101 |
| Hospital Miguel Domínguez | 1 | |
| Hospital Montecelo | 7 | |
| Hospital Nuestra Señora de Fátima | 3 | |
| Hospital Povisa | 29 | |
| LaRioja | ||
| Hospital San Pedro | 40 | |
| Community of Madrid | ||
| Clínica La Luz | 23 | |
| Clínica Ruber | 6 | |
| Clínica Universitaria de Navarra de Madrid | 5 | |
| Fundación Hospital Alcorcón | 26 | |
| Hospital Universitario Fundación Jiménez Díaz | 63 | |
| Hospital Universitario HM Madrid | 15 | |
| Hospital 12 de Octubre | 105 | |
| Hospital Central de la Defensa Gómez Ulla | 22 | |
| Hospital Clínico San Carlos | 101 | |
| Hospital de Fuenlabrada | 15 | |
| Hospital de Torrejón | 4 | |
| Hospital del Henares | 11 | |
| Hospital General de Villalba | 1 | |
| Hospital General Universitario Gregorio Marañón | 176 | |
| Hospital Infanta Leonor | 24 | |
| Hospital Nisa Pardo de Aravaca | 10 | |
| Hospital Ramón y Cajal | 95 | |
| Hospital Rey Juan Carlos | 28 | |
| Hospital Ruber Internacional | 1 | |
| Hospital San Rafael | 3 | |
| Hospital Severo Ochoa | 22 | |
| Hospital Universitario de Getafe | 17 | |
| Hospital Universitario Infanta Elena | 4 | |
| Hospital Universitario La Paz | 108 | |
| Hospital Universitario Puerta de Hierro-Majadahonda | 145 | |
| Hospital Universitario Quirónsalud Madrid | 1 | |
| Hospital Virgen de la Paloma | 6 | |
| Hospital Virgen del Mar | 1 | |
| Sanatorio San Francisco de Asís | 1 | |
| Region of Murcia | ||
| Hospital General Universitario Morales Meseguer | 10 | |
| Hospital General Universitario Reina Sofía de Murcia | 21 | |
| Hospital General Universitario Santa Lucía | 64 | |
| Hospital La Vega - HLA | 3 | |
| Hospital Rafael Méndez | 36 | |
| Hospital Universitario Virgen de la Arrixaca | 57 | |
| Chartered Community of Navarre | ||
| Clínica San Miguel IMQ | 1 | |
| Clínica Universidad de Navarra | 42 | |
| Hospital de Navarra | 62 | |
| Hospital Reina Sofía de Navarra | 1 | |
| Basque Country | ||
| Álava | Hospital Universitario de áraba | 73 |
| Guipúzcoa | Hospital Universitario de Donostia | 163 |
| Policlínica Gipuzcoa-Quirónsalud | 1 | |
| Vizcaya | Hospital de Basurto | 62 |
| Hospital de Cruces | 56 | |
| Hospital de Galdakao-Usansolo | 24 | |
| IMQ Zorrotzaurre | 1 | |
| Not defined | 23 | |

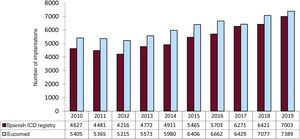
In 2019, the total number of implantations (first and replacements) was 7003, representing an increase vs 2018 (6421). The total number of implantations reported to the registry and those estimated by Eucomed in the last 10 years are shown in figure 2. Accordingly, the data for 2019 show the highest number of ICD implantations in Spain in registry history (7389 in 2019, 7077 in 2018, and 6429 in 2017 according to Eucomed data).

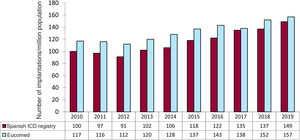
The overall implantation rate was 149/million population for the registry but 157/million population according to Eucomed data. This figure is higher than that of the previous year (137 implantations/million population in 2018) but much lower than the mean ICD implantation rate in Europe (303 implantations/million population in 2019). Changes in the implantation rate per million population during the last 10 years according to registry and Eucomed data are shown in figure 3.

The name of the hospital performing the procedure was recorded in 99.7% of forms (table 1). Most procedures (6364, 91%) were performed in publicly-funded health centers.
First implantations vs replacementsThis information was available in 6127 forms sent to the SEC (85.7% of the devices included in the registry). First implantations comprised 4551, representing 74.3% of the total (71.5% in 2018, 71.4% in 2017, 66.8% in 2016, and 71.8% in 2015). The rate of first implantations per million population was 96.8 (83.4 in 2018, 76.5 in 2017, 65.5 in 2016, and 75.1 in 2015).
Age and sexThe mean age of all patients undergoing ICD implantation or replacement was 62.1 ± 13.8 (4-97) years in 2019 vs 62.4 ± 13.5 (7-97) years in 2018, 62.3 ± 13.4 (6-90) years in 2017, 62.7 ± 13.4 (6-90) years in 2016, and 62.8 ± 13.3 (6-89) years in 2015. The mean age of patients at first implantation was 60.8 ± 13.8 years. As in previous years, patients were overwhelming male: they represented 82.1% of all patients and 83.0% of first implantations.
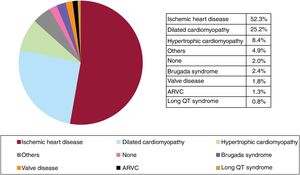
Underlying heart disease, left ventricular ejection fraction, functional class, and baseline rhythmThe most frequent underlying cardiac condition in first implantation patients was ischemic heart disease (52.3%), followed by dilated cardiomyopathy (25.2%), hypertrophy (8.4%), primary conduction abnormalities (Brugada syndrome and long QT syndrome) (3.2%), valve diseases (1.8%), and arrhythmogenic right ventricular cardiomyopathy (1.3%) (figure 4).
. ARVC, arrhythmogenic right ventricular cardiomyopathy; Others, patients with more than 1 diagnosis.")
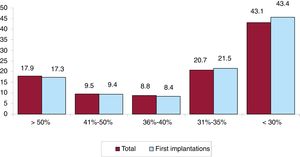
Left ventricular systolic function data were provided in 68.6% of forms. In the total patient group, left ventricular ejection fraction was > 50% in 17.9% of patients, from 41% to 50% in 9.5%, from 36% to 40% in 8.8%, from 31% to 35% in 20.7%, and ≤ 30% in 43.1% (figure 5). The distribution was similar when patients were grouped by first implantations and by replacements.
.")
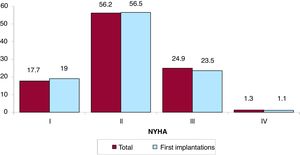
The New York Heart Association (NYHA) functional class was recorded in 44.7% of forms. Most patients were in NYHA class II (56.2%), followed by NYHA III (24.9%), NYHA I (17.7%), and NYHA IV (1.3%). The distribution for this variable was also very similar in the overall and first implantation groups (figure 6).
 functional class of total and first implantation patients.")
The baseline cardiac rhythm was recorded in 68.4% of forms. It was primarily sinus rhythm (78.3%), followed by atrial fibrillation (17.1%) and pacemaker rhythm (4.2%). The remaining patients had other rhythms (eg, atrial flutter and other arrhythmias).
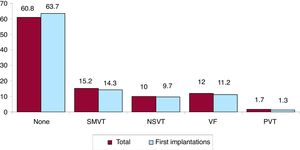
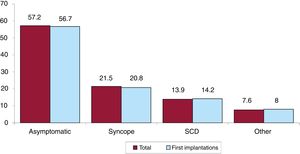
Clinical arrhythmia prompting implantation, its form of presentation, and the arrhythmia induced in the electrophysiological studyThe clinical arrhythmia prompting device implantation was reported in 68.8% of forms submitted to the registry. For first implantations, most patients had no documented clinical arrhythmias (63.7%), whereas 14.3% showed sustained monomorphic ventricular tachycardia, 9.7% had nonsustained ventricular tachycardia, and 11.2% had ventricular fibrillation. In total, patients with no documented clinical arrhythmia comprised 60.8% (figure 7). The most frequent presentation in both the total implantation group and the first implantation group (41.3% of completed responses) was asymptomatic (in more than half of patients), followed by syncope, sudden cardiac death, and other symptoms (figure 8).
. NSVT, nonsustained ventricular tachycardia; PVT, polymorphic ventricular tachycardia; SMVT, sustained monomorphic ventricular tachycardia; VF, ventricular fibrillation.")
. SCD, sudden cardiac death.")
Information on the electrophysiological studies performed before ICD implantation was provided in 62.7% of forms. These studies were performed in 324 patients (7.4%), mainly in those with ischemic heart disease or dilated cardiomyopathy and in 38.7% of patients with Brugada syndrome. Sustained monomorphic ventricular tachycardia was the most common induced arrhythmia (44.8%), followed by ventricular fibrillation (24.1%), nonsustained ventricular tachycardia (11.2%), and, to a lesser extent, other arrhythmias (5.4%). No arrhythmia was induced in 14.6% of the electrophysiological studies.
Clinical historyInformation on clinical history has been recorded since 2011, permitting establishment of the profile of patients undergoing ICD implantation in Spain.
Answers to some of these questions were provided in 68.8% of forms. The most pertinent information regarding cardiovascular risk and history is that hypertension was recorded in 54.4% of patients, hypercholesterolemia in 35.1%, smoking in 25.6%, diabetes mellitus in 28.9%, history of atrial fibrillation in 26.8%, family history of sudden cardiac death in 8.6%, renal failure in 12.6%, and history of stroke in 5.8%.
The QRS interval was recorded for 42.1% of first implantations (mean, 124.1 ms). In 30.8% of the patients, it was > 140 ms, and 86.1% of these patients had a resynchronization-defibrillator device (ICD-cardiac resynchronization therapy [CRT]).
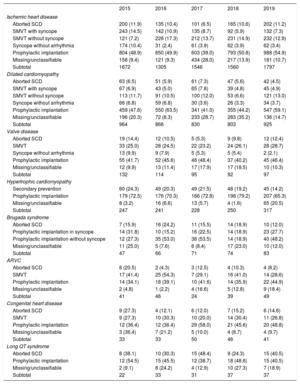
IndicationsThe changes in first implantations by type of heart disease and presentation from 2015 are shown in table 2. These data were provided in 66.1% of forms in 2019. Ischemic heart disease was the most frequent reason for ICD implantation in Spain, accounting for 52.3% of first implantations in 2019. Among ischemic heart disease patients, the most common indication was primary prevention (68.1%). However, a considerable number of forms returned failed to note the reason or it was unclassifiable. The second most common reason for ICD implantation was dilated cardiomyopathy (25.2% of all first implantations) and the absolute number of first implantations increased in 2019 vs previous years (925 in 2019 vs 803 in 2018, 830 in 2017, 866 in 2016, and 964 in 2015). The recovery in the number of units implanted in patients with dilated cardiomyopathy reflects the increase in primary prevention indications (59.1% vs 44.2% in 2018 and 41% in 2017). For the less common heart diseases, the most frequent indications were primary prevention of hypertrophic cardiomyopathy, congenital valve diseases, arrhythmogenic right ventricular cardiomyopathy, and Brugada syndrome. However, in long QT syndrome, the indication was evenly split between primary prevention and secondary to sudden cardiac death (40.5% each).
Number of first implantations according to type of heart disease, type of clinical arrhythmia, and form of presentation from 2015 to 2019
| 2015 | 2016 | 2017 | 2018 | 2019 | |
|---|---|---|---|---|---|
| Ischemic heart disease | |||||
| Aborted SCD | 200 (11.9) | 135 (10.4) | 101 (6.5) | 165 (10.6) | 202 (11.2) |
| SMVT with syncope | 243 (14.5) | 142 (10.9) | 135 (8.7) | 92 (5.9) | 132 (7.3) |
| SMVT without syncope | 121 (7.2) | 226 (17.3) | 212 (13.7) | 231 (14.9) | 232 (12.9) |
| Syncope without arrhythmia | 174 (10.4) | 31 (2.4) | 61 (3.9) | 62 (3.9) | 62 (3.4) |
| Prophylactic implantation | 804 (48.9) | 650 (49.9) | 603 (39.0) | 793 (50.8) | 988 (54.9) |
| Missing/unclassifiable | 158 (9.4) | 121 (9.3) | 434 (28.0) | 217 (13.9) | 181 (10.7) |
| Subtotal | 1672 | 1305 | 1546 | 1560 | 1797 |
| Dilated cardiomyopathy | |||||
| Aborted SCD | 63 (6.5) | 51 (5.9) | 61 (7.3) | 47 (5.6) | 42 (4.5) |
| SMVT with syncope | 67 (6.9) | 43 (5.0) | 65 (7.8) | 39 (4.8) | 45 (4.9) |
| SMVT without syncope | 113 (11.7) | 91 (10.5) | 100 (12.0) | 53 (6.6) | 121 (13.0) |
| Syncope without arrhythmia | 66 (6.8) | 59 (6.8) | 30 (3.6) | 26 (3.3) | 34 (3.7) |
| Prophylactic implantation | 459 (47.6) | 550 (63.5) | 341 (41.0) | 355 (44.2) | 547 (59.1) |
| Missing/unclassifiable | 196 (20.3) | 72 (8.3) | 233 (28.7) | 283 (35.2) | 136 (14.7) |
| Subtotal | 964 | 866 | 830 | 803 | 925 |
| Valve disease | |||||
| Aborted SCD | 19 (14.4) | 12 (10.5) | 5 (5.3) | 9 (9.8) | 12 (12.4) |
| SMVT | 33 (25.0) | 28 (24.5) | 22 (23.2) | 24 (26.1) | 28 (28.7) |
| Syncope without arrhythmia | 13 (9.9) | 9 (7.9) | 5 (5.3) | 5 (5.4) | 2 (2.1) |
| Prophylactic implantation | 55 (41.7) | 52 (45.6) | 46 (48.4) | 37 (40.2) | 45 (46.4) |
| Missing/unclassifiable | 12 (9.9) | 13 (11.4) | 17 (17.9) | 17 (18.5) | 10 (10.3) |
| Subtotal | 132 | 114 | 95 | 92 | 97 |
| Hypertrophic cardiomyopathy | |||||
| Secondary prevention | 60 (24.3) | 49 (20.3) | 49 (21.5) | 48 (19.2) | 45 (14.2) |
| Prophylactic implantation | 179 (72.5) | 176 (70.3) | 166 (72.8) | 198 (79.2) | 207 (65.3) |
| Missing/unclassifiable | 8 (3.2) | 16 (6.6) | 13 (5.7) | 4 (1.6) | 65 (20.5) |
| Subtotal | 247 | 241 | 228 | 250 | 317 |
| Brugada syndrome | |||||
| Aborted SCD | 7 (15.9) | 16 (24.2) | 11 (15.5) | 14 (18.9) | 10 (12.0) |
| Prophylactic implantation in syncope | 14 (31.8) | 10 (15.2) | 16 (22.5) | 14 (18.9) | 23 (27.7) |
| Prophylactic implantation without syncope | 12 (27.3) | 35 (53.0) | 38 (53.5) | 14 (18.9) | 40 (48.2) |
| Missing/unclassifiable | 11 (25.0) | 5 (7.6) | 6 (8.4) | 17 (23.0) | 10 (12.0) |
| Subtotal | 47 | 66 | 71 | 74 | 83 |
| ARVC | |||||
| Aborted SCD | 8 (20.5) | 2 (4.3) | 3 (12.5) | 4 (10.3) | 4 (8.2) |
| SMVT | 17 (41.4) | 25 (54.3) | 7 (29.1) | 16 (41.0) | 14 (28.6) |
| Prophylactic implantation | 14 (34.1) | 18 (39.1) | 10 (41.6) | 14 (35.9) | 22 (44.9) |
| Missing/unclassifiable | 2 (4.8) | 1 (2.2) | 4 (16.6) | 5 (12.8) | 9 (18.4) |
| Subtotal | 41 | 46 | 24 | 39 | 49 |
| Congenital heart disease | |||||
| Aborted SCD | 9 (27.3) | 4 (12.1) | 6 (12.0) | 7 (15.2) | 6 (14.6) |
| SMVT | 9 (27.3) | 10 (30.3) | 10 (20.0) | 14 (30.4) | 11 (26.8) |
| Prophylactic implantation | 12 (36.4) | 12 (36.4) | 29 (58.0) | 21 (45.6) | 20 (48.8) |
| Missing/unclassifiable | 3 (36.4) | 7 (21.2) | 5 (10.0) | 4 (8.7) | 4 (9.7) |
| Subtotal | 33 | 33 | 50 | 46 | 41 |
| Long QT syndrome | |||||
| Aborted SCD | 8 (38.1) | 10 (30.3) | 15 (48.4) | 9 (24.3) | 15 (40.5) |
| Prophylactic implantation | 12 (54.5) | 15 (45.5) | 12 (38.7) | 18 (48.6) | 15 (40.5) |
| Missing/unclassifiable | 2 (9.1) | 8 (24.2) | 4 (12.9) | 10 (27.3) | 7 (18.9) |
| Subtotal | 22 | 33 | 31 | 37 | 37 |
ARVC, arrhythmogenic right ventricular cardiomyopathy; SCD, sudden cardiac death; SMVT, sustained monomorphic ventricular tachycardia.
Data are expressed as No. (%).
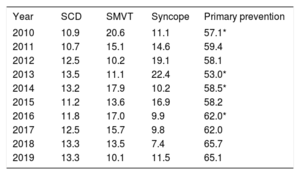
The implantation indication was identified in 66.0% of forms. Most first implantations were indicated for primary prevention (65.1%), a similar proportion to 2018 (65.7%) and an increase vs the previous year (table 3).
Changes in the main indications for implantable cardioverter-defibrillators (first implantations, 2010-2019)
| Year | SCD | SMVT | Syncope | Primary prevention |
|---|---|---|---|---|
| 2010 | 10.9 | 20.6 | 11.1 | 57.1* |
| 2011 | 10.7 | 15.1 | 14.6 | 59.4 |
| 2012 | 12.5 | 10.2 | 19.1 | 58.1 |
| 2013 | 13.5 | 11.1 | 22.4 | 53.0* |
| 2014 | 13.2 | 17.9 | 10.2 | 58.5* |
| 2015 | 11.2 | 13.6 | 16.9 | 58.2 |
| 2016 | 11.8 | 17.0 | 9.9 | 62.0* |
| 2017 | 12.5 | 15.7 | 9.8 | 62.0 |
| 2018 | 13.3 | 13.5 | 7.4 | 65.7 |
| 2019 | 13.3 | 10.1 | 11.5 | 65.1 |
SCD, sudden cardiac death; SMVT, sustained monomorphic ventricular tachycardia.
The implantation setting and specialist performing the procedure were recorded in 72.3% of forms. At 85.4%, the predominant implantation location was the electrophysiology laboratory (83.1% in 2018 and 81.4% in 2012), followed by the operating room (12.3%). Electrophysiologists performed 82.06% of implantations (80.6% in 2018 and 81.0% in 2012); surgeons performed 7.4% (9.2% in 2018 and 14% in 2012), and both together performed 6%. Other specialists and intensivists were involved in 2.3% and 2.4%, respectively.
Generator placement siteGenerator placement was recorded for 56.4% of first implantations. Placement was subcutaneous in 95.6% of patients and subpectoral in the remaining 4.4%. These figures were 94.9% and 5.1%, respectively, for all devices implanted.
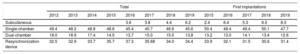
Device typeThe types of device implanted are shown in table 4. This information was provided in 96.9% of forms submitted to the registry. In 2019, first implantations of subcutaneous defibrillators increased to 8.3% (6.0% in 2018, 5.3% in 2017, 6.4% in 2016, and 2.4% in 2015), largely due to a fall in the implantation of single-chamber defibrillators.
Percent distribution of implanted devices by type
| Total | First implantations | ||||||||||||
|---|---|---|---|---|---|---|---|---|---|---|---|---|---|
| 2012 | 2013 | 2014 | 2015 | 2016 | 2017 | 2018 | 2019 | 2015 | 2016 | 2017 | 2018 | 2019 | |
| Subcutaneous | 3.6 | 3.8 | 4.4 | 6.2 | 2.4 | 6.4 | 5.3 | 6.0 | 8.3 | ||||
| Single-chamber | 49.4 | 48.2 | 48.8 | 48.6 | 45.4 | 45.7 | 46.6 | 45.6 | 50.4 | 48.4 | 49.4 | 50.1 | 47.7 |
| Dual-chamber | 18.0 | 18.9 | 17.4 | 14.5 | 13.7 | 15.0 | 15.0 | 13.8 | 13.2 | 13.0 | 14.1 | 13.4 | 12.6 |
| Resynchronization device | 32.5 | 32.9 | 33.7 | 35.7 | 37.3 | 35.68 | 34.0 | 34.4 | 33.9 | 32.1 | 31.5 | 30.6 | 31.4 |
The most frequent reason for replacement was battery depletion (80.9%); complications prompted 7.4% of replacements (9.1% in 2018). Of the 827 replacements providing this information, 2.1% were performed before 6 months.
Information was available on lead status in 52.5% of forms; 2.86% were malfunctioning (44 forms) and they were extracted in 13.6% of the patients reporting this problem.
Device programmingInformation on device programming was provided in 64.9% of forms. The most widely used programming was VVI (52.7%), followed by DDD (28.1%), VVIR (6.3%), DDDR (6.6%), and others (6.3%), largely algorithms to prevent ventricular pacing.
Ventricular fibrillation induction was tested in 380 patients, representing 8.1% of the 4711 records providing this information (5.3% in 2018 and 6.7% in 2012). The mean number of shocks delivered was 1.1. Thus, in the vast majority of cases, the threshold was not calculated and device functioning simply tested.
ComplicationsComplication development was recorded in 75.0% of forms. There were 30 complications: 8 coronary sinus dissections, 1 tamponade, 1 pneumothorax, 7 deaths, and 12 unspecified. The mortality rate was 0.1%, similar to that of the last 3 years (0.2% in 2018, 0.09% in 2017, 0.02% in 2016, 0.07% in 2015, and 0.05% in 2014), although the number fortunately remains quite low.
DISCUSSIONWith 95% of implantations reported to Eucomed, the 2019 Implantable Cardioverter-defibrillator Registry provides information on the vast majority of ICD implantations performed in Spain. This high degree of registry participation is partly due to the work performed by the SEC but mainly thanks to the involvement of the implantation centers. As in previous years, the results show major differences in implantation rates among the autonomous communities and rates far below the average ICD implantation rate in Europe.
Comparison with registries of previous yearsThe SEC is committed to the quality of cardiovascular care in Spain, as exemplified by the Spanish Implantable Cardioverter-defibrillator Registry, with its systematic publication of data since 2005.5 This consistency allows us to identify trends in ICD implantation, the types of devices used, and the characteristics of the patients undergoing ICD implantation in our country in recent years. The period evaluated shows a progressive increase in the number of ICD implantations, with periodic reductions in the 2011 to 2012 period and in 2017 vs previous years. The number of units implanted in Spain has increased in the last 2 years. Together with the slight decrease in the number of implantations in Europe in this period,11 this growth has reduced, albeit slightly, the major differences between Spain and the rest of Europe. While the rate of implantations per million population in Spain in 2010 was about half of the European average (116 vs 248), the difference from Europe reduced last year, with a rate of 157 implantations per million in 2019 (vs 152 in 2018 and 138 in 2017) vs a decrease in Europe from 311 in 2017 to 303 in 2019.
Despite the increase in ICD implantations in 2019, the rate of implantations in Spain continues to be lower than expected given the scientific evidence endorsed in the clinical practice guidelines.1–3 The impact of the underuse of ICD therapy was reflected in a recently published Swedish study12 that showed that, between 2000 and 2016, an ICD was ultimately implanted in only 10% of patients with an ICD indication for primary prevention of sudden cardiac death (according to ESC guidelines). ICD implantation was associated with mortality reductions of 27% in the first year of follow-up and of 12% at 5 years. The Implantable Cardioverter-defibrillator Registry also shows a clear underuse of ICD therapy in Spain and highlights the importance of new measures to increase ICD use in patients who would benefit from this approach.
The latest registry data confirm the increase in primary prevention indication observed in recent years, with a 65.1% rate of prophylactic implantations (table 3), which once again brings us slightly closer to the European average. The rate of prophylactic implantations has increased by 9.2% in the last 10 years. Other European registries also show that primary prevention is the leading indication for ICD implantation, with rates of about 80%.13,14
Regarding the types of devices implanted in Spain, the data show a stabilization in the percentage of primary ICD-CRT implantations after the progressive decrease detected in previous years (31.4% in 2019 vs 30.6% in 2018, 31.5% in 2017, and 32.1% in 2016). The percentage of first implantations of single- and dual-chamber ICDs fell in 2019. The decline in single-chamber devices can be explained by the increase in the percentage of first implantations of subcutaneous ICDs (8.3% in 2019 vs 6.0% in 2018 and 5.3% in 2017). Undoubtedly, the results of the Praetorian study presented in the latest meeting of the Heart Rhythm Association, which determined that subcutaneous ICDs are not inferior to transvenous ICDs, will increase the use of subcutaneous ICD in the coming years.15,16
The most frequent indication in 2019 was once again ischemic heart disease (52%), followed by dilated cardiomyopathy (25.2%). Dilated cardiomyopathy as a percentage of the heart disease prompting the ICD implantation stabilized in 2019 after the decline seen in previous years. This fall was largely due to lower use of ICD therapy in the primary prevention of sudden cardiac death, which fell drastically in Spain after the publication of the DANISH study.17 This phenomenon was also seen to a greater or lesser extent in other European countries.18 We do not consider this decline justified based on the available data, for various reasons. First, more than half of the patients in the DANISH study had a cardiac resynchronization device, which partly limits the value of the results for patients without resynchronization indication. Second, a clear benefit was found in patients younger than 70 years, which represent the overwhelming majority of implantations in Spain.6,7 Third, the results of 2 meta-analyses once again showed a consistent benefit of ICDs in this patient population, with a 25% reduction in the relative risk of death.19,20 Finally, the only guidelines published after the results of the DANISH trial maintain the indication for ICD implantation for primary prevention in patients with dilated cardiomyopathy (class I, level of evidence A).1
There were no changes from previous registries in the epidemiological characteristics of the patients. Patients with severe ventricular dysfunction and in NYHA II and III continue to predominate. No changes were seen either in the specialist performing the implantation and most procedures were once again performed in the electrophysiology laboratory.
Differences among autonomous communitiesAs in previous years, the data from the 2019 registry once again show differences in the implantation rates per million population of the various autonomous communities. Several communities showed higher than average rates: Cantabria (255), Principality of Asturias (200), Aragon (180), Galicia (175), the Basque Country (172), Valencian Community (166), Castile-La Mancha (165), Chartered Community of Navarre (162), Castile and León (157), Extremadura (156), and Community of Madrid (156). Below average were Catalonia (135), the Region of Murcia (128), La Rioja (126), Andalusia (121), the Balearic Islands (121), and the Canary Islands (116). A generalized increase was seen in the rate of implantations per million population in 2019. Only the Principality of Asturias (200 vs 214 in 2018), Extremadura (156 vs 168 in 2018), and the Canary Islands (116 vs 118 in 2018) had lower implantation rates per million population vs 2018. The difference between the communities with the highest and lowest implantation rates continue to be marked, which is difficult to explain in terms of the theoretically homogeneous Spanish health system. These differences are not explained by income level or population density or by the different incidences of ischemic heart disease and heart failure among the autonomous communities. This situation might call into question the equity of our health care system in an area as important as that of the prevention of sudden cardiac death.
Comparison with other countriesIn 2019, the implantation rate in the countries participating in the Eucomed was 303 per million population (302 in 2018, 307 in 2017, and 316 in 2016), including ICDs and ICD-CRTs. For the first time since the Eucomed began publishing European implantation data, the Czech Republic, with 458 devices per million population, was the country with the highest implantation rate, overtaking Germany (457), which was the European country with the highest ICD implantation rate in previous years. One consistent finding is that Spain (157 implantations/million) is the country with the lowest number of implantations. Several countries showed higher than average rates: Italy (476), Denmark (391), the Netherlands (369), and Poland (327). Below average were Austria (266), Sweden (256), Belgium (250), Ireland (242), Finland (242), Norway (239), Switzerland (230), Portugal (226), France (223), Greece (213), the United Kingdom (212), Hungary (164), and, in last place, Spain (157). However, the difference in the implantation rate in Spain from the European average slightly decreased in 2019 (157 vs 303 compared with 152 vs 302 in 2018, 138 vs 307 in 2017, 144 vs 320 in 2016, and 138 vs 315 in 2015). As can be seen from these figures, only 2 countries in Europe have an ICD implantation rate per million population less than 200: Hungary and Spain.
The ICD-CRT implantation rate was 119 per million population (117 in 2018, 122 in 2017, 127 in 2016, and 124 in 2015). As in the overall group and for the first time, the Czech Republic (204 implantations) was the country with the highest number of implantations, surpassing Germany (188), the second country in terms of device implantations. In contrast, Spain stands out, unfortunately, as the country with the lowest implantation rate (53). The proportion of ICD-CRTs with respect to the total varies from 28% in Denmark and 31% in Ireland to 45% in the Czech Republic. The European average is 39%. Above the average are the Czech Republic, Finland, France, Germany, Hungary, Italy, Portugal, Switzerland, and the United Kingdom. Only Denmark has a rate below 30%. Spain has a proportion of 33%.21
These countries have the same regional differences14,22 seen in the Spanish registry, for reasons that are hard to explain. One possible explanation is the number of available arrhythmia units, but that does not explain the relationship, at least in Spain, because communities with the highest number of available units had lower implantation rates. Income does not seem to be factor because countries with lower incomes than Spain, such as Ireland, the Czech Republic, and Poland, show much higher implantation rates. Nor can these differences be explained by the prevalence of cardiovascular diseases or population age. Regardless, the implantation rate in Spain might reflect a lower degree of acceptance of and adherence to clinical practice guidelines, which has been linked to increased mortality in patients with cardiovascular disease. This situation, evident in successive registries, should compel us, electrophysiologists first and cardiologists second, to improve our ability to identify candidates for ICD implantations due to the major benefits of the therapy, which include reduced morbidity and mortality in at-risk patients.
LimitationsThe 2019 registry collected data on 95% of implantations, higher than in previous years but still below 2017, when the registry recorded data on 97% of all ICD implantations. As in previous years, completion of the different fields in the implantation form varied and was lower than desired. In addition, no follow-up data were collected from patients, which would permit more relevant clinical studies. Finally, the unequal completion of the data on ICD-associated complications and the absence of follow-up data probably underestimate the actual complication rate.
Future prospects of the Spanish Implantable Cardioverter-defibrillator RegistryThis registry is the 16th official report. The durability of this registry is a credit to all of the participating members of the Heart Rhythm Association of the SEC. In 2019, a website9 for the online completion of the implantation form for both ICDs and pacemakers was launched by the SEC in collaboration with the Spanish Agency for Medicines and Health Products. This website enables the real-time recording of both types of implantable heart devices. We hope that the availability of this website will improve the completion rate and quality of the registry. This platform will undoubtedly enable the performance of prospective studies and will boost the safety of patients with devices affected by any possible safety alerts in the coming years.
CONCLUSIONSThe 2019 Spanish Implantable Cardioverter-defibrillator Registry collected information on 95% of all implantations performed in Spain, approximating the totality of the activity and current indications for this therapy in Spain. In 2019, the total number of implantations per million population reached its highest number since activity recording began. Although this increase has resulted in a slight decrease in the differences in implantation rates between Spain and the rest of the European countries, the gap is still wide, which compels us to improve our ability to identify patients that may benefit from this therapy. As in previous years, there were major differences among autonomous communities.
CONFLICTS OF INTERESTI. Fernández Lozano has participated in clinical studies sponsored by Medtronic, Abbott, and Biotronik and has fellowship grants from the SEC and the Interhospital Foundation for Cardiovascular Research. J. Osca Asensi has participated in clinical studies sponsored by Abbott, Boston, and Biotronik. J. Alzueta Rodríguez has participated in presentations sponsored by Boston and has received fellowship grants from the FIMABIS Foundation.