
Composite endpoints are widely used but have several limitations. The Clinical outcomes, healthcare resource utilization and related costs (COHERENT) model is a new approach for visually displaying and comparing composite endpoints including all their components (incidence, timing, duration) and related costs. We aimed to assess the validity of the COHERENT model in a patient cohort.
MethodsA color graphic system displaying the percentage of patients in each clinical situation (vital status and location: at home, emergency department [ED] or hospital) and related costs at each time point during follow-up was created based on a list of mutually exclusive clinical situations coded in a hierarchical fashion. The system was tested in a cohort of 1126 patients with acute heart failure from 25 hospitals. The system calculated and displayed the time spent in each clinical situation and health care resource utilization-related costs over 30 days.
ResultsThe model illustrated the times spent over 30 days (2.12% in ED, 23.6% in index hospitalization, 2.7% in readmissions, 65.5% alive at home, and 6.02% dead), showing significant differences between patient groups, hospitals, and health care systems. The tool calculated and displayed the daily and cumulative health care-related costs over time (total, €4 895 070; mean, €144.91 per patient/d).
ConclusionsThe COHERENT model is a new, easy-to-interpret, visual display of composite endpoints, enabling comparisons between patient groups and cohorts, including related costs. The model may constitute a useful new approach for clinical trials or observational studies, and a tool for benchmarking, and value-based health care implementation.
Keywords
Composite endpoints allow a better understanding of the behavior of a disease, increasing efficiency by capturing a larger number of events in shorter time periods, and reducing sample sizes and the cost of trials. However, their use is associated with several challenges.1–3 Currently, there is no single way to present and analyze the different individual components of composite outcomes, including their timing and duration.
Acute heart failure (AHF) is a good scenario for the use of composite outcomes. AHF is a frequent and serious condition characterized by changes in clinical status over short periods of time, high short-term morbidity and mortality,4,5 substantial use of health care resources, and high cost.6,7 The ideal outcome(s) for describing the journey of AHF patients or evaluating the effect of new therapies or models of care with a single endpoint remains unsolved.3 Traditional endpoints, such as the composite of mortality or readmissionization, have been used with limitations but no satisfactory solution is available to analyze the different components of composite outcomes beyond incidence or time to occurrence.
This project aimed to develop a new system to display, evaluate and compare different composite endpoints in an easy-to-interpret based on graphical representations, with the ability to measure the incidence, timing, and duration of its individual components as well as their costs.
METHODSConceptual modelThe Clinical outcomes, healthcare resource utilization and related costs (COHERENT) Project is an initiative of investigators from the Centro Nacional de Investigaciones Cardiovasculares (CNIC), the Epidemiology of Acute Heart Failure in Emergency Departments (EAHFE) Spanish Registry, and the Cardiology Department and Research Institute of Hospital Universitario 12 de Octubre, Madrid, Spain, to develop a new system to evaluate complex composite outcomes in an easier way using graphical models. A hierarchical code system defining a mutually exclusive list of potentially relevant clinical situations was defined, in which the selected combination of these situations is the outcome of interest. We defined clinical situations as the patient's clinical status (alive or dead) and location (at home, in the emergency department [ED], or in hospital). Clinical situations were computed in each defined time frame. Additional subcodes were developed for classifying individual hospital or outpatient services (ie, department where the patient was admitted), and for the causes of clinical outcomes (ie, HF-related, cardiovascular, all-cause).
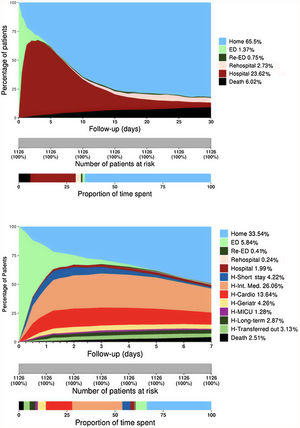
Graphical model designA system for displaying the pattern of clinical situations over time was developed through an area graph, plotting the percentage of patients in each possible clinical situation category on the Y-axis and each day of follow-up on the X-axis. The graphs are composed of a set of stacked colored vertical columns changing over time, each column representing 100% of patients observed, and colors representing the percentage of patients in each clinical situation (figure 1A). Time points were assumed to be full days, with the exception of the 6- or 12-hour periods used to assess the first days in the “detailed model” (figure 1B). The number of categories shown in the graph can be personalized, from the basic model (at home, in hospital, dead) to a comprehensive model showing all departments involved or the causes of each endpoint. The graph was designed with R Project for Statistical Computing, version 3.4.3 (© 2017 The R Foundation for Statistical Computing, Vienna Austria).8
 with each status coded in a different color. A: COHERENT Basic Model showing the time of mortality (black area), time in the ED, including revisits (green areas), time in hospital, including readmissions (reddish areas), time alive at home (light blue area). B: COHERENT Detailed Model. This short-term graph includes the analysis of the first 7 days with an additional split by hours during the first 3 days (useful for the analysis of ED performance), and a detailed analysis of units where patients spend the first days in the hospital. Cardio, cardiology department; ED, emergency department; Geriatr, geriatrics department; H, Hospital; Int, internal; MICU, medical intensive care unit.")
COHERENT model: 30-day time distribution of predefined categories in the patient cohort after an ED visit for acute heart failure. The Y-axis represents the percentage of patients in each status at any time point (in days, X-axis) with each status coded in a different color. A: COHERENT Basic Model showing the time of mortality (black area), time in the ED, including revisits (green areas), time in hospital, including readmissions (reddish areas), time alive at home (light blue area). B: COHERENT Detailed Model. This short-term graph includes the analysis of the first 7 days with an additional split by hours during the first 3 days (useful for the analysis of ED performance), and a detailed analysis of units where patients spend the first days in the hospital. Cardio, cardiology department; ED, emergency department; Geriatr, geriatrics department; H, Hospital; Int, internal; MICU, medical intensive care unit.
A cohort of patients with AHF was used to illustrate the model. This was developed ad hoc by randomly selecting 50 AHF patients from each of the 24 Spanish EDs enrolled in the Epidemiology of Acute Heart Failure in Emergency Departments (EAHFE) Registries 4 (February-March, 2014) and 5 (January-February, 2016).9 The clinical situations during the 30 days after the index episode (ED visit for AHF) were retrospectively recorded.
Use of the model for comparisonsThe ability of the model to compare outcomes was evaluated by visual and statistical techniques in different settings: a) comparisons between patient subgroups was tested by comparing differences in outcomes by patient characteristics; b) comparisons of patterns of care (ie, admission to different departments; timings, such as length of stay in the ED or in hospital; or readmissions) was tested by comparing different types of hospitals (ie, benchmarking) or health care systems. For the latter, we compared our data with a simulated cohort using published United States outcome data from patients hospitalized with heart failure.10,11
Cost calculationData published by the Ministry of Health of Spain in 2014 was used to report costs for clinical situations. Mean estimated costs were used for ED visits, hospitalization at home or inpatients using the Spanish National Health Service hospital episodes for discharges with International Classification Diseases, Ninth Review, Clinical Modification codes 389.91, 402.01, 402.11, 402.91, 404.01, 404.03, 404.11, 404.13, 404.91, 404.93, and 428*.12 Total and mean costs were calculated for episodes of care —defined as the set of services provided to a patient with a medical problem within a time period in a specific integrated system (ie, hospital)—and for patient journey, which included the addition of all episodes that a patient with a medical problem experienced over the observation time (30 days here). The cost of each hospitalization episode was calculated as the product of the number of cases of each All Patient Diagnosis Related Group multiplied by the mean cost (estimated from the cost of 79 general Spanish hospitals) normalized by the total number of cases. Other costs were calculated as the ratio between the hospital expenditures of the Spanish National Health Service and the activity recorded in the Specialized Care Information System weighted according to the different health care modalities (ED stay without hospitalization, and part-time hospitalization for hospitalization at home).13 Further details on cost calculation are shown in the , including estimates of daily cost per hospital unit ().
Statistical analysisSummary statistics of the clinical status of all groups are presented as percentages of the total time spent in each clinical situation category. Costs are presented as absolute expenditures (in euros) and percentage of total cost by follow-up time, units of patient care or type of care and mean±standard deviation (SD) per patient and month or day. Considering that no single statistical test can compare all the information integrated in the visual models and to protect the integrity of the statistical analysis, particular care was taking to avoid type I errors given the multiplicity of data (multiple outcomes, subgroup analyses, repeated measures over time). Hence, we suggested 2 approaches to perform the statistical analysis: a) once differences between patterns were apparent visually, formal statistical tests could be applied to claim differences between groups in their differing clinical situation;b) application of formal statistical testing on the predefined composite outcome(s) of interest ().
EthicsThe EAHFE 4 and 5 registries were approved by the Ethics Committee of Hospital Universitario Central de Asturias, Oviedo, Spain. Patients gave informed consent to participate and be contacted for follow-up.
RESULTSDescriptive graph developmentThe figure 1A depicts the clinical situation registered during each day of the 30 days after index ED visit for each of the 1126 AHF patients with full information available (93.8% of those eligible). The reasons for exclusion were incomplete follow-up in 9 patients and incorrect code values in 65 patients. Baseline characteristics are presented in . The distribution of the clinical situation category during the first 30 days is shown in table 1 and figure 1. The light green area represents the time spent in the first ED visit by the whole cohort (mean, 0.64 days, 2.14% of total time), the brown area represents the days spent in the first hospitalization (mean, 7.09 days, 23.63%), the black area represents the days after death (mean, 1.81 days, 6.02%). The light blue area represents days alive out of hospital (DAOH) (mean, 19.65 days, 65.56%). Considering resource utilization, 23.6% of the follow-up time corresponded to index hospitalizations (dark brown area), 2.7% to readmissionizations (light brown), and 0.8% to subsequent ED visits (dark green) (figure 1A). Cumulative 30-day mortality was 8.7%, accounting for 6.0% of the total follow-up time (black area, figure 1A). Most deaths were due to cardiovascular causes. More detailed information for the first 7 days is shown in figure 1B. Hospitalization in critical care units (cardiac or general) accounted for 0.5% of the time and hospitalization in regular hospital wards for 25.8%, including internal medicine (11.2%), cardiology (5.9%), geriatrics (2.0%), chronic long-term hospitalization (2.2%), other hospital wards (1.3%), and transfers to other hospitals (1.9%) (table 1).
Time spent in the most frequent situation during the 30-day journey following emergency department consultation in patients with acute heart failure (absolute and relative times)
| Time spent in each clinical statusat the end of 30-day journey | ||
|---|---|---|
| (Mean days) | (% of total time) | |
| At home | 19.65 | 65.50 |
| At ED | 0.64 | 2.12 |
| During index ED visit | 0.41 | 1.37 |
| ED revisits | 0.23 | 0.77 |
| In-hospital | 7.91 | 26.36 |
| Index hospitalization | 7.09 | 23.63 |
| Readmission | 0.82 | 2.73 |
| Location during hospitalization | ||
| Internal medicine | 3.36 | 11.20 |
| During index hospitalization | 2.94 | 9.80 |
| During readmissionizations | 0.42 | 1.40 |
| Cardiology | 1.78 | 5.93 |
| During index hospitalization | 1.61 | 5.37 |
| During readmissionizations | 0.17 | 0.57 |
| Geriatrics | 0.59 | 1.97 |
| During index hospitalization | 0.53 | 1.77 |
| During readmissionizations | 0.06 | 0.20 |
| Short-stay unit | 0.37 | 1.23 |
| During index hospitalization | 0.34 | 1.13 |
| During readmissionizations | 0.03 | 0.10 |
| Intensive care unit | 0.16 | 0.52 |
| During index hospitalization | 0.16 | 0.52 |
| During readmissionizations | 0.001 | 0.003 |
| Chronic long-stay hospitalization | 0.67 | 2,23 |
| During index hospitalization | 0.63 | 2,10 |
| During readmissionizations | 0.05 | 0,17 |
| Other hospital wards | 0.40 | 1,33 |
| During index hospitalization | 0.31 | 1,03 |
| During readmissionizations | 0.08 | 0,27 |
| Transferred to another hospital | 0.58 | 1.93 |
| Mortality | 1.81 | |
| Cardiovascular death | 1.20 | |
| Noncardiovascular death | 0.44 | |
| Death, unknown cause | 0.17 | |
ED, emergency department.
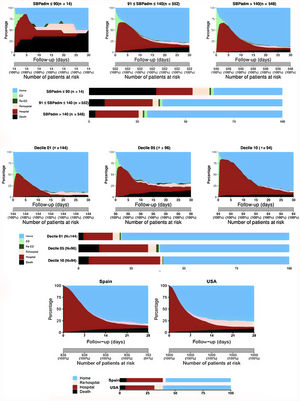
Because initial systolic blood pressure (SBP) is a strong prognostic factor in AHF, we tested the model comparing the outcomes of patients with SBP <90mmHg (n = 14, 1.3%), SBP 90-140mmHg (n=552, 49.6%), and SBP> 140mmHg (n=548, 49.2%). Differences in mortality, hospitalization time and DAOH were visually apparent (figure 2A) and statistically significant (P <.001).
. The first decile (Decile 01) includes the hospitals with the shortest LOS and the tenth decile (Decile 10) those with the longest LOS. The patterns are obviously different. P <.001 for outcome comparison. C: comparison of outcome patterns between the EAHFE cohort (Spain, left), and a simulated USA cohort (right) based on literature data,10,11 using only hospitalized patients (ED visits were not included in this analysis). EAHFE, Epidemiology of Acute Heart Failure in Emergency Departments; ED, emergency department; SBPadm, systolic blood pressure on admission; USA, United States of America.")
Examples of the use of the COHERENT model to compare outcome patterns according to different risk profiles, hospitals, and different health care systems. A: comparison of outcome patterns in patients with hypotensive, normotensive, and hypertensive acute heart failure, including ED stays. P <.001 for outcome comparison. B: comparison of outcome patterns among hospitals according to their deciles of length of stay (LOS). The first decile (Decile 01) includes the hospitals with the shortest LOS and the tenth decile (Decile 10) those with the longest LOS. The patterns are obviously different. P <.001 for outcome comparison. C: comparison of outcome patterns between the EAHFE cohort (Spain, left), and a simulated USA cohort (right) based on literature data,10,11 using only hospitalized patients (ED visits were not included in this analysis). EAHFE, Epidemiology of Acute Heart Failure in Emergency Departments; ED, emergency department; SBPadm, systolic blood pressure on admission; USA, United States of America.
Differently performing hospitals were compared according to their tercile of length of stay (LOS) by choosing 2 of the participating hospitals from the first decile, 2 from the fifth decile, and 2 form the tenth decile (means: 4.3, 7.6 and 10.2 days, respectively) (figure 2B). The graph visually shows not only the obvious difference in the times spent in hospital (14.0%, 24.4%, and 32.9%, respectively), set by definition, but also the differences in the alternatives, such as times spent in the ED (3.8%, 5.8%, 3.3%), at home (75.3%, 61.6%, and 57.8%), and in subsequent hospitalizations (4.0%, 2.1%, 1.1%) (all P values <.001). A comparison between the Spanish cohort and the simulated United States cohort showed differences in LOS and readmission rates between countries without differences in DAOH at 30 days (figure 2C). As an example of the flexibility of the system, we excluded ED visits from this analysis, as this information was not available for the United States.
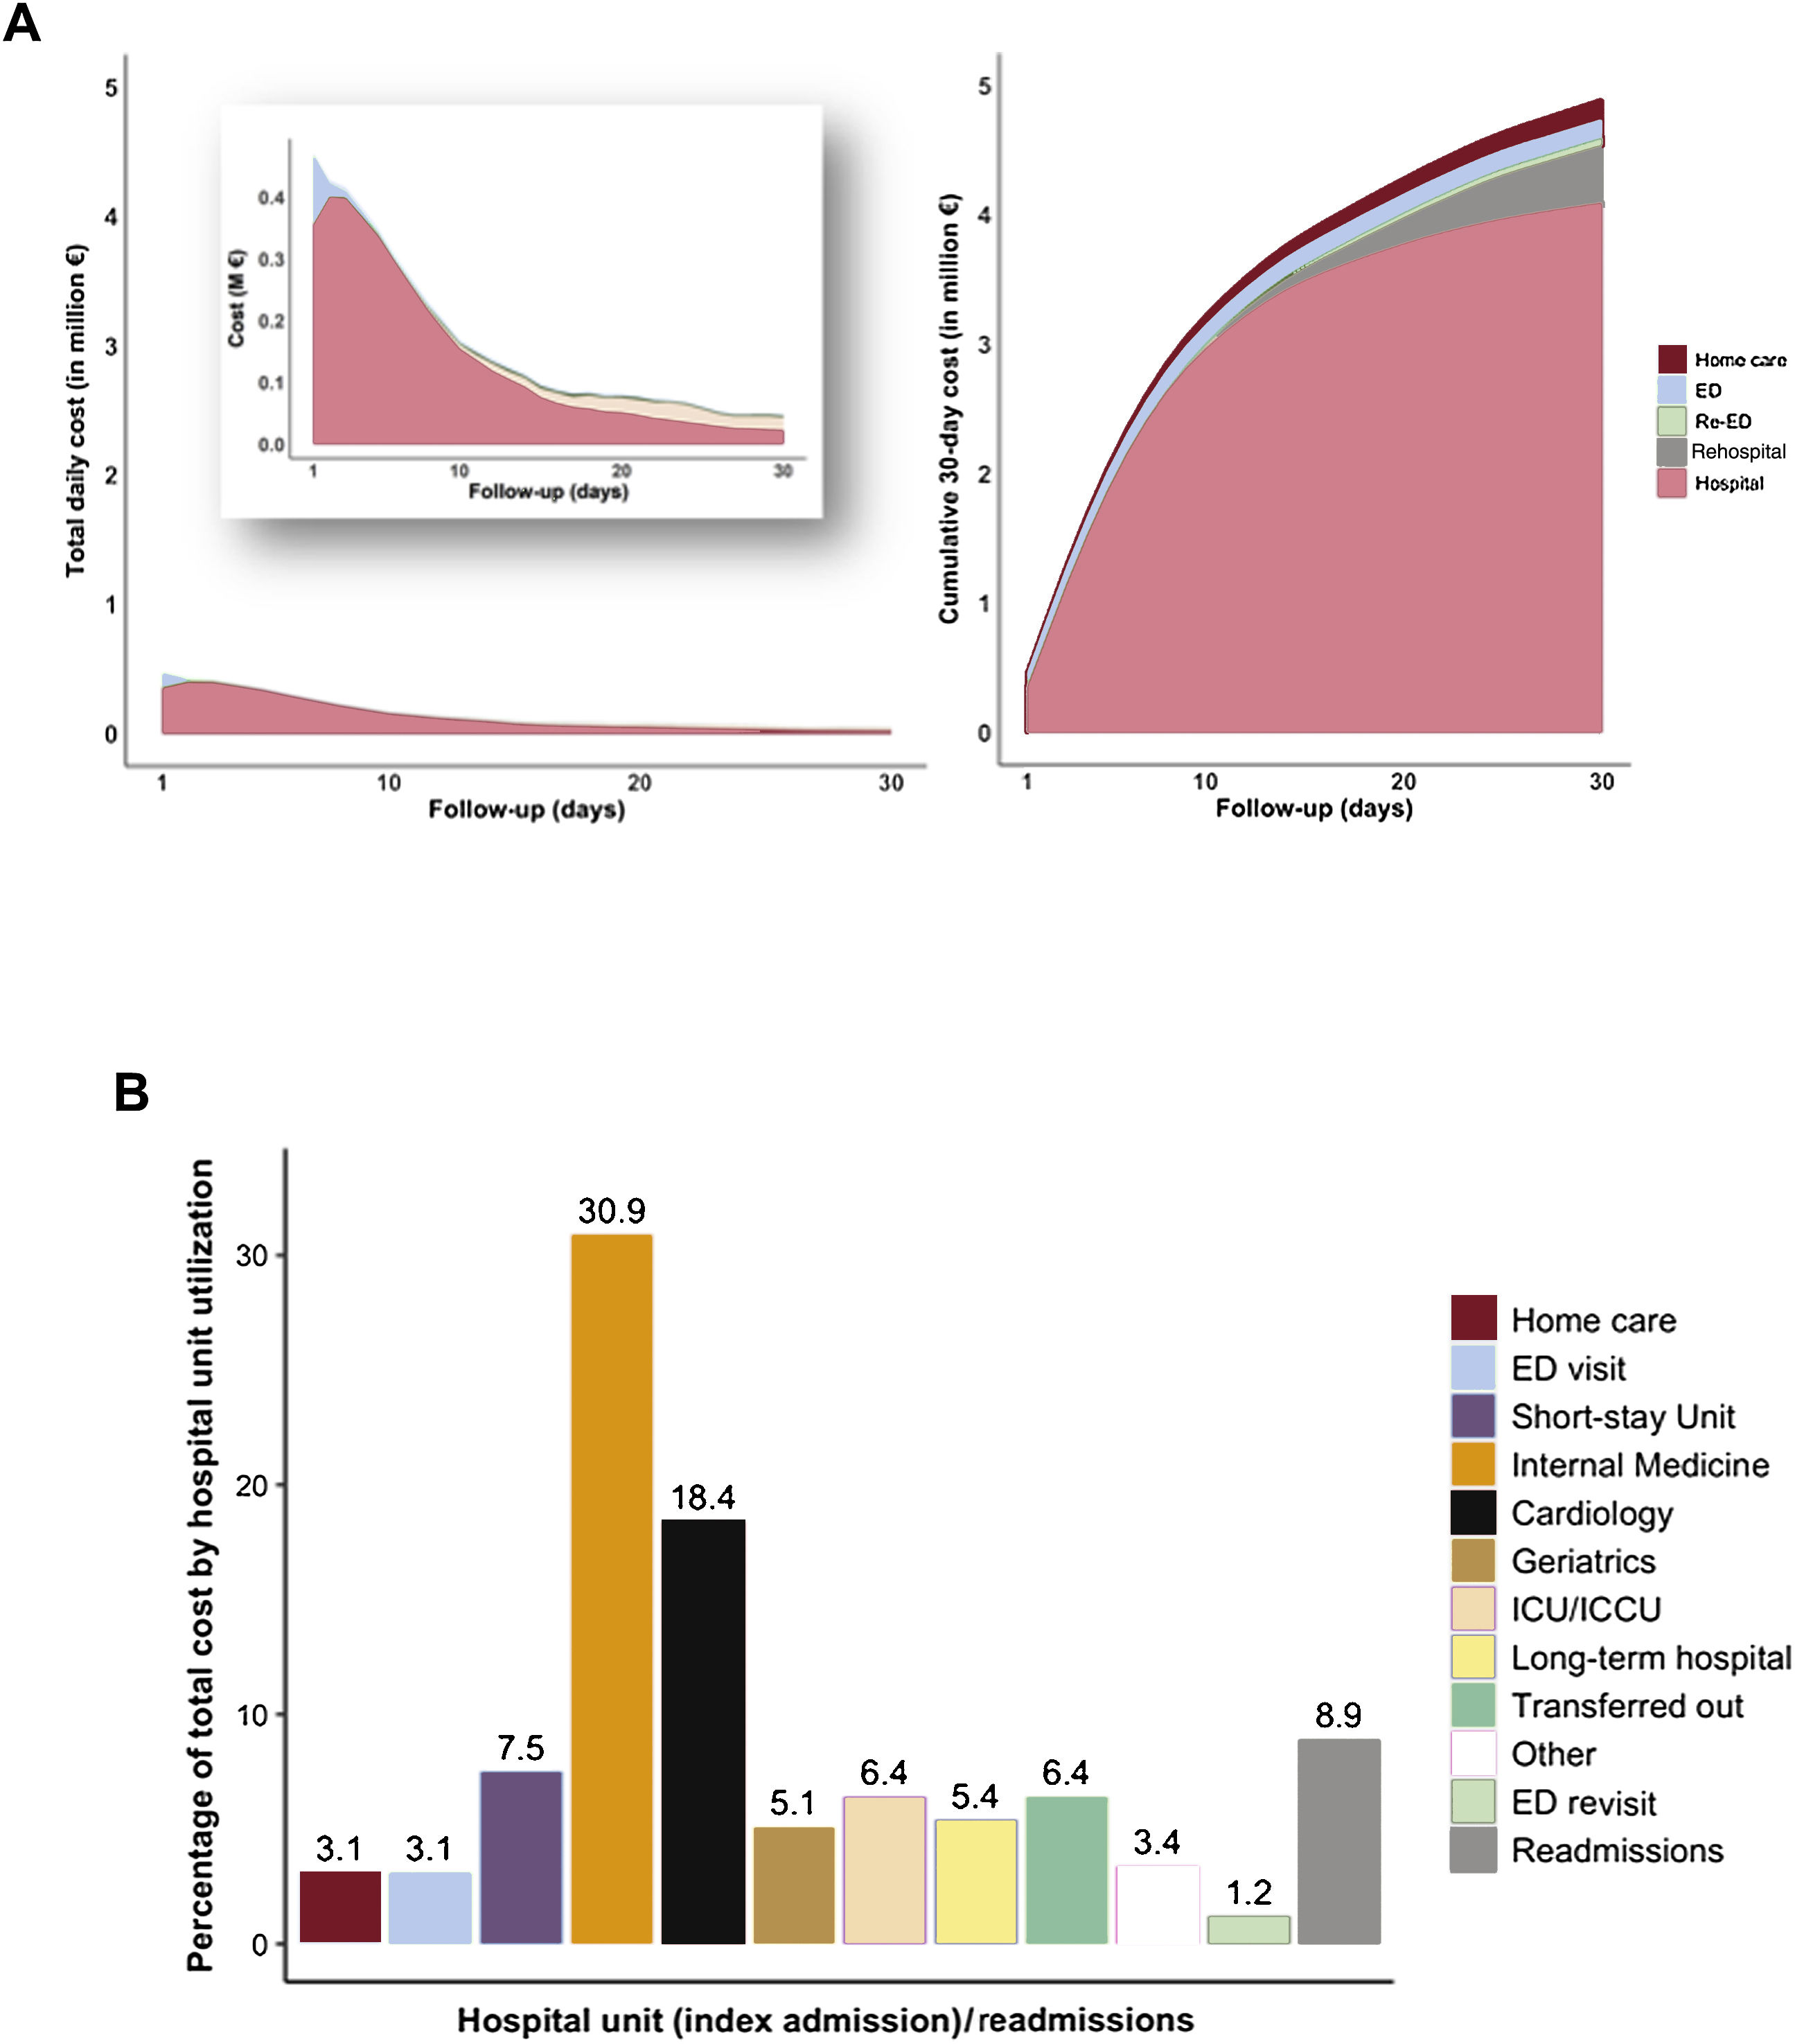
Cost calculationsAn overall calculation of the 30-day cost of services was done per clinical status, per episode, and per patient journey with the estimated daily costs per hospital units (table 2, figure 3). For the whole study group, the calculated cost was €4 895 070 (approximately 5.7 million United States $), with a mean cost per patient journey at 30 days of €4347.3, that is, €144.91 per patient/d. The costs were concentrated in the first 7 days (48.6%), reaching 76.7% at the end of the second week (figure 3A). Index hospitalizations accounted for 83.6% of the total cost, readmissions for 9.0%, all ED visits for 4.3%, while internal medicine (35.4%), cardiology (20.3%) and short-stay units (8.1%) generated most of the total cost whereas the cost related to admissions in critical care units accounted for 6.5%. The episodes with the highest mean costs included admissions to the intensive cardiac care unit (€12 627), transfers-out (€5823), long-term (€5395) and cardiology (€4403) units (figure 3B).
Costs per patient journey, clinical status, and episode during the first 30 days for the whole cohort
| Frequencies | Cost(in euros) | % | |
|---|---|---|---|
| Total number of patients | 1126 | 100 | |
| Total number of patient-days | 33 780 | 100 | |
| Total cost | 4 895 069.9 | 100 | |
| Mean cost per patient journey | 4347.3 | ||
| Mean cost per patient per day | 144.9 | ||
| Total cost per clinical status | |||
| Emergency department* | 208 848.0 | 4.27 | |
| Home care | 149 376.0 | 3.05 | |
| Hospital | 4 536 845.9 | 92.68 | |
| Index hospitalizations | 4 094 249.2 | 83.64 | |
| Cardiology | 898 258.6 | 18.35 | |
| Geriatrics | 250 843.4 | 5.12 | |
| ICCU/CCU | 315 683.7 | 6.45 | |
| Internal medicine | 1 513 713.1 | 30.92 | |
| Short stay unit | 369 248.3 | 7.54 | |
| Other hospital departments | 746 502.0 | 15.24 | |
| Readmissions | 442 596.7 | 9.04 | |
| Cardiology | 95 226.1 | 1.95 | |
| Geriatrics | 27 295.3 | 0.56 | |
| ICCU/CCU | 1497.7 | 0.03 | |
| Internal medicine | 217 403.1 | 4.44 | |
| Short stay unit | 28 612.1 | 0.58 | |
| Other hospital departments | 72 562.3 | 1.48 | |
| Mean cost per episode | 2813.3 | ||
| Number of episodes | 1740 | 100 | |
| Emergency department | 678 | 308.0 | 38.97 |
| Home care | 36 | 4149.3 | 2.07 |
| Hospital | 1026 | 4421.9 | 58.97 |
| Index hospitalizations | 897 | 4564.4 | 51.55 |
| Readmissions | 129 | 3431.0 | 7.41 |
ED, emergency department; ICCU/CCU, intensive cardiac care unit/coronary care unit.
 and 30-day cumulative cost (right). B: distribution of hospital-related cost according to the use of hospital units during index hospitalizations and readmissions. ED, emergency department; ICCU/CCU, intensive cardiac care unit/coronary care unit.")
Visual cost analysis using the COHERENT model. A: time-related cost analysis for the whole cohort: Daily analysis, resembling health care resource use (left) and 30-day cumulative cost (right). B: distribution of hospital-related cost according to the use of hospital units during index hospitalizations and readmissions. ED, emergency department; ICCU/CCU, intensive cardiac care unit/coronary care unit.
Composite endpoints capture larger numbers of events in a shorter time, reducing sample sizes and, ultimately, study costs. The COHERENT model offers additional advantages over traditional composite endpoints including: a) the possibility of describing easy-to-interpret visual “patterns” of care or behaviors of multiple outcomes simultaneously—that is, snapshots of the evolution of a cohort or the performance of health care systems—; b) the ability to add more details in the description of outcomes (different timings, location during hospitalization, cause for readmission or death), which may be helpful for more in-depth analysis of clinical resource use or cause-specific endpoint analysis; c) the power to compare different cohorts or groups of patients, making them ideal for clinical assessment and benchmarking, and d) the possibility of incorporating cost analysis facilitating economic studies.
Clinical assessmentThe model offers a graphic representation of the journey over time of AHF, a complex clinical scenario with a vulnerable period—usually managed in hospital but not always (a number of patients are discharged directly from the ED)—, a phase of clinical instability after discharge, with wide variability in clinical outcomes and resource utilization according to patient characteristics and regional clinical practices.14–18 The best outcome(s) for the evaluation of new therapies for AHF, a challenging scenario where a variety of composite endpoints have been proposed,3 is unknown. The COHERENT model allows the inclusion of several of the most relevant outcome measures for assessing treatment results and can be used for outcome comparison between patient subgroups (ie, treatments in a randomized trial), including DAOH19,20 or hometime21 after discharge, defined as being more patient-centered than traditional clinical outcomes. Measuring DAOH may be particularly relevant for old and sick patients, such as AHF patients, who may attach higher value to spending more time at home. These new outcomes, however, still need validation or integration into consolidated composite outcomes, an advantage offered by COHERENT.
Another original approach and strength of the COHERENT model is that it allows the journey to start from the first ED visit. The ACC/AHA guidelines indicate AHF as that requiring hospitalization22 and most studies describe AHF only from the hospital perspective. However, this view ignores the significant proportion of patients who visit the ED and are directly discharged home 24%—in our cohort and higher in other countries15—, a group often neglected but consuming significant health care resources, especially if they reconsult or need hospitalization soon after ED discharge, which deserves more attention for risk stratification and clinical management.15 For a better analysis of the earlier phase, an option to split the initial time frames into 6-hour intervals was implemented (figure 2B). This is relevant for analysis of ED patients, especially in settings where strict ED time rules apply, such as the 4-hour discharge rules in the United Kingdom or Western Australia.23,24
BenchmarkingThe COHERENT model offers the possibility of comparing “patterns of care”, as shown in figure 2B,C. The former shows 3 different types of hospital behaviors, 2 characterized by early decisions in the ED, and one with longer ED stays (center). The case on the left could be defined as “aggressive” with a high proportion of early discharges from the ED, and the right example as “conservative”, with a majority of patients hospitalized with greater LOS. In the middle are the hospitals whose hospitalization rates are lower but at the expense of leaving the patients several days in the ED. This information may be very relevant for management and decision-making (ie, to check whether the observed patterns of clinical practice fit the strategic or economic models of one or a group of hospitals) and, although it is not easy to assess, the COHERENT model allows it to be interpreted at a glance.
The figures also show how these patterns impact on other outcomes, such as readmissions or DAOH. Figure 2C is an example of how the visual model may help to compare the performance of different health care systems. A striking finding was the similarity in DAOH observed in both health care systems despite the differences in LOS modeled for the index hospitalization according to real data in Spain and published data from the United States. Therefore, the model provides important complementary information, which may be relevant for health care analysis and management.
Cost analysis and health care resource utilizationThe model displays and calculates costs from the hospital perspective, the most important part in cost calculation for patients with heart failure,25 conducted using an incidence-based approach,26 measuring how the cost of heart failure care changes from the index ED episode over the progression of the disease during follow-up. It supports a bottom-up method (“person-based”), assigning costs to patients using data from real cases if available, and a top-down method (“population-based”), allocating aggregated costs obtained from indirect estimates.27 Although the cost components may be subject to some variations according to the existing information in each case, in general the economic burden of heart failure will preferably be considered in terms of direct costs, such as those attributed both to outpatient and inpatient cost. However, the system would allow calculation of outpatient costs, such as primary care or specialist visits, heart failure clinic visits, cardiac rehabilitation, skilled nurse facilities, and home care, as well as estimation of the costs of home care, recording the hours of caregiving provided.28 Interestingly, our model allows measurement and calculation of costs for observation stays, an increasingly important health care resource use, with heterogeneous pathways and billing models, often ignored in readmission measures and quality indices.29
Future workThe model is data demanding, requiring complete information of the clinical status at each established time point of follow-up (ie, each day), so it is well fitted for clinical trials or exhaustive observational studies but not necessarily for routine practice. The feasibility of the model based on data extracted from information systems and for longer follow-up times is currently ongoing. The model has been tested in AHF patients, for which it is particularly well suited. Tests in other acute and chronic disease models are also ongoing.
Study limitationsThe data demand of the model has been mentioned. The COHERENT model has a number of statistical challenges: It is a method of visual display for longitudinal data on composite endpoints. In the pursuit of formal statistical inference, several considerations (beyond the remit of this article) need to be tackled: a) the risk of inflated type I errors when making comparisons such as multiple-time points; b) the potential need for appropriate repeated measures models in combining such data; c) the development of appropriate summary statistics for inferring global effects over time; d) with longer follow-up, the effect of censoring could matter and multiple imputations may be relevant; e) if the focus is on nonfatal events, eg, readmissionization then the competing risk of death needs to be accounted for, which becomes more challenging if repeat events are analyzed. As it stands now, this method is a descriptive tool to visualize the progress of cohorts/groups throughout follow-up but has no inferential role. The basic statistical tests have been provided for hypothesis-generating purposes, not to make inferences. Care must be taken in comparing different graphs, as these may represent different timings or processes of care because, although the model has been designed for use as a single instrument to measure time-related outcomes, the starting and finishing points can be personalization according to the study design and objectives so a single endpoint cannot capture all outcomes in a single variable. Although 30 days is a standard time for follow-up in outcome studies, the starting and finishing points for different outcomes change. ED visit, hospital admission or randomization date may be starting points, while the finishing time will be the 30th day since admission for 30-day mortality or since discharge for 30-day readmission. A solution is to program longer or shorter follow-ups according to the study needs. In this regard, it is important to mention that the percentages shown in table 1 do not exactly represent the full picture of the cohort, as several data were censored. This is true for index hospitalization (3.2% of patients remained in hospital after 30 days) and in particular for readmission rates, where a lower burden compared with specifically focused studies is found. Having a full picture of index admission and readmissions would require a longer follow-up than 30 days.
Finally, dyspnea alleviation, functional outcomes, or quality of life, which may be relevant for diseases such as AHF, cannot be incorporated in the model, as these are not mutually exclusive with the other outcomes.
CONCLUSIONSThe COHERENT model facilitates the visual description of the incidence, timing, and duration of all components of different composite outcomes, as well as hospital-related costs, allowing comparisons of patient subgroups, cohorts, and patterns of care. This model may be used as a new endpoint for clinical trials and a tool for benchmarking, economic analysis, and value-based health care implementation.
- -
The advantages of the use of composite outcomes in clinical research are counterbalanced by several limitations, such as the inability to show all components of the individual contributing endpoints and the difficulties of addressing competing risks. Economic endpoints have not been integrated in commonly used composite endpoints.
- -
The COHERENT model uses easy-to-interpret visual outputs to present the incidence, timing and duration of all components of personalized composite outcomes, as well as hospital-related costs. The system allows comparisons between subgroups and different cohorts. This model may be useful as a new endpoint for clinical trials, a tool for benchmarking, economic analysis, and value-based health care implementation.
This project was developed without specific funding. The project was awarded by HealthStart madri+d as one of the 5 finalist innovations in health developed by universities, public health care, research, or technology institutions from the Comunidad de Madrid, Spain, during year 2019.
AUTHORS’ CONTRIBUTIONSH. Bueno conceived the model and drafted the manuscript. Ò. Miró and F.J. Martín-Sánchez contributed to the development of the model, critically reviewed the manuscript content, and coordinated the study group data collection and initial analysis. V. Gil, P. Llorens, J. Jacob, P. Herrero-Puente contributed to the study group coordination and data collection, and critically reviewed the manuscript content. J.L. Bernal did all the economic calculations. J.L. Bernal, X. Rossello, G. Moreno and S.J. Pocock contributed to the to the development of the model, analysis plan, statistical analysis and critically reviewed the manuscript content. V. Jiménez-Jiménez, C. Goñi, N. Naranjo, S. Garrote and J.C. Silla-Castro worked in the development of the system and the engine tool, and approved the manuscript content. All other researchers of the ICA-SEMES ad hoc COHERENT Study Group approved the project and collected the clinical data and approved the final version before submission. H. Bueno had full access to all the data in the study and takes responsibility for its integrity and the data analysis.
CONFLICTS OF INTERESTThe authors state that they have no specific conflict of interests related to the present work. Dr Bueno receives research funding from Astra-Zeneca, BMS, Janssen and Novartis; has received consulting fees from Astra-Zeneca, Bayer, BMS-Pfizer, Novartis; and speaking fees or support for attending scientific meetings from Astra-Zeneca, Bayer, BMS-Pfizer, Novartis, and MEDSCAPE-the heart.og. The ICA-SEMES Research Group has received unrestricted support from Orion Pharma and Novartis. The present study was designed, performed, analyzed, and written exclusively by the authors, independently of any funding source.
CNIC is supported by the Spanish Ministry of Economy and Competitiveness (MINECO) and the Pro-CNIC Foundation, and is a Severo Ochoa Center of Excellence (MINECO award SEV-2015-0505). The EHAFE Registry was partially supported by grants from the Instituto de Salud Carlos III with funds from the Spanish Ministry of Health and FEDER (PI15/01019, PI15/00773, PI18/00393, PI19/00456) and Fundació La Marató de TV3 (2015/2510). The Emergencies: Processes and Pathologies research group of the IDIBAPS receives financial support from the Catalonian Government for Consolidated Groups of Investigation (GRC 2009/1385 and 2014/0313). H. Bueno receives research funding from Instituto de Salud Carlos III, Spain (PIE16/00021 & PI17/01799), X. Rossello has received support from the SEC-CNIC CARDIOJOVEN fellowship program. G. Moreno received funds from the European Social Funds through the 2016 Young Employment Initiative–Research Support Contracts (PEJ16/MED/AI-1132) provided by the Comunidad de Madrid, and is currently funded by the Ministerio de Educación y Formación Profesional with a grant for the training of university professors (FPU18/03606) in Universidad Complutense de Madrid. S. Garrote is funded by European Social Funds through the 2018 Young Employment Initiative-Predoctoral Contracts (PEJD-2018-PRE/BMD-9013) provided by the Community of Madrid. O. Miró receives funding from the Spanish Ministry of Health and FEDER (PI15/01019, PI18/00773), La Marató de TV3 (2015/2510) and from the Catalonian Government for Consolidated Groups of Investigation (GRC 2009/1385, 2014/0313, 2017/1424).
We appreciate the support of Fátima Sánchez-Cabo, PhD (CNIC); Gema García Sáez, Engr (Universidad Politécnica de Madrid) and Elena Hernando, Engr (Universidad Politécnica de Madrid) in the development of the COHERENT model engine.
Supplementary data associated with this article can be found in the online version available at https://doi.org/10.1016/j.rec.2021.08.009