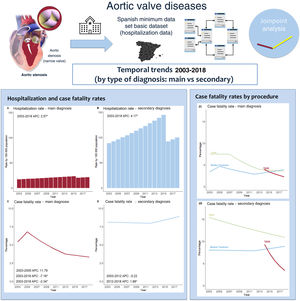
The impact of therapeutic improvements in nonrheumatic aortic valve disease (NRAVD) has been assessed at the patient level but not in the whole population with the disease. Our objective was to assess temporal trends in hospitalization rates, treatment and fatality rates in patients with a main or secondary NRAVD diagnosis.
MethodsRetrospective analysis of administrative claims from patients hospitalized with a main or secondary NRAVD diagnosis between 2003 and 2018 in Spain. Time trends in age- and sex-standardized hospitalization and procedure rates, baseline characteristics and case fatality rates by diagnosis type were assessed by Poisson regression and joinpoint analysis.
ResultsHospital admissions in patients with NRAVD increased from 69 213 in 2003 to 136 185 in 2018. The crude in-hospital fatality rate increased from 6.7% to 8.7% (IRR, 1.015; 95%CI, 1.012-1.018; P <.001) without changes after adjustment. Adjusted fatality rates decreased in patients with a main NRAVD diagnosis (5.5% to 3.5%; IRR, 0.953; 95%CI, 0.942-0.964) but increased in those with a secondary diagnosis (8.0% to 8.8%; IRR, 1.005; 95%CI, 1.002-1.009). Aortic valve replacements increased from 10.5 to 17.1 procedures per 100 000 population (IRR, 1.033; 95%CI, 1.030-1.037), mainly driven by transcatheter procedures (IRR, 1.345; 95%CI, 1.302-1.389).
ConclusionsHospitalizations in patients with NRAVD are increasing, with most being secondary diagnoses. The use of aortic valve replacement is increasing with a reduction in fatality rates but only in patients with a main diagnosis.
Keywords
The prevalence of rheumatic valve disease has decreased in high-income countries during the few last decades while the importance of nonrheumatic heart valve disease has been increasing,1,2 mainly aortic stenosis, with a prevalence estimated to be approximately 12% of the population older than 75 years.3 Mortality due to symptomatic aortic stenosis with medical treatment alone is very high.4 The extension and progresses in surgical aortic valve replacement (SAVR)5,6 and, more recently, with transcatheter aortic valve implantation (TAVI), has improved the prognosis of these patients.7 TAVI offers a new opportunity for patients considered previously inoperable or at very high surgical risk with good results,8,9 and its use has been expanded to patients with lower surgical risk, with results comparable to those of SAVR.10,11 The benefits of SAVR and TAVI have been shown mainly at the individual level. However, the extent to which the expansion of these therapies has changed the landscape of nonrheumatic aortic valve disease (NRAVD) is unknown.
The aim of this study was to assess temporal trends in hospitalizations for patients with NRAVD, including those with a main or secondary diagnosis, and to assess the changes in incidence, characteristics, treatments, and hospital fatality.
METHODSPopulationInformation on all hospitalizations of patients with a diagnosis of NRAVD as the main or secondary diagnosis occurring in all Spanish hospitals between 2003 and 2018 was obtained from the national hospital registry.12 The completion of this record is mandatory and covers virtually all hospitalizations in public hospitals in Spain.13 We included patients with International Classification of Diseases (ICD)-9 code 424.1 (aortic valve disorders), used until 2015, and ICD-10 code I35 (nonrheumatic aortic valve disorders), used since 2016. These comprise aortic stenosis, aortic insufficiency and mixed aortic valve disease (stenosis + insufficiency). We excluded patients younger than 18 years or with unspecified sex, with Marfan syndrome (ICD9, 759.82; ICD-10, Q87), rheumatic valve disease (ICD-9, 395; ICD-10, I06, I08), congenital valve disease (ICD-9, 746.3; ICD-10, Q23) and aortic aneurysm or dissection (ICD-9, 441; ICD-10, I71), as well as those without proper codes. The matching between the ICD-9 and ICD-10 codes is shown in the . We also excluded hospital stays of less than 2 days, as well as those with a discharge destination different from home or death.
This study was approved by the research ethics committee of Hospital Universitario 12 de Octubre. Due to the administrative nature of the data used, it was not necessary to obtain informed consent.
Variables and measuresHospitalizations were classified as those with NRAVD as the main diagnosis or as a secondary diagnosis. Age, sex and clinical characteristics (comorbidities) were registered. Age groups were categorized as: 18-44, 45-54, 55-64, 65-74, 75-84 and> 84 years. The degree of comorbidity was measured by the Charlson Index (Deyo version for ICD-9 codes), and the Quan Charlson Index for ICD-10, using the “Charlson” Stata and “comorbidity” R packages, respectively.14,15 Length of stay was measured in days.
The number of hospitalizations and specific NRAVD therapeutic procedures were counted for each year: aortic valve replacement (AVR), including SAVR and TAVI, and balloon aortic valvuloplasty (BAV). The codes used to identify each procedure are shown in , both for the ICD9 (2003-2015) and ICD10 (2016-2018) periods. In the case of TAVI, its codification began in 2014, showing no previous records. Age- and sex-standardized hospitalization and utilization rates per 100 000 population were obtained through the direct method for each procedure and subgroup. The population used for hospitalization and utilization standardized rates was established by the profile of the Spanish population during the study period (data obtained from the National Institute of Statistics, Spain).16 Both crude (cCFR) and age- and sex-standardized case fatality rates (sCFR) were used. The reference population for case fatality rates (sCFR, per 100 hospital admissions) was done using the whole population admitted during the study period.
Statistical analysisCategorical variables are presented as numbers and percentages, and quantitative variables as mean±standard deviation. To analyze changes in categories during the study period, a chi square for trends test (Cochrane-Armitage) was performed, using the “ptrend” Stata command. For mean comparisons, a Kruskal-Wallis test was used, after ruling out normality. Trends in year-to-year standardized rates were analyzed with Poisson regression models with robust variance, with the incidence rate ratio (IRR) as the association measure (percentage of annual variation of trends).17 As changes in trend direction over time cannot be estimated with the Poisson model, an additional joinpoint model analysis was performed for each subgroup. This method provides the annual percentage change (APC). As the change in ICD coding between 2015 and 2016 should have an impact on the trend analysis, a joinpoint jump model analysis with 2015 as the jump location was performed. This correction for trends analysis after code changes has previously been evaluated in other diseases.18,19 For CFR, a standard joinpoint model was used. The trend in TAVI utilization rates was also analyzed by this method, due to the lack of sufficient observation units (years) to perform a joinpoint jump model. The joinpoint jump model and standard joinpoint model were performed with the Surveillance Research Program (National Cancer Institute of the United States) Software.20 All other analyses were performed with Stata IC 16.1 (Stata-Corp., College Station, United States) and R (R Core Team, 2019, Austria) software.
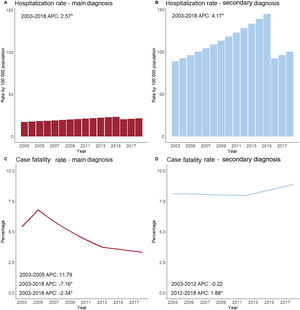
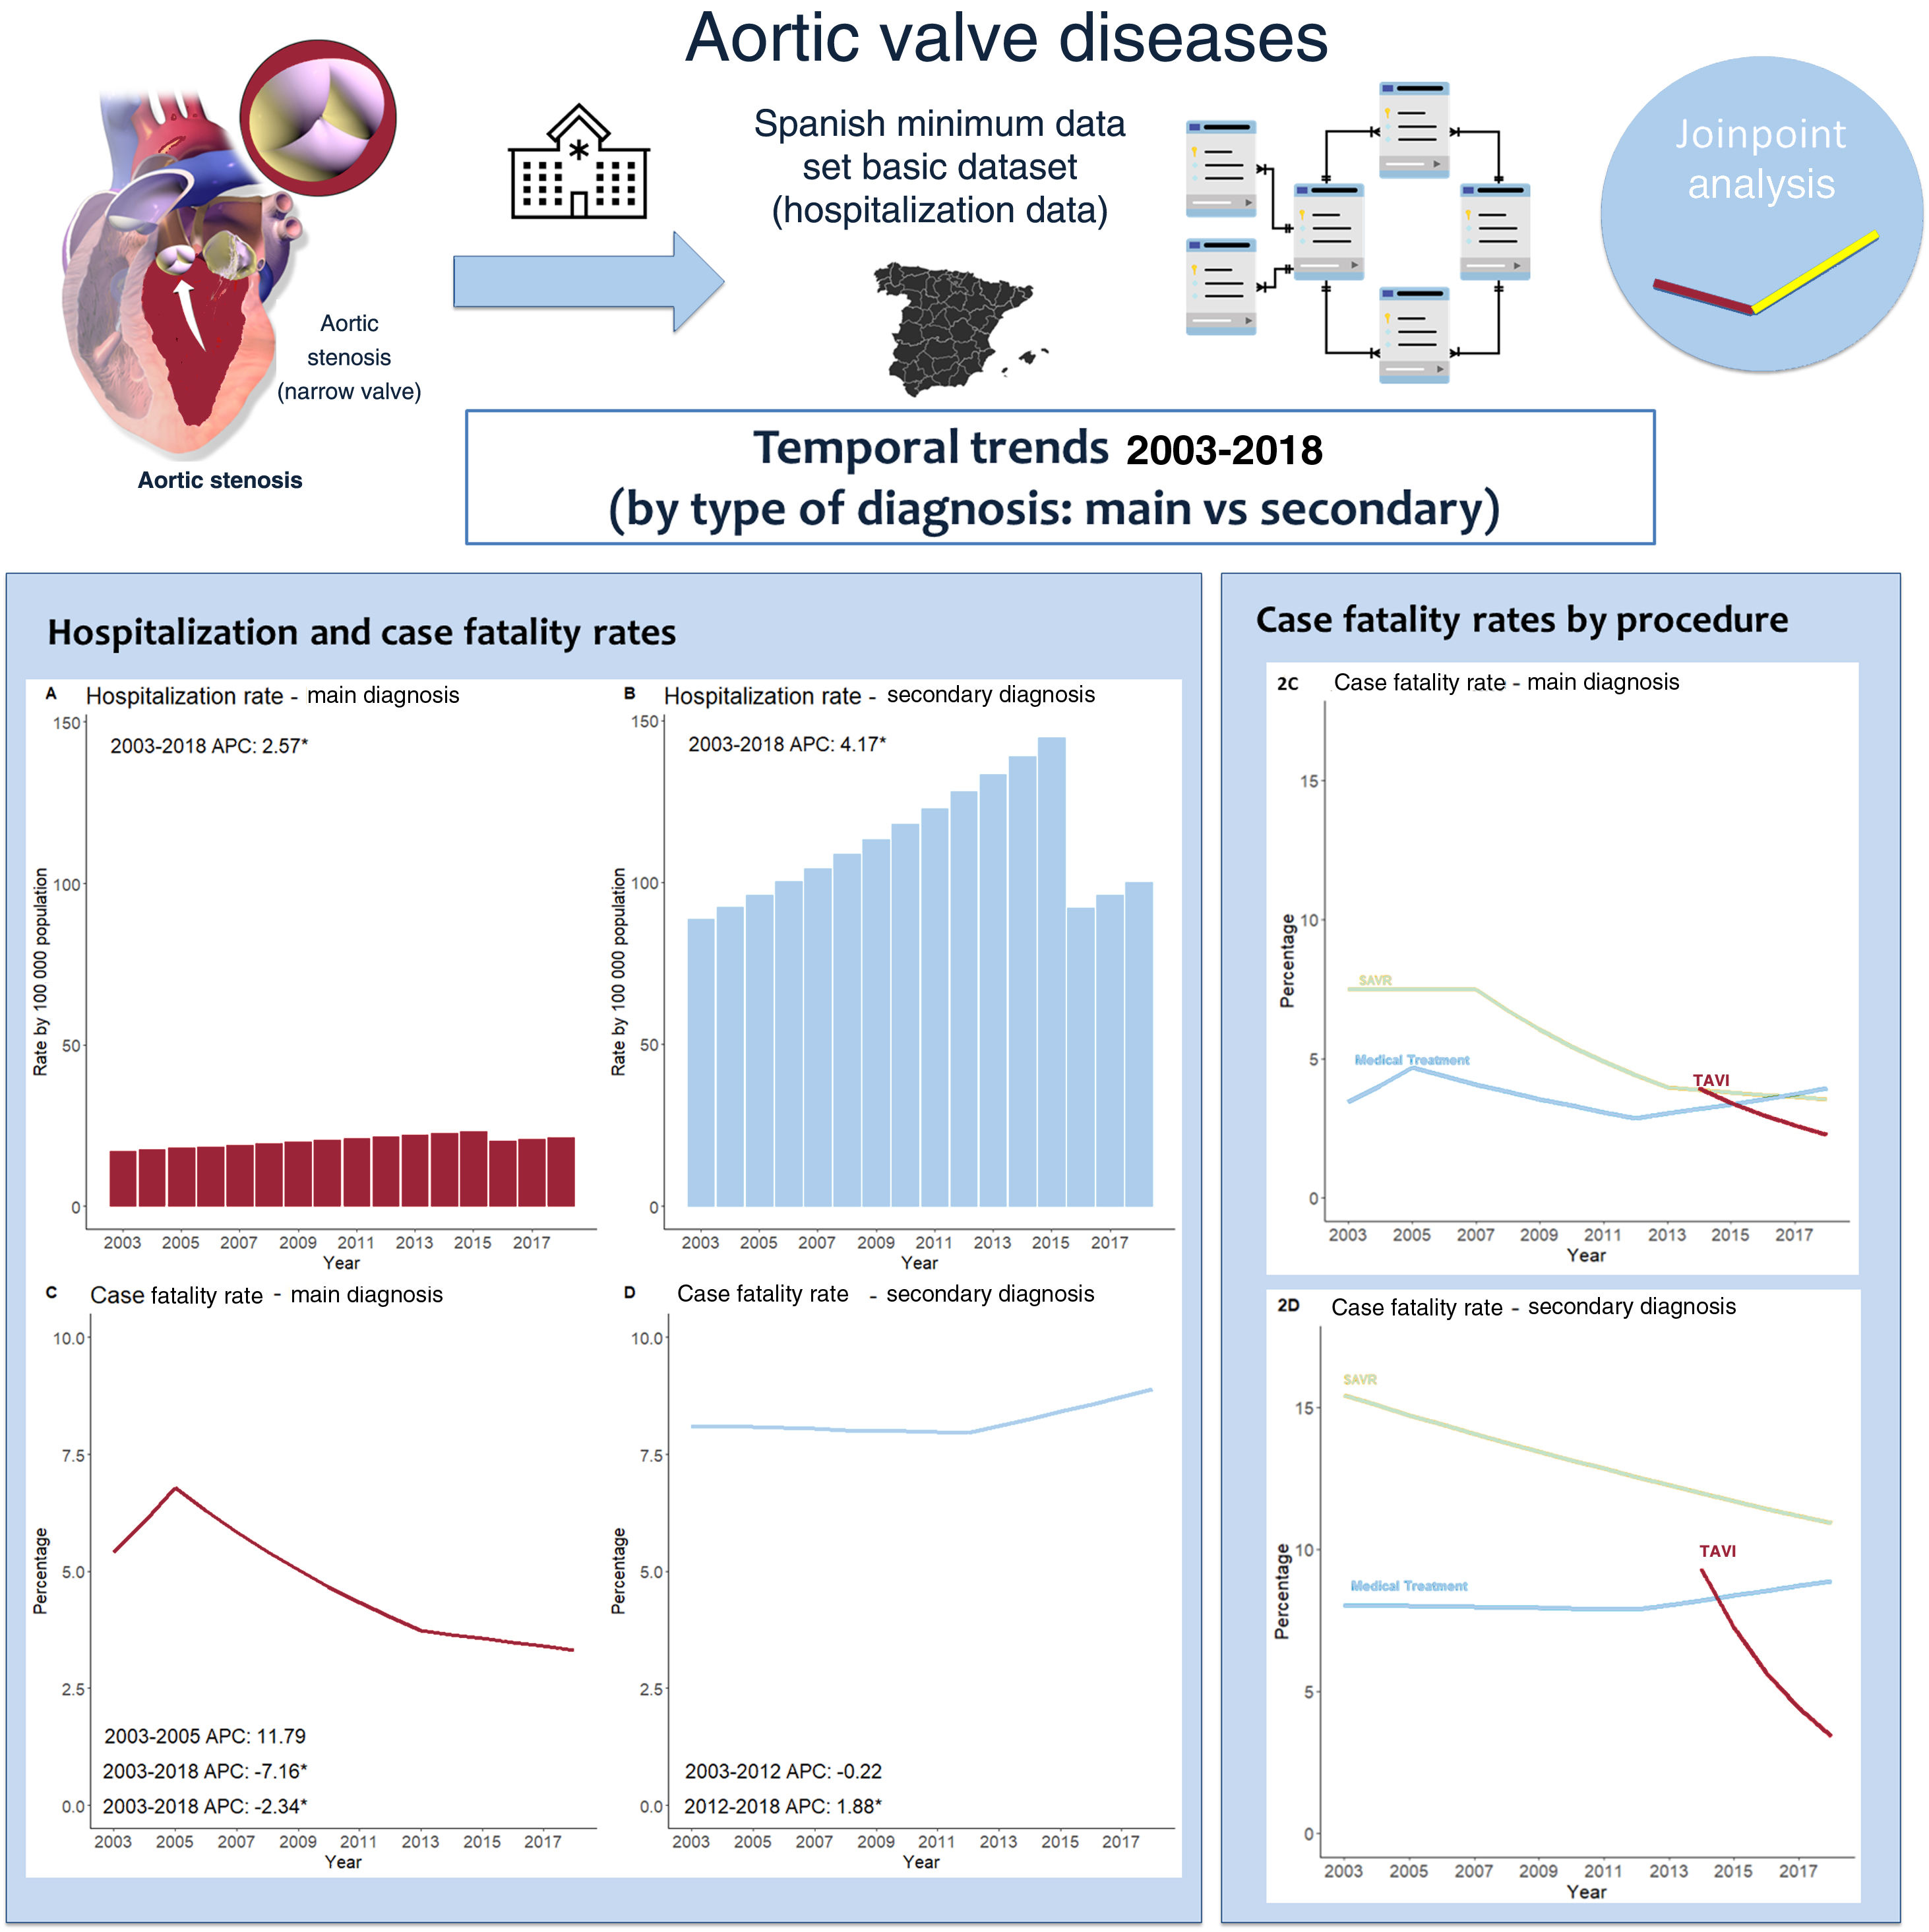
RESULTSHospitalizationsA total of 1 003 284 hospitalizations with a diagnosis of NRAVD were registered between 2003 and 2018. Of these, 163 150 were excluded (). NRAVD was a secondary diagnosis in most—716 115 (85.2%)—, and was the main diagnosis in 124 019 (14.8%). The total number of NRAVD hospitalizations increased from 32 957 in 2003 to 70 669 in 2018. The number of annual hospitalizations increased for total, main and secondary diagnoses (table 1). Total hospitalization rates increased from 103.6 per 100 000 in 2003 (95% confidence interval [95%CI], 102.5-104.7) to 166.4 in 2015 (95%CI, 165.2-167.6). After the change to ICD-10 codes, there was a drop in the rate to 108.0 in 2016 (95%CI, 107.0-109.0) with no change in the upward trend, reaching 121.1 hospitalizations per 100 000 in 2018 (95%CI, 120.1-122.1). The IRR for all hospitalizations during the whole period was 1.014 (95%CI, 0.998-1.029; P=.090). No changes in the direction of the trend for hospitalization rates were observed during the study period (APC, 3.9; 95%CI, 2.3-5.6; P <.05). Similar trends were observed for the groups with main and secondary diagnoses (figure 1).
Trends in nonrheumatic aortic valve disease, 2003 to 2018. Hospitalizations, baseline characteristics and procedures
| 2003-2004 | 2005-2006 | 2007-2008 | 2009-2010 | 2011-2012 | 2013-2014 | 2015-2016 | 2017-2018 | P for trend | |
|---|---|---|---|---|---|---|---|---|---|
| Hospitalizations | |||||||||
| Total | 69 213 | 76 426 | 88 862 | 102 394 | 114 816 | 125 937 | 126 301 | 136 185 | |
| Main diagnosis | 12 064(17.4) | 12 229(16.0) | 13 246(14.9) | 15 000(14.7) | 16 360(14.3) | 17 696(14.1) | 18 425(14.6) | 18 999(14.0) | <.001 |
| Secondary diagnosis | 57 149(82.6) | 64 197(84.0) | 75 616(85.1) | 87 394(85.3) | 98 456(85.7) | 108 241(85.9) | 107 876(85.4) | 117 186(86.0) | <.001 |
| Baseline characteristics | |||||||||
| Age in years | 74.8±10.7 | 75.5±10.5 | 76.5±10.3 | 77.2±10.3 | 78.0±10.0 | 78.5±10.1 | 79.2±9.9 | 79.7±939 | <.001 |
| Age> 80years | 21 317(30.8) | 26 008(34.0) | 34 045(38.3) | 42 892(41.9) | 53 025(46.2) | 62 040(49.3) | 66 822(52.9) | 75 942(55.8) | <.001 |
| Women | 34 202(49.4) | 37 841(49.5) | 44 490(50.1) | 51 014(49.8) | 57 680(50.2) | 63 049(50.1) | 62 906(49.8) | 67 552(49.6) | .447 |
| Length of stay | 11.2±11.2 | 11.0±11.0 | 11.0±11.1 | 10.5±10.5 | 10.0±9.9 | 9.6±9.5 | 9.5±9.1 | 9.4±9.2 | <.001 |
| Charlson comorbidity index | 1.42±1.53 | 1.48±1.56 | 1.59±1.63 | 1.77±1.73 | 1.87±1.77 | 1.94±1.81 | 2.06±1.86 | 2.33±2.00 | <.001 |
| Comorbidities | |||||||||
| Hypertension | 30 112(43.5) | 34 569(45.2) | 41 222(46.4) | 47 872(46.8) | 54 361(47.3) | 59 263(47.1) | 59 178(46.9) | 58 56843.0 | .128 |
| Diabetes mellitus | 16 931(24.5) | 20 053(26.2) | 24 822(27.9) | 29 694(29.0) | 34 464(30.0) | 38 354(30.5) | 40 777(32.3) | 48 487(35.6) | <.001 |
| Ischemic heart disease | 14 819(21.4) | 16 595(21.7) | 19 907(22.4) | 22 423(21.9) | 25 743(22.4) | 28 374(22.5) | 27 654(21.9) | 29 275(21.5) | .978 |
| Angina pectoris | 3381(4.9) | 3169(4.1) | 3488(3.9) | 3318(3.2) | 3427(3.0) | 3619(2.9) | 3865(3.1) | 4055(3.0) | <.001 |
| Heart failure | 19 291(27.9) | 23 818(31.2) | 29 606(33.3) | 35 925(35.1) | 42 096(36.7) | 47 380(37.6) | 48 696(38.6) | 53 788(39.5) | <.001 |
| Cardiogenic shock | 496(0.72) | 597(0.78) | 674(0.76) | 778(0.76) | 788(0.69) | 847(0.67) | 757(0.60) | 790(0.58) | <.001 |
| Rhythm disturbances | 22 852(33.0) | 26 515(34.7) | 32 253(36.3) | 38 046(37.2) | 43 850(38.2) | 49 898(39.6) | 51 003(40.4) | 56 815(41.7) | <.001 |
| Therapeutic procedures | |||||||||
| Aortic valve replacement (AVR) | 7294(10.5) | 7894(10.3) | 8511(9.6) | 9686(9.5) | 10 700(9.3) | 11 941(9.5) | 12 854(10.2) | 13 784(10.1) | .283 |
| Surgical (SAVR) | 7294(10.5) | 7894(10.3) | 8511(9.6) | 9686(9.5) | 10 700(9.3) | 11 212(8.9) | 10 220(8.1) | 9048(6.6) | <.001 |
| Transcatheter (TAVI) | - | - | - | - | - | 734(0.6) | 2661(2.1) | 4743(3.5) | <.001 |
| Balloon aortic valvuloplasty | 25(0.04) | 15(0.02) | 141(0.16) | 746(0.73) | 1076(0.94) | 758(0.60) | 221(0.17) | 37(0.03) | .2659 |
AVR, aortic valve replacement; SAVR, surgical aortic valve replacement; TAVI, transcatheter aortic valve implantation.
The data are presented as No. (%) of mean±standard deviation.
 and case fatality rates (bottom) among patients with nonrheumatic aortic valve disease as a main diagnosis (left) and secondary diagnosis (right) by joinpoint analysis. A and B: No inflection points in the jump model. C: Two inflection (2005 and 2013). D: One inflection (2012). Annual percent changes (APC) are shown in each graph for each stable time period (those within 2 inflection points).")
Temporal trends in hospitalization rates (top) and case fatality rates (bottom) among patients with nonrheumatic aortic valve disease as a main diagnosis (left) and secondary diagnosis (right) by joinpoint analysis. A and B: No inflection points in the jump model. C: Two inflection (2005 and 2013). D: One inflection (2012). Annual percent changes (APC) are shown in each graph for each stable time period (those within 2 inflection points).
Demographic and clinical characteristics of the study population are shown in table 1. The comorbidities analyzed are shown in . Age and comorbidities increased over time in both groups with no change in the proportion of women and men. Only the proportion of cases with cardiogenic shock decreased. The mean age, proportion of women and comorbidities were higher in the secondary diagnosis group compared with the main diagnosis group ().
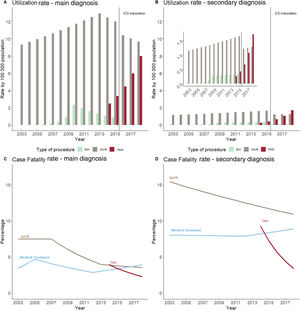
ProceduresA total of 82 664 AVR procedures were registered, increasing from 3506 in year 2003 to 7118 in 2018. The standardized AVR rate increased from 10.5 procedures per 100 000 population (95%CI, 10.1-10.8) in 2003 to 17.1 (95%CI, 16.7-17.4) in 2018 (IRR, 1.033, 95%CI, 1.030-1.037; P <.001). This increase was similar for both the main and secondary diagnosis groups (table 2) and was stable throughout the observation time (2003-2018 APC, 3.7; 95%CI, 3.3-4.1; P <.05). While the main diagnosis group showed a similar trend (APC, 3.7, 95%CI, 3.3-4.1; P <.05), the joinpoint analysis showed an increase in the slope of AVR utilization in the secondary diagnosis group after 2015 (APC from 2003-2016, 3.8; 95%CI, 3.3-4.2, P <.05; APC vs 15.5; 95%CI, 6.6-25.0; P <.05 from 2016-2018) (figure 2A,B).
Incidence rate ratios for hospitalization, use of therapies and case fatality rates in nonrheumatic aortic diseases. Valve trends 2003-2018
| Main Diagnosis | P | Secondary Diagnosis | P | |
|---|---|---|---|---|
| Hospitalizations | 1.016(1.010-1.023) | <.001 | 1.013(0.995-1.031) | .145 |
| Use of therapies | ||||
| Medical treatment | 1.002(0.997-1.007) | .477 | 1.029(1.021-1.037) | <.001 |
| Aortic valve replacement | 1.034(1.030-1.037) | <.001 | 1.033(1.026-1.039) | <.001 |
| SAVR | 1.008(0.996-1.020) | .213 | 1.010(0.998-1.022) | .103 |
| TAVI | 1.327(1.287-1.368) | <.001 | 1.536(1.422-1.659) | <.001 |
| Balloon valvuloplasty | 1.045(0.942-1.158) | .406 | 1.067(0.978-1.163) | .146 |
| Case fatality rates | ||||
| All patients | ||||
| Crude | 0.968(0.959-0.976) | <.001 | 1.019(1.016-1.022) | <.001 |
| Adjusted | 0.953(0.942-0.964) | <.001 | 1.005(1.002-1.009) | .002 |
| Medically treated | ||||
| Crude | 1.020(1.006-1.033) | .046 | 1.020(1.017-1.023) | <.001 |
| Adjusted | 0.987(0.972-1.003) | .118 | 1.006(1.002-1.010) | .001 |
| Aortic valve replacement | ||||
| Crude | 0.942(0.932-0.951) | <.001 | 0.969(0.960-0.978) | <.001 |
| Adjusted | 0.930(0.921-0.940) | <.001 | 0.968(0.960-0.976) | <.001 |
| SARV | ||||
| Crude | 0.946(0.938-0.955) | <.001 | 0.979(0.972-0.986) | <.001 |
| Adjusted | 0.940(0.930-0.949) | <.001 | 0.978(0.971-0.984) | <.001 |
| TAVI | ||||
| Crude | 0.861(0.782-0.948) | .002 | 0.741(0.655-0.840) | <.001 |
| Adjusted | 0.862(0.782-0.951) | .003 | 0.767(0.676-0.870) | <.001 |
| Balloon valvuloplasty | ||||
| Crude | 1.008(0.875-1.162) | .909 | 0.991(0.884-1.111) | .877 |
| Adjusted | 1.005(.870-1.160) | .950 | 1.059(0.988-1.135) | .106 |
AVR, aortic valve replacement; SAVR, surgical aortic valve replacement; TAVI, transcatheter aortic valve implantation.
 and case fatality rates (bottom) among patients with nonrheumatic aortic valve disease as a main (left) and secondary diagnosis (right). A: Inflection points for SAVR and balloon aortic valvuloplasty (BAV) but not for transcatheter aortic valve implantation (TAVI). B: No inflection points for surgical aortic valve replacement (SAVR) or TAVI. C and D: A decrease in case fatality rate in SAVR. There are inflection points for SARV and balloon aortic valvuloplasty (BAV).")
Temporal trends in procedure utilization rates (top) and case fatality rates (bottom) among patients with nonrheumatic aortic valve disease as a main (left) and secondary diagnosis (right). A: Inflection points for SAVR and balloon aortic valvuloplasty (BAV) but not for transcatheter aortic valve implantation (TAVI). B: No inflection points for surgical aortic valve replacement (SAVR) or TAVI. C and D: A decrease in case fatality rate in SAVR. There are inflection points for SARV and balloon aortic valvuloplasty (BAV).
During the study period, 74 565 patients underwent SAVR (66 336 in the main diagnosis group, 89.0%) and 8138 TAVI (7361 in the main diagnosis group, 90.5%). The annual number of SAVR increased from 3506 in 2003 to 4431 in 2018, with a peak of 5682 procedures in 2013, the year prior to the introduction of TAVI. The SAVR utilization rate did not change significantly during the study period (from 10.5 procedures per 100 000 population; 95%CI, 10.1-10.8 in 2003 to 10.8; 95%CI, 10.4-11.1 in 2018; IRR, 1.008; 95%CI, 0.996-1.020; P=.201) (table 2). However, the joinpoint analysis showed a steady increase between 2003 and 2013 (APC, 3.3%; 95%CI, 2.6-4.0; P <.05), which reversed in 2013, inverting the annual utilization rate to −3.3% (95%CI, 1.3-5.1). A similar decrease in trends for SAVR utilization rates was observed when only patients with NRAVD as the main diagnosis were considered, while rates in patients with NRAVD as a secondary diagnosis increased consistently from 2003 to 2018 (figure 2A,B).
The absolute number of registered TAVI procedures increased from 734 in 2014 to 2690 in 2018, also increasing the proportion within all AVRs (from 11.7% in 2014 to 37.8% in 2018). TAVI utilization rates increased from 2.5 procedures per 100 000 population in 2014 (95%CI, 2.3-2.7) to 8.7 in 2018 (95%CI, 8.4-9.0), with an IRR of 1.341 (95%CI, 1.302-1.389; P <.001), which was similar in the main and secondary diagnosis groups (table 2). No joinpoints were detected in the TAVI utilization rate trend (APC, 35.8; 95%CI, 28.0-44.0; P <.05).
The absolute number of registered BAV procedures increased from 9 in 2006 to 577 in 2010, and its utilization rate increased from 0.03 procedures per 100 000 population to 1.53 in the same period (APC, 196; 95%CI, 20.2-629; P <.05), with an annual 21.2% (95%CI, 4.1%-35.3%; P <.05) drop since year 2010 onwards.
Clinical outcomesThe mean length of stay in the whole group decreased from 11.3±11.4 days in 2003 to 9.4±9.5 in 2018 (P <.001), with a fall in all groups, except for patients treated with TAVI for NRAVD as a secondary diagnosis (). For the total study population, the cCFR increased from 6.7% in 2003 (95%CI, 6.5-7.0) to 8.7% in 2018 (95%CI, 8.5-8.9), with an IRR of 1.015 (95%CI, 1.012-1.018; P <.001). After age- and sex-standardization, no significant change was observed (7.6%; 95%CI, 7.3%-7.9% in 2003 and 8.0%; 95%CI, 7.8%-8.2% in 2018; IRR, 1.000; 95%CI, 0.997-1.004; P=.891). However, a 0.7% annual decrease in the sCFR was observed between 2003 and 2012 (95%CI, 0.0-1.3; P <.05), with a subsequent 1.3% increase (95%CI, 0.0-2.5; P <.05) until 2018. Opposite trends in CFR among the main and secondary diagnoses groups was evident both in crude and standardized CFR (table 2, figure 1C,D).
In patients undergoing AVR, the crude cCFR decreased by 5.3% annually (IRR, 0.948; 95%CI, 0.939-0.957), from 7.8% in 2003 (95%CI, 7.0-8.8) to 3.9% in 2018 (95%CI, 3.5-4.4). Age- and sex-adjusted sCFR decreased from 8.8% in 2003 (95%CI, 7.6-10.1) to 4.0% in 2018 (95%CI, 3.6-4.5), with a mean IRR of 0.935 (95%CI, 0.930-0.947; P <.001), which was more pronounced between 2006 and 2018 (APC, −7.2; 95%CI, −6.3 to −8.2; P <.05). Trends were different for the main diagnosis group (2006-2018 APC, −8.2; 95%CI, −7.3 to −9.1; P <.05) and the secondary diagnosis group (2003-2018 APC, −3.4; 95%CI, −2.2 to −4.5; P <.05) (figure 2C,D). The cCFR decreased for SAVR from 7.8% (95%CI, 7.0-8.8) in 2003 to 4.6% (95%CI, 4.0-5.3) in 2018 (IRR, 0.954, 95%CI, 0.946-0.962) and for TAVI from 4.9% in 2014 (95%CI, 3.6-6.7) to 2.8% in 2018 (95%CI, 2.2-3.5) (IRR, 0.855; 95%CI, 0.776-0.941; P=.001). sCFR for SAVR fell from 8.3% (95%CI, 7.3-9.3) to 3.7% (95%CI, 4.0-5.3) (IRR, 0.949, 95%CI, 0.940-0.957; P <.001), with a significant intensification in the percentage of decrease between 2008 and 2013 (APC, 9.6%; 95%CI, 4.9%-14.1%). The adjusted CFR for TAVI fell from 4.8% (95%CI, 3.3-6.4) to 2.8 (95%CI, 2.2-3.4) (IRR, 0.860, 95%CI, 0.781-0.946), with no inflection point in the trend. CFR trends by type of diagnosis group are shown in table 2 and figure 2C,D.
DISCUSSIONThis nationwide study, the first to address trends in hospitalization and management of patients with NRAVD as the main and secondary diagnosis and their clinical outcomes, shows a continuous and significant increase in hospital admissions among patients with a diagnosis of NRAVD over an 18-year period, essentially due to an increase in secondary diagnoses, which account for most cases. This is relevant because while cases with a main NRAVD diagnosis showed a clear improvement in the hospital fatality rate, this was not the case for patients with a secondary NRAVD diagnosis (figure 3).

The increase in NRAVD is consistent with that found in other developed countries,2,21,22 probably as a consequence of an increase in its active search and diagnosis by echocardiography, since the time when a less invasive therapeutic procedure, such as TAVI, became available and offered an opportunity to patients who would have been considered to be at prohibitive risk for SAVR.23,24
The time trends in the treatment of NRAVD—with AVR increasing steadily throughout the observation period, SAVR and BAV increasing in the first years with a later reduction in the former and the near abandonment of the latter, and TAVI rapidly increasing in the second half of the past decade—reflect the change in the clinical scenario of NRAVD management.25,26 The main driver of these changes has been TAVI, which started to become the only treatment for patients at extremely high surgical risk and continued as the preferred option for those at high surgical risk,27,28 with later evidence of the potential benefit in lower-risk patients. 24,25 Unfortunately, no comparison is possible for the years before 2014, when TAVI procedures were not included in ICD-9 codes. The use of BAV had a short increase between 2008 and 2014, despite little evidence to recommend its use.29,30
A key finding of our study is the increase in crude hospital case fatality rates, with no improvement in standardized rates for the whole population during the observation period. Between 2003 and 2012, a decrease in standardized CFR has been previously reported, as shown in previous literature,2 followed by a steady increase until 2018. At the population level, the initial reduction in CFR is comparable to those observed in other countries,31 although stable CFR trends related to increasing patient age also have been described.32 After the introduction of TAVI, a decrease in population mortality by aortic stenosis has been shown,33,34 but the increase observed in our study cannot be compared due to the absence of population-based studies of aortic stenosis in Spain. The divergence between crude and standardized CFR can probably be explained by the change in the age structure of the group and the population. These trends are essentially driven by the patients with a diagnosis of secondary NRAVD, most of whom were not treated for their valve disease. This is a population group with advanced age and severe comorbidity admitted for other clinical conditions, among which NRAVD may be a comorbidity and a risk factor for death rather than the main cause of death, although this speculation requires confirmation. However, when all other clinical situations were considered, there was an improvement in short-term results, both in patients with a main NRAVD diagnosis as well as in those with a secondary diagnosis who underwent SAVR or TAVI. In-hospital CFRs decreased among patients who underwent AVR, both for SAVR and TAVI. This improvement is consistent with the survival benefit previously reported with TAVI,4,35,36 and the reduction in the risk of surgical candidates.32,37 In contrast, CFR increased among medically treated patients, probably in relation to their baseline risk and the clinical condition leading to their hospitalization.
Main and secondary diagnosisOur study shows the importance of differentiating patients with NRAVD as the main or secondary diagnosis—that is, in those admitted for conditions not related to their valve disease—in epidemiological studies as these represent different clinical situations, patient risk profiles, and outcomes. While outcomes improved for patients with a main NRAVD diagnosis, probably related to an earlier diagnosis and the improvement in treatment—better results with surgery and the introduction of TAVI—, in patients with a secondary diagnosis, NRAVD probably contributed more as a comorbidity and a poor prognostic factor.38,39 Interestingly, the improvement in CFR among patients undergoing AVR, both SAVR and TAVI, was observed regardless of whether it was performed in patients with a main or secondary diagnosis. Previous studies reported improvements in survival for SAVR and TAVI in patients with a main diagnosis of NRAVD2 or a main and secondary diagnosis together24,26 but no stratified analysis by type of diagnosis has been published so far. As an increase in NRAVD diagnosis secondary to changes in the population2,22,40 is expected in the coming years, specific studies addressing the management and outcomes of patients with NRAVD as the cause of admission or comorbidity will be needed.
This work has clinical implications with an impact on daily practice. Patients with NRAVD as a secondary diagnosis would benefit less from specific treatment for their aortic valve disease, since we have observed a worse prognosis related to their comorbidities, which may determine their outcome in more decisively than the aortic valve disease itself. Therefore, in patients with a secondary diagnosis of NRAVD, the benefit of valve replacement is more controversial. Future studies are needed to improve the selection of candidates for AVR, including TAVI.
LimitationsThe national hospital registry covers more than 90% of hospitalizations in public centers in Spain. However, the inherent limitations of the use of secondary administrative databases must be acknowledged, including different bias risks. Due to the use of anonymized data, a data quality analysis could not be performed by the researchers. Outcomes of patients with a discharge destination other than home or exitus are not available, so they have been eliminated from the analysis.
From 2003 to 2015, diagnoses were coded according to the ICD-9, which has no specific code for aortic stenosis. Instead, NRAVD codes have been used as a proxy, as it accounts for the large majority of patients with NRAVD.21 The switch to ICD-10 coding by health care facilities has led to undercodification in Spain, mainly in 2016.41 The observed bump in the time series, deeper for NRAVD secondary diagnosis, may be explained by this fact. To attenuate this artefact, we used the joinpoint jump model, which allowed us to minimize the effect of this sharp fall and allow an evaluation of the whole trend. Finally, results stratified by NRAVD severity could not be determined since no echocardiographic records are included in the national hospital registry database.
CONCLUSIONSHospitalization rates in patients with a diagnosis of NRAVD increased in Spain between 2003 and 2018, mainly driven by the increase of patients with a secondary NRAVD diagnosis. While age and comorbidity increased over time, standardized hospital CFR remained unchanged. Different trends in outcomes were observed among patients with a main or secondary NRAVD diagnosis but fatality rates fell in all patients treated with SAVR or TAVI. More research addressing the management and outcomes of patients with NRAVD as a comorbidity is warranted.
FUNDINGCNIC is supported by the Ministerio de Ciencia, Innovación y Universidades (MICINN) and the Pro CNIC Foundation and is a Severo Ochoa Center of Excellence (SEV-2015-0505). L. Vicent is supported by a Río Hortega grant from the Instituto de Salud Carlos III (CM20/00104). G. Moreno is supported by a predoctoral grant by the Spanish Ministry of Education (FPU18/03606). The funders had no role in study designs, data collection and analysis, decision to publish, or preparation of the manuscript.
AUTHORS’ CONTRIBUTIONSH. Bueno, F.J. Elola, D. Martín de la Mota Sanz and N. Rosillo were involved in the initial design of the study. Analyses were performed by D. Martín de la Mota Sanz and N. Rosillo. All authors aided in interpreting the results and have made a significant contribution to the final manuscript.
CONFLICTS OF INTERESTNone of the authors has a conflict of interest related to this particular study. Unrelated to this study, H. Bueno receives research funding from the Instituto de Salud Carlos III, Spain (PIE16/00021 & PI17/01799), Sociedad Española de Cardiología, Astra-Zeneca, Bayer, BMS and Novartis; has received consulting fees from Astra-Zeneca, Bayer, BMS-Pfizer, and Novartis; and speaking fees or support for attending scientific meetings from Amgen, Astra-Zeneca, Bayer, BMS-Pfizer, Novartis, and MEDSCAPE-the heart.org.
- •
SAVR and TAVI have improved the prognosis and survival of patients with nonrheumatic aortic valve disease (NRAVD).
- •
NRAVD, especially aortic stenosis, is of increasing importance due to the aging population.
- •
The use of TAVI has been successfully extended to patients previously considered inoperable due to high surgical risk.
- •
This is the first large-scale comparison of the trends in hospital management and outcomes of NRAVD by the type of diagnosis (main vs secondary).
- •
NRAVD as a secondary diagnosis is highly prevalent, with an increasing frequency over time and a very poor prognosis that has not improved in the last few years.
- •
Hospital fatality rates have been improving in patients treated with any aortic replacement procedure, especially among patients with a main NRAVD diagnosis.
Data for this study come from the minimum data set, provided by the Area of Information and Care Statistics (Subdirección General de Información Sanitaria, Spanish Ministry of Health).
Supplementary data associated with this article can be found in the online version, at https://doi.org/10.1016/j.rec.2022.06.005