Troponins are specific biomarkers of myocardial injury and are implicated in the diagnosis and prognosis of patients with acute coronary syndrome. Our purpose was to determine the clinical characteristics and prognosis of patients with troponin elevation who are not diagnosed with acute coronary syndrome.
MethodsA total of 1032 patients with an emergency room troponin measurement were studied retrospectively, dividing them into 3 groups: 681 patients with no troponin elevation and without acute coronary syndrome, 139 with acute coronary syndrome, and 212 with troponin elevation and not diagnosed with acute coronary syndrome. The clinical characteristics and in-hospital and 12-month mortality of these 3 groups were compared.
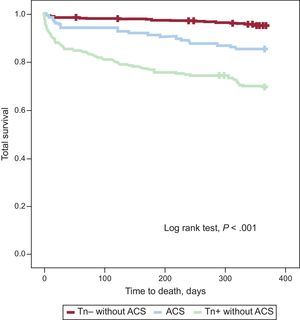
ResultsPatients with troponin elevation not diagnosed with acute coronary syndrome were older and had greater comorbidity than patients with acute coronary syndrome or no troponin elevation. The 12-month mortality was 30.2%, compared with 15.1% and 4.7% in the other groups (log rank test, P<.001). In the Cox logistic regression model adjusted for confounding variables, patients with troponin elevation and no diagnosis of acute coronary syndrome had higher mortality compared with patients with negative troponin without acute coronary syndrome (hazard ratio=3.99; 95% confidence interval, 2.36-6.75; P<.001) and similar prognosis as patients with acute coronary syndrome.
ConclusionsTroponin elevation is an important predictor of mortality, regardless of the patient's final diagnosis.
Keywords
Troponins are specific markers of myocardial injury and have been used in clinical practice for more than 20 years. They were initially a marker of “unstable angina”1; later they played a key role in stratification and in guiding the therapy of patients with acute coronary syndrome (ACS).2,3 The markers were subsequently included in the definition of myocardial infarction,4 and are finally becoming part of a fundamental diagnostic tool in emergency rooms5,6 as well as an important prognostic marker even in asymptomatic patients.7
The widespread use of troponin assay in emergency rooms is a significant diagnostic challenge when levels of the biomarker are abnormal in patients with symptoms who could have ischemia or ischemia equivalents, but who have concomitant diseases in which troponin elevation has been described.8–10 In order to establish that troponin elevation is due to ACS, it has been proposed that percent increases or absolute changes11 be identified through serial measurements.12 In clinical practice, ACS is usually ruled out in patients with troponin elevation based on the medical history, electrocardiogram (ECG), overall patient context, and other additional examinations performed during the emergency room or hospital stay. Most recent reviews stress the need for a clearer understanding of the daily clinical situations that raise these diagnostic issues.12
The purpose of this study is to determine the percentage of patients seen in an emergency room who had troponin elevation but are not diagnosed with ACS, to characterize this population, and to learn their in-hospital and 1-year prognosis.
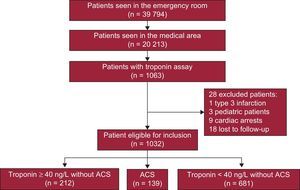
METHODSStudy SampleAll consecutive patients who came to the medical emergency room at a teaching hospital between 1 January 2012 and 30 June 2012 and had at least 1 troponin determination were retrospectively included (Figure 1). Our hospital has a written protocol agreed with the emergency room to establish that all patients with nontraumatic chest pain will have an ECG on arrival, plus troponin testing at baseline and 8h after onset of pain.13 When the pain occurs 6h to 8h before arrival to the emergency room, the troponin assay is not repeated if the first was negative. In practice, the protocol is specifically designed for patients with chest pain (initial ECG and 1 or 2 troponin assays) and is also applied to patients with other symptoms (eg, dyspnea) that, in the emergency room physician's opinion, require a differential diagnosis with an ACS.

Patients were identified from the lists of emergency assays performed by the facility's laboratory. The number of troponin measurements and the maximum value detected were quantitated for each patient. The sample was composed of 1063 patients, 31 of whom were excluded from the analysis: 3 patients due to pediatric age, 9 due to cardiac arrest, 1 due to type 3 myocardial infarction, and another 18 because they resided outside our direct area of reference. The final study cohort was 1032 patients, with no losses to follow-up. These patients were divided into 3 groups: 681 patients with negative troponin and no ACS diagnosis, 139 patients diagnosed with ACS (122 patients with myocardial infarction and 17 with unstable angina), and 212 patients with positive troponin and no ACS diagnosis. In the patients with ACS, myocardial infarction was diagnosed by consensus among 2 or more cardiologists based on clinical and electrocardiographic evidence and at least 1 troponin assay above the maximum reference level; unstable angina was diagnosed by clinical symptoms and evidence of ischemia (transient ST-segment changes in the ECG, positive stress test, or significant lesions on coronary angiography) in the absence of troponin elevation. The local ethics committee gave approval for the project.
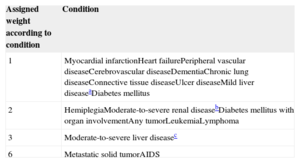
Study VariablesThe medical records were reviewed to collect demographic variables, medical histories, including all background assessed in the Charlson index (Table 1), key data in the physical examination on arrival to the emergency room, ECG findings, and initial laboratory workup results. The glomerular filtration rate was calculated by the Modification of Diet in Renal Disease-4 formula. In all patients, the main cardiologic examinations (echocardiogram, stress test, and cardiac catheterization) were analyzed. The main diagnoses were collected regardless of whether the patient was admitted or discharged from the emergency room. In-hospital mortality and readmissions for myocardial infarction or heart failure and total 1-year mortality were analyzed.
Charlson Comorbidity Index
| Assigned weight according to condition | Condition |
|---|---|
| 1 | Myocardial infarctionHeart failurePeripheral vascular diseaseCerebrovascular diseaseDementiaChronic lung diseaseConnective tissue diseaseUlcer diseaseMild liver diseaseaDiabetes mellitus |
| 2 | HemiplegiaModerate-to-severe renal diseasebDiabetes mellitus with organ involvementAny tumorLeukemiaLymphoma |
| 3 | Moderate-to-severe liver diseasec |
| 6 | Metastatic solid tumorAIDS |
The Charlson score is the sum of the assigned weights that each patient has.
Troponin I was determined using the same immunoassay (Troponin I-Ultra, Siemens, Advia Centaur) at the same laboratory. The upper and lower detection limits were those established by the manufacturer, 6 ng/L and 5000 ng/L, respectively. Measurements below the detectable limit were assigned a value of 0, and those above were assigned a value of 5000 ng/L. Troponin I reactions were considered positive if above the reference limit (> 39 ng/L) of the emergency room laboratory; this value shows a coefficient of variation ≤ 10% in the 99th percentile of a reference control group.
Statistical AnalysisAll quantitative variables were described as the mean (standard deviation), and all categorical variables were expressed as frequency and percentage. The association between quantitative and categorical variables was analyzed by the Student t test or the analysis of variance, depending on whether there were 2 or more categories. The association between categorical variables was studied by analyzing the contingency tables and the χ2 test. In both cases, tests were performed a posteriori to identify any groups with nondiffering means or proportions by the Bonferroni technique. The survival analysis of the 3 diagnostic groups was performed using the Kaplan-Meier method and compared by the log-rank test. The association between quantitative and qualitative variables with survival was analyzed by univariate and multivariate Cox proportional hazard models. All significant variables in the univariate analysis, plus age and sex, were included in the adjusted multivariate analysis. Backward stepwise elimination was used (P<.05 for selection; P>.1 for removal). The results are expressed as hazard ratio (HR) with 95% confidence intervals (95% CI). The statistical significance level was set at a P<.05. All statistical analyses were performed using SPSS 15.0 for Windows (SPSS, Inc.; Chicago, Illinois, United States).
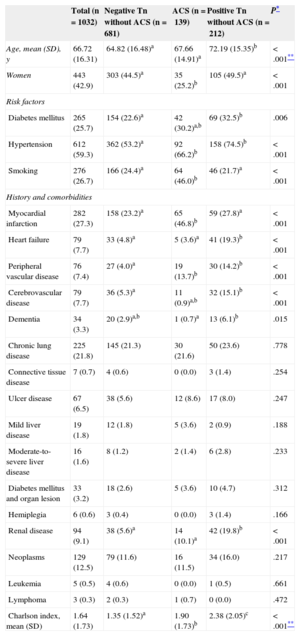
RESULTSBaseline Characteristics and Clinical PresentationThe main characteristics of the patients are listed in Table 2. Patients with troponin elevation but no ACS were generally older and had greater comorbidity and a significantly worse Charlson index than patients diagnosed with ACS or without troponin elevation.
Patients, Risk Factors, History, and Comorbidities According to Diagnostic Groups
| Total (n=1032) | Negative Tn without ACS (n=681) | ACS (n=139) | Positive Tn without ACS (n=212) | P* | |
|---|---|---|---|---|---|
| Age, mean (SD), y | 66.72 (16.31) | 64.82 (16.48)a | 67.66 (14.91)a | 72.19 (15.35)b | <.001** |
| Women | 443 (42.9) | 303 (44.5)a | 35 (25.2)b | 105 (49.5)a | <.001 |
| Risk factors | |||||
| Diabetes mellitus | 265 (25.7) | 154 (22.6)a | 42 (30.2)a,b | 69 (32.5)b | .006 |
| Hypertension | 612 (59.3) | 362 (53.2)a | 92 (66.2)b | 158 (74.5)b | <.001 |
| Smoking | 276 (26.7) | 166 (24.4)a | 64 (46.0)b | 46 (21.7)a | <.001 |
| History and comorbidities | |||||
| Myocardial infarction | 282 (27.3) | 158 (23.2)a | 65 (46.8)b | 59 (27.8)a | <.001 |
| Heart failure | 79 (7.7) | 33 (4.8)a | 5 (3.6)a | 41 (19.3)b | <.001 |
| Peripheral vascular disease | 76 (7.4) | 27 (4.0)a | 19 (13.7)b | 30 (14.2)b | <.001 |
| Cerebrovascular disease | 79 (7.7) | 36 (5.3)a | 11 (0.9)a,b | 32 (15.1)b | <.001 |
| Dementia | 34 (3.3) | 20 (2.9)a,b | 1 (0.7)a | 13 (6.1)b | .015 |
| Chronic lung disease | 225 (21.8) | 145 (21.3) | 30 (21.6) | 50 (23.6) | .778 |
| Connective tissue disease | 7 (0.7) | 4 (0.6) | 0 (0.0) | 3 (1.4) | .254 |
| Ulcer disease | 67 (6.5) | 38 (5.6) | 12 (8.6) | 17 (8.0) | .247 |
| Mild liver disease | 19 (1.8) | 12 (1.8) | 5 (3.6) | 2 (0.9) | .188 |
| Moderate-to-severe liver disease | 16 (1.6) | 8 (1.2) | 2 (1.4) | 6 (2.8) | .233 |
| Diabetes mellitus and organ lesion | 33 (3.2) | 18 (2.6) | 5 (3.6) | 10 (4.7) | .312 |
| Hemiplegia | 6 (0.6) | 3 (0.4) | 0 (0.0) | 3 (1.4) | .166 |
| Renal disease | 94 (9.1) | 38 (5.6)a | 14 (10.1)a | 42 (19.8)b | <.001 |
| Neoplasms | 129 (12.5) | 79 (11.6) | 16 (11.5) | 34 (16.0) | .217 |
| Leukemia | 5 (0.5) | 4 (0.6) | 0 (0.0) | 1 (0.5) | .661 |
| Lymphoma | 3 (0.3) | 2 (0.3) | 1 (0.7) | 0 (0.0) | .472 |
| Charlson index, mean (SD) | 1.64 (1.73) | 1.35 (1.52)a | 1.90 (1.73)b | 2.38 (2.05)c | <.001** |
ACS, acute coronary syndrome; SD, standard deviation; Tn, troponin.
Data are expressed as No. (%) or mean (standard deviation).
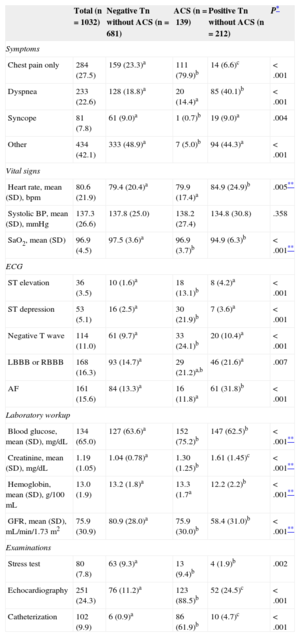
The main symptoms used to request troponin assays and the basic findings from physical examinations, ECGs, and laboratory workups in the emergency room are shown in Table 3. Patients with positive troponin not diagnosed with ACS were more likely to present with dyspnea and less likely to present with chest pain as the initial clinical manifestation. Moreover, their hemodynamic status in the emergency room was significantly worse because of a greater tendency to tachycardia and hypoxemia and the ECGs were less likely to show abnormalities suggestive of ischemia (ST elevation or depression, negative T waves) and more likely to reveal interventricular conduction and atrial fibrillation. The laboratory results showed worse blood glucose and creatinine levels, as well as a lower hemoglobin value.
Symptoms, Vital Signs, Electrocardiogram, Initial Laboratory Workup, and Basic Examinations According to Diagnostic Group
| Total (n=1032) | Negative Tn without ACS (n=681) | ACS (n=139) | Positive Tn without ACS (n=212) | P* | |
|---|---|---|---|---|---|
| Symptoms | |||||
| Chest pain only | 284 (27.5) | 159 (23.3)a | 111 (79.9)b | 14 (6.6)c | <.001 |
| Dyspnea | 233 (22.6) | 128 (18.8)a | 20 (14.4)a | 85 (40.1)b | <.001 |
| Syncope | 81 (7.8) | 61 (9.0)a | 1 (0.7)b | 19 (9.0)a | .004 |
| Other | 434 (42.1) | 333 (48.9)a | 7 (5.0)b | 94 (44.3)a | <.001 |
| Vital signs | |||||
| Heart rate, mean (SD), bpm | 80.6 (21.9) | 79.4 (20.4)a | 79.9 (17.4)a | 84.9 (24.9)b | .005** |
| Systolic BP, mean (SD), mmHg | 137.3 (26.6) | 137.8 (25.0) | 138.2 (27.4) | 134.8 (30.8) | .358 |
| SaO2, mean (SD) | 96.9 (4.5) | 97.5 (3.6)a | 96.9 (3.7)b | 94.9 (6.3)b | <.001** |
| ECG | |||||
| ST elevation | 36 (3.5) | 10 (1.6)a | 18 (13.1)b | 8 (4.2)a | <.001 |
| ST depression | 53 (5.1) | 16 (2.5)a | 30 (21.9)b | 7 (3.6)a | <.001 |
| Negative T wave | 114 (11.0) | 61 (9.7)a | 33 (24.1)b | 20 (10.4)a | <.001 |
| LBBB or RBBB | 168 (16.3) | 93 (14.7)a | 29 (21.2)a,b | 46 (21.6)a | .007 |
| AF | 161 (15.6) | 84 (13.3)a | 16 (11.8)a | 61 (31.8)b | <.001 |
| Laboratory workup | |||||
| Blood glucose, mean (SD), mg/dL | 134 (65.0) | 127 (63.6)a | 152 (75.2)b | 147 (62.5)b | <.001** |
| Creatinine, mean (SD), mg/dL | 1.19 (1.05) | 1.04 (0.78)a | 1.30 (1.25)b | 1.61 (1.45)c | <.001** |
| Hemoglobin, mean (SD), g/100 mL | 13.0 (1.9) | 13.2 (1.8)a | 13.3 (1.7a | 12.2 (2.2)b | <.001** |
| GFR, mean (SD), mL/min/1.73 m2 | 75.9 (30.9) | 80.9 (28.0)a | 75.9 (30.0)b | 58.4 (31.0)b | <.001** |
| Examinations | |||||
| Stress test | 80 (7.8) | 63 (9.3)a | 13 (9.4)b | 4 (1.9)b | .002 |
| Echocardiography | 251 (24.3) | 76 (11.2)a | 123 (88.5)b | 52 (24.5)c | <.001 |
| Catheterization | 102 (9.9) | 6 (0.9)a | 86 (61.9)b | 10 (4.7)c | <.001 |
ACS, acute coronary syndrome; AF, atrial fibrillation; BP, blood pressure; ECG, electrocardiogram; GFR, glomerular filtration rate; LBBB, left bundle-branch block; RBBB, right bundle-branch block; SD, standard deviation; Tn, troponin.
Data are expressed as No. (%) or mean (standard deviation).
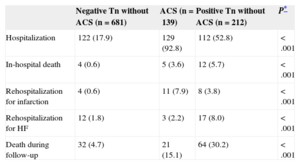
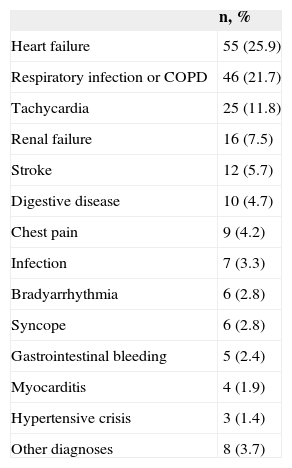
A total of 519 of 1032 patients had a single troponin measurement (most of them negative), 289 of 1032 had 2 troponin measurements, and 224 had more than 2 measurements. In our series, 174 of 284 patients who presented with chest pain as the only symptom had a negative troponin measurement. The on-duty cardiologist was consulted for most of these patients, 15 of whom were diagnosed with unstable angina based on the medical history, ECG, and stress test or cardiac catheterization results. Nearly half the patients with positive troponin not diagnosed with ACS were discharged, in contrast with patients diagnosed with ACS, who were usually hospitalized (Table 4). Patients diagnosed with ACS but not hospitalized were usually older and had considerable comorbidity or terminal medical conditions. The main diagnoses of patients with positive troponin and not diagnosed with ACS are listed in Table 5. The high prevalence of heart failure and acute chronic obstructive pulmonary disease or respiratory infection diagnoses is notable. In any case, the group of patients with positive troponin finally diagnosed with chest pain was composed of 9 patients who were specifically reviewed: all had minimal troponin elevation, most had very atypical chest pain, and most were older than 80 years. None of these 9 patients had events or rehospitalizations in the 3 months after the index date of inclusion in the registry, but 4 patients died during follow-up (3 elderly patients and a younger 52-year-old patient with severe ischemic heart disease, heart failure, severe peripheral arterial disease, and chronic obstructive pulmonary disease, respectively).
Data on Hospitalization and Events During 12-month Follow-up
| Negative Tn without ACS (n=681) | ACS (n=139) | Positive Tn without ACS (n=212) | P* | |
|---|---|---|---|---|
| Hospitalization | 122 (17.9) | 129 (92.8) | 112 (52.8) | <.001 |
| In-hospital death | 4 (0.6) | 5 (3.6) | 12 (5.7) | <.001 |
| Rehospitalization for infarction | 4 (0.6) | 11 (7.9) | 8 (3.8) | <.001 |
| Rehospitalization for HF | 12 (1.8) | 3 (2.2) | 17 (8.0) | <.001 |
| Death during follow-up | 32 (4.7) | 21 (15.1) | 64 (30.2) | <.001 |
ACS, acute coronary syndrome; HF, heart failure; Tn, troponin.
Data are expressed as No. (%).
Main Diagnosis of Undiagnosed Patients With Troponin Elevation and Acute Coronary Syndrome (n=212)
| n, % | |
|---|---|
| Heart failure | 55 (25.9) |
| Respiratory infection or COPD | 46 (21.7) |
| Tachycardia | 25 (11.8) |
| Renal failure | 16 (7.5) |
| Stroke | 12 (5.7) |
| Digestive disease | 10 (4.7) |
| Chest pain | 9 (4.2) |
| Infection | 7 (3.3) |
| Bradyarrhythmia | 6 (2.8) |
| Syncope | 6 (2.8) |
| Gastrointestinal bleeding | 5 (2.4) |
| Myocarditis | 4 (1.9) |
| Hypertensive crisis | 3 (1.4) |
| Other diagnoses | 8 (3.7) |
COPD, chronic obstructive pulmonary disease.
One specific group consisted of patients with a history of myocardial infarction (282 patients) who have positive troponin (113 patients): ACS was diagnosed in 54 patients, and the other 59 patients remained in the group of troponin elevation without ACS. Only 2 of these 59 patients went to the emergency room for chest pain alone. All others were due to other symptoms, the majority for dyspnea or a combination of different symptoms, and a final diagnosis other than ACS (heart failure and respiratory disease, mainly) was established.
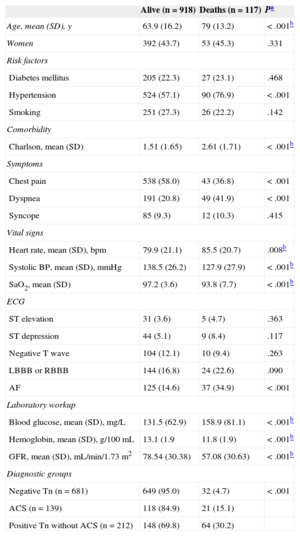
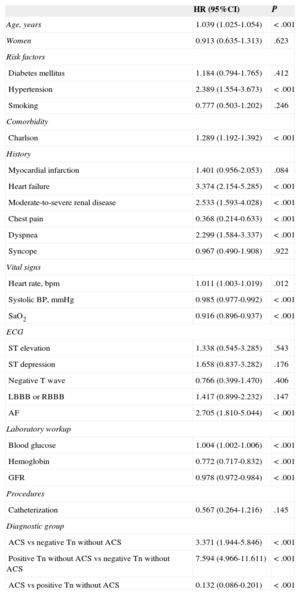
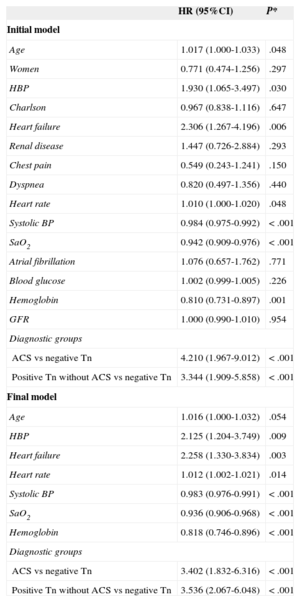
Twelve-month Follow-upIn-hospital mortality, 12-month readmission for heart failure, and 12-month mortality were significantly higher for patients with troponin elevation not diagnosed with ACS (Table 4). The 1-year survival curves in the 3 patient groups were significantly different (log rank test) (Figure 2). Survival-related variables are listed in Table 6. Patients with troponin elevation not diagnosed with ACS had worse survival than patients with ACS or patients with negative troponin without ACS in the univariate analysis (Table 7). This worse survival among patients with troponin elevation but no ACS and those with unelevated troponin was still an independent variable in the multivariate analysis (hazard ratio=3.536; 95% confidence interval, 2.067-6.048; P<.001) (Table 8) that showed no differences in patients with ACS (hazard ratio=0.962; 95% confidence interval, 0.54-1.713; P=.895).

Association Between Clinical Variables and 12-month Survival
| Alive (n=918) | Deaths (n=117) | Pa | |
|---|---|---|---|
| Age, mean (SD), y | 63.9 (16.2) | 79 (13.2) | <.001b |
| Women | 392 (43.7) | 53 (45.3) | .331 |
| Risk factors | |||
| Diabetes mellitus | 205 (22.3) | 27 (23.1) | .468 |
| Hypertension | 524 (57.1) | 90 (76.9) | <.001 |
| Smoking | 251 (27.3) | 26 (22.2) | .142 |
| Comorbidity | |||
| Charlson, mean (SD) | 1.51 (1.65) | 2.61 (1.71) | <.001b |
| Symptoms | |||
| Chest pain | 538 (58.0) | 43 (36.8) | <.001 |
| Dyspnea | 191 (20.8) | 49 (41.9) | <.001 |
| Syncope | 85 (9.3) | 12 (10.3) | .415 |
| Vital signs | |||
| Heart rate, mean (SD), bpm | 79.9 (21.1) | 85.5 (20.7) | .008b |
| Systolic BP, mean (SD), mmHg | 138.5 (26.2) | 127.9 (27.9) | <.001b |
| SaO2, mean (SD) | 97.2 (3.6) | 93.8 (7.7) | <.001b |
| ECG | |||
| ST elevation | 31 (3.6) | 5 (4.7) | .363 |
| ST depression | 44 (5.1) | 9 (8.4) | .117 |
| Negative T wave | 104 (12.1) | 10 (9.4) | .263 |
| LBBB or RBBB | 144 (16.8) | 24 (22.6) | .090 |
| AF | 125 (14.6) | 37 (34.9) | <.001 |
| Laboratory workup | |||
| Blood glucose, mean (SD), mg/L | 131.5 (62.9) | 158.9 (81.1) | <.001b |
| Hemoglobin, mean (SD), g/100 mL | 13.1 (1.9 | 11.8 (1.9) | <.001b |
| GFR, mean (SD), mL/min/1.73 m2 | 78.54 (30.38) | 57.08 (30.63) | <.001b |
| Diagnostic groups | |||
| Negative Tn (n=681) | 649 (95.0) | 32 (4.7) | <.001 |
| ACS (n=139) | 118 (84.9) | 21 (15.1) | |
| Positive Tn without ACS (n=212) | 148 (69.8) | 64 (30.2) | |
ACS, acute coronary syndrome; AF, atrial fibrillation; BP, blood pressure; ECG, electrocardiogram; GFR, glomerular filtration rate; LBBB, left bundle-branch block; RBBB, right bundle-branch block; SaO2, oxygen saturation; SD, standard deviation; Tn, troponin.
Data are expressed as No. (%) or mean (standard deviation). In the Diagnostic Groups variable, the percentage is expressed as the No. of each group.
Analysis of the Association Between the Different Variables and by Cox Regression for Survival Data
| HR (95%CI) | P | |
|---|---|---|
| Age, years | 1.039 (1.025-1.054) | <.001 |
| Women | 0.913 (0.635-1.313) | .623 |
| Risk factors | ||
| Diabetes mellitus | 1.184 (0.794-1.765) | .412 |
| Hypertension | 2.389 (1.554-3.673) | <.001 |
| Smoking | 0.777 (0.503-1.202) | .246 |
| Comorbidity | ||
| Charlson | 1.289 (1.192-1.392) | <.001 |
| History | ||
| Myocardial infarction | 1.401 (0.956-2.053) | .084 |
| Heart failure | 3.374 (2.154-5.285) | <.001 |
| Moderate-to-severe renal disease | 2.533 (1.593-4.028) | <.001 |
| Chest pain | 0.368 (0.214-0.633) | <.001 |
| Dyspnea | 2.299 (1.584-3.337) | <.001 |
| Syncope | 0.967 (0.490-1.908) | .922 |
| Vital signs | ||
| Heart rate, bpm | 1.011 (1.003-1.019) | .012 |
| Systolic BP, mmHg | 0.985 (0.977-0.992) | <.001 |
| SaO2 | 0.916 (0.896-0.937) | <.001 |
| ECG | ||
| ST elevation | 1.338 (0.545-3.285) | .543 |
| ST depression | 1.658 (0.837-3.282) | .176 |
| Negative T wave | 0.766 (0.399-1.470) | .406 |
| LBBB or RBBB | 1.417 (0.899-2.232) | .147 |
| AF | 2.705 (1.810-5.044) | <.001 |
| Laboratory workup | ||
| Blood glucose | 1.004 (1.002-1.006) | <.001 |
| Hemoglobin | 0.772 (0.717-0.832) | <.001 |
| GFR | 0.978 (0.972-0.984) | <.001 |
| Procedures | ||
| Catheterization | 0.567 (0.264-1.216) | .145 |
| Diagnostic group | ||
| ACS vs negative Tn without ACS | 3.371 (1.944-5.846) | <.001 |
| Positive Tn without ACS vs negative Tn without ACS | 7.594 (4.966-11.611) | <.001 |
| ACS vs positive Tn without ACS | 0.132 (0.086-0.201) | <.001 |
95%CI, 95% confidence interval; ACS, acute coronary syndrome; AF, atrial fibrillation; BP, blood pressure; ECG, electrocardiogram; GFR, glomerular filtration rate; HR, hazard ratio; LBBB, left bundle-branch block; RBBB, right bundle-branch block; SaO2, oxygen saturation; Tn, troponin.
Multivariate Analysis Using Cox Regression. Variables Included in the Raw (Initial) Model and Variables in the Adjusted Model (Final)
| HR (95%CI) | P* | |
|---|---|---|
| Initial model | ||
| Age | 1.017 (1.000-1.033) | .048 |
| Women | 0.771 (0.474-1.256) | .297 |
| HBP | 1.930 (1.065-3.497) | .030 |
| Charlson | 0.967 (0.838-1.116) | .647 |
| Heart failure | 2.306 (1.267-4.196) | .006 |
| Renal disease | 1.447 (0.726-2.884) | .293 |
| Chest pain | 0.549 (0.243-1.241) | .150 |
| Dyspnea | 0.820 (0.497-1.356) | .440 |
| Heart rate | 1.010 (1.000-1.020) | .048 |
| Systolic BP | 0.984 (0.975-0.992) | <.001 |
| SaO2 | 0.942 (0.909-0.976) | <.001 |
| Atrial fibrillation | 1.076 (0.657-1.762) | .771 |
| Blood glucose | 1.002 (0.999-1.005) | .226 |
| Hemoglobin | 0.810 (0.731-0.897) | .001 |
| GFR | 1.000 (0.990-1.010) | .954 |
| Diagnostic groups | ||
| ACS vs negative Tn | 4.210 (1.967-9.012) | <.001 |
| Positive Tn without ACS vs negative Tn | 3.344 (1.909-5.858) | <.001 |
| Final model | ||
| Age | 1.016 (1.000-1.032) | .054 |
| HBP | 2.125 (1.204-3.749) | .009 |
| Heart failure | 2.258 (1.330-3.834) | .003 |
| Heart rate | 1.012 (1.002-1.021) | .014 |
| Systolic BP | 0.983 (0.976-0.991) | <.001 |
| SaO2 | 0.936 (0.906-0.968) | <.001 |
| Hemoglobin | 0.818 (0.746-0.896) | <.001 |
| Diagnostic groups | ||
| ACS vs negative Tn | 3.402 (1.832-6.316) | <.001 |
| Positive Tn without ACS vs negative Tn | 3.536 (2.067-6.048) | <.001 |
95%CI, 95% confidence interval; ACS, acute coronary syndrome; BP, blood pressure; GFR, glomerular filtration rate; HBP, high blood pressure; HR, hazard ratio; SaO2, oxygen saturation; Tn, troponin.
Our study showed that a significant proportion of emergency room patients with an elevated troponin value are not diagnosed with ACS. The diagnosis of these patients is extremely heterogeneous, and their clinical profile is high risk. Moreover, their medium-term prognosis is very adverse, clearly worse than the group of patients who do not have troponin elevation and similar to that of patients with ACS.
Patients With Troponin Elevation Without Acute Coronary SyndromeThere are reports that a high percentage of patients with troponin elevation detected in the emergency room who are admitted to hospital do not have ACS.14 Troponin elevation may be detected at baseline (above 99th percentile), particularly in elderly men, irrespective of any acute cardiovascular or systemic condition.15 In the series by Javed et al16 65% of patients with troponin elevation were not classified as having myocardial infarction, very similar to the percentage we observed. These patients have high in-hospital and 6-month mortality17 compared with patients who do not have elevated troponin, and similar to16 or higher than those who have ACS.18 The diagnosis in this patient group was also very heterogeneous and very similar to that of our series. Some of these patients may meet some criteria for type 2 infarction,19 but discharge reports issued in our setting rarely list this diagnosis and often refer only to “minimal myocardial damage,” “myocardial injury,” or similar. Most likely, the high mortality during hospitalization and follow-up of these patients is closely related to their older age and greater comorbidity, as shown by the significantly higher Charlson index scores. The morbidity scale known as the Charlson index was described some years ago, and there is growing interest in the prognostic stratification of all types of patients, even in patients with ACS.20 Among these patients, a diagnosis of heart failure is often included in the history or listed as the main diagnosis under the reason for emergency care. In clinical practice, the differential diagnosis of type 1 infarction is sometimes extremely difficult in patients with heart failure and troponin elevation. In our series, the diagnosis is assigned according to clinical criteria (typical symptoms of heart failure and, in most cases, absence of chest pain), absence of ECG changes, and very slight troponin elevation. The TROPICA study21 conducted in Spanish hospitals also showed the high prevalence of troponin elevation in patients seen for acute heart failure, something that indicated poorer in-hospital and 30-day prognosis.
Almost half our patients with troponin elevation not diagnosed with ACS were discharged from the emergency room without hospitalization. This percentage may seem very high, but has also been described by other authors22 and is probably similar to that of most emergency rooms that must match hospital admissions to the patient's main diagnosis, need for acute nursing care, and hospital bed availability. Therefore, it is not surprising that elderly patients with a high-risk clinical profile but a diagnosis other than ACS are not admitted, despite increased troponin, and are managed by outpatient services.
Predictive Value and Clinical Implications of Troponin ElevationThe literature contains abundant evidence that troponin elevation is an independent predictor for short- and long-term mortality in patients hospitalized for various reasons.23–25 This evidence is normally based on studies conducted in critical patients admitted to intensive care units. Our study demonstrates that the predictive value of troponin elevation for mortality is also valid in much less critical patients, for whom hospitalization is often not considered.
LimitationsTroponin assay is usually performed according to protocol in all emergency services. However, it is known that troponin measurements are often requested when the clinical symptoms do not clearly correspond to ACS, when the data are analyzed retrospectively, or when a definitive diagnosis is obtained afterwards. In any case, because ACS can occur with other symptoms apart from chest pain, emergency room physicians often use troponin assays to rule out myocardial infarction, although the request may sometimes seem to be subjective.
Our study analyzes patient mortality and its predictive variables without taking into account that the patients were clinically managed very differently, depending on the initial diagnosis. This may seem to be an important limitation of the study, but it should be clarified that each clinical process usually has its own specific management that influences patient prognosis and, therefore, the prognosis of the various groups analyzed is inherent in some way to the management provided. For instance, patients with ACS are usually admitted for antiplatelet, anticoagulant, statin, revascularization, and other therapies, and this approach has a specific prognosis. Patients with heart failure and troponin elevation are managed according to their specific heart failure protocol, however, and troponin elevation is not presently a reason to manage a patient differently than if troponin is not elevated. This aspect should be highlighted in our study.
The variables analyzed in this study come from data retrospectively collected from emergency room and hospitalization discharge reports of patients with troponin determination These medical records may sometimes be incomplete and the medical history may be undervalued. In any case, we calculated the Charlson index to obtain general comorbidity information in the various analysis groups. Another limitation is that the cause of death is unknown in the patients who died.
The troponin determination used in our study is classified as a contemporary sensitive method.26 At present, there is no universally accepted consensus on the definition of highly sensitive troponin assays. The expert opinion26 is that the assay can be considered highly sensitive when the coefficient of variation at the value delimiting the 99th percentile is<10% and, furthermore, when at least 50% of healthy subjects (ideally 95%) have detectable values with the test method. The differentiation between a “sensitive” and “highly sensitive” test method is also not universally accepted, although it has been proposed that the term “highly sensitive” be reserved for methods able to detect concentrations below the 99th percentile in at least 50% of the healthy population and the term “sensitive” for less than 50%,12 as in the case of the test method used in this study.9
CONCLUSIONSOur findings showed that a high percentage of patients with an elevated troponin assay requested in the emergency room are not diagnosed with ACS. These patients have a high-risk clinical profile, broad heterogeneity in the main diagnosis, and an adverse prognosis at 12 months. Therefore, they should continue to be characterized, in order to implement therapeutic strategies that will improve their prognosis.
CONFLICTS OF INTERESTNone declared.