Keywords
INTRODUCTION
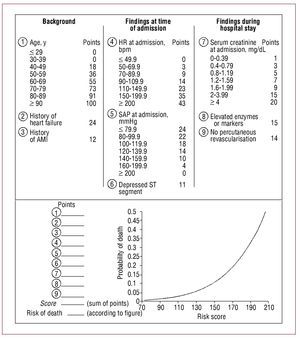
A predicted prognosis for patients with acute coronary syndrome (ACS) is considered to be a necessary instrument for stratifying risk for these patients and evaluating the potential impact of different therapeutic interventions. Recently, researchers with the GRACE study (Global Registry of Acute Coronary Events) developed a score which allows us to predict mortality 6 months after being discharged following an ACS episode.1 This score is a predictive logistical model which uses 9 prognostic variables (Figure 1) to determine the patient's probability of death due to any cause during the first 6 months following discharge. This model was created and validated for more than 20 000 patients recruited between 1999 and 2003.1 Use of the GRACE score for stratifying risk in ACS was recommended soon after by clinical practice guides.2,3

Figure 1. Risk score and nomogram from the GRACE study, for predicting mortality due to any cause in the 6 months after discharge. Adapted from Eagle et al.1 AMI indicates acute myocardial infarction; HR, heart rate; SAP, systolic arterial pressure.
However, mindful of the geographic variability that gives rise to differences in patient characteristics and medical attention models for different health systems,4,5 validations in our area will be necessary before we can use and apply the probabilistic model outside of the environment in which it was created. This will ensure that we do not receive erroneous probabilities.6,7
The purpose of our study was to validate the GRACE mortality prediction score at 6 months following an ACS episode, based on its capacities for calibration and discrimination. In this way, we will be able to verify that the model is a good predictor of mortality in a context such as a contemporary cohort of ACS patients admitted to a Spanish hospital, in which most patients were treated with a percutaneous revascularisation strategy.
METHOD
Patients
In this validation study, all demographic, clinical and angiographic variables, as well as those relating to management and complications during the hospital stay, were gathered prospectively in our department's hospitalisation unit database between February 2004 and February 2009. The information was gathered by the department's cardiologists. Patients were treated according to their main doctor's criteria and the study was approved by our centre's clinical research ethics committee. The study population consists of all consecutive patients admitted due to ACS between February 2004 and February 2009. The initial cohort contained 1361 patients. Eighty-six patients died while admitted. Data is available for all prognostic variables included in the GRACE score for 1262 (99%) of the patients who survived the initial episode. We were able to determine vital stage in all patients except for 79 (6.3%). For the validation study, we excluded patients who did not have valid data for the GRACE score and for vital state 6 months after discharge. Therefore, the final cohort for the study consisted of 1183 patients.
Variables and Definitions
The GRACE score allows us to estimate both mortality and the combined events of death or reinfarction during the hospital stay and at 6 months after discharge. The GRACE score modality which we are validating in this study is the one that enables us to estimate risk of death 6 months after discharge following an ACS episode.
ACS episodes are classified as ST-elevation myocardial infarction (STEMI) and ACS without ST elevation (NSTACS) (unstable angina and non-ST elevated MI [NSTEMI]). ST-elevation myocardial infarction is defined where there are suggestive symptoms, persistent (>20 minutes) ST segment elevation ≥1 mm in ≥2 contiguous derivation or in the presence of left bundle-branch block presumed to be a new occurrence, and elevated cardiac troponin I (cTnI≥0.2ng/dL (cut-off point for diagnosing AMI ≥0.2 ng/dL, Flex® cartridges, Dimension® system, Siemens Inc., United States). We define NSTEMI as the presence of suggestive symptoms, cTnI≥0.2ng/ dL and/or dynamic ST-segment changes (ST decrease ≥1 mm or non-persistent elevation in ≥2 contiguous derivations). Unstable angina is defined as the presence of suggestive thoracic pain with or without repolarisation abnormalities in the baseline electrocardiogram. The serum levels of cTnI must be <0.2 ng/dL 24 hours after the first symptoms appear.
Statistical Analysis
Quantitative variables are presented as the mean (standard deviation), or as the median and interquartile range. Qualitative variables are expressed as frequencies and percentages. The test or Fisher's exact test were used, as applicable, to compare qualitative variables, and Student t test to compare quantitative variables.
Calculating the GRACE Score
The GRACE score was calculated for each patient by assigning the appropriate number of points for each of the 9 prognostic variables that enters into the calculation: age, history of heart failure, history of AMI, heart rate and systolic blood pressure at admission, ST segment depression, serum creatinine at admission, elevated myocardial necrosis markers or enzymes and lack of percutaneous coronary revascularisation during admission (Figure 1). Three risk categories were established using the cutoff points set out in the GRACE study.8 Therefore, in the low-risk category, the GRACE score was 27-99 points for STEMI and 1-88 for NSTACS; in the intermediate risk category, the score for STEMI was 100-127, and 89-118 for NSTACS; and in the high-risk category, the score for STEMI was 128-263 and 119-263 for NSTACS.
Calibration
The model's calibration was evaluated using the Hosmer-Lemeshow goodness-of-fit test.9,10 This test is mainly used for validating newly created models, but it is equally useful for validating an existing logistical model with an external database, as is the case with this study. The Hosmer-Lemeshow test estimates a C statistic based on the difference between the mortality values observed in reality and those predicted by the model for different risk groups. The smaller the statistical value, the better calibrated the model. A P value >.05 indicates that the model is well adjusted to the data and therefore is a good predictor of patients' probability of death. The GRACE score's calibration was evaluated for the entire population and per subgroups representing an ACS type (STEMI and NSTACS). Next, the score calibration was tested for low, intermediate and high-risk categories in the three previously listed groups (total sample, STEMI and NSTACS).
Discrimination
GRACE score discrimination was based on its ability to distinguish between patients who will die in the 6 months after discharge and those who will survive. The capacity for discrimination was analysed by calculating the area under the ROC (receiver operating characteristic) curve (AUCROC). A model with an AUC-ROC between 0.8 and 0.9 is considered to be a model with a good capacity for discrimination.11 The AUC-ROC value was calculated for the total population, for patients with STEMI and for those with NSTACS. Since the proportion of percutaneous revascularisation procedures carried out during the hospital stay in our study was much higher than that in the original GRACE cohort, we also tested the validity of the model in groups with and without percutaneous coronary revascularisation during the hospital stay.
Follow-up
The clinical follow-up to determine vital state at 6 months after discharge was carried out retrospectively between June and August 2009 by reviewing our centre's clinical histories and databases. We had access to information about the vital stage in all patients except 79 (6.3%). Statistical analysis was performed using SPSS® software v.15.0 and MedCalc® v.9.2.0.
RESULTS
Baseline Characteristics
A total of 1183 patients was evaluated. STEMI was present in 459 (38.8%) of patients, and 724 (61.2%) had NSTACS (166 [22.9%] unstable angina). The proportion of patients in each of the 3 risk categories is shown in Table 1. The high-risk category contained 580 (49%) of the patients (Table 1). The frequency counts for the GRACE score variables in our cohort and in the derivation cohort is summarised in Tables 2 and 3. The percentage of males, diabetes mellitus and elevated myocardial necrosis markers was significantly higher in our series; the percentage of smokers/ former smokers, previous history of AMI and heart failure was significantly higher in the GRACE score derivation cohort. The mean systolic blood pressure and serum creatinine level at admission was slightly but significantly lower in our cohort.


Management, Hospital Stay Complications, and Treatment Upon Discharge
There was a higher percentage of percutaneous coronary revascularisation procedures during hospitalisation in our series (71.5% versus 26.6%, P<.001), as well as a higher percentage of thienopyridine, heparin, and statin prescriptions (P<.001). However, the percentage of thrombolytic and prescription of ASA, ACE inhibitors or AIIRA, beta-blockers, calcium antagonists, Anti- IIb/IIIa agents and diuretics was larger in the GRACE register (P<.001) (Table 3). In our cohort, we observed a higher hospital stay complication rate except for cardiogenic shock, which had a slightly higher incidence rate in the GRACE study (0.6% versus 1.3%; P=.05).

Upon discharge, patients in our series were more likely to receive treatment with thienopyridines, ACE inhibitors, or AIIRA and statins (P<.001) (Table 3).
Mortality
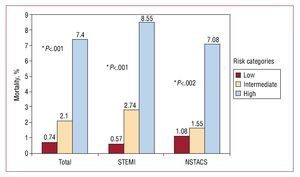
By 6 months after their discharge, 52 (4.4%) of patients had died (17 [3.7%] in the STEMI group and 35 [4.8%] in the NSTACS group [P=.4]). Figure 2 shows the distribution of mortality by any cause 6 months after discharge, broken down into low, intermediate and high-risk categories. We observe that the mortality rate increased significantly as the risk category increased. The differences we observed proved to be significant upon comparing the 3 categories in each group (total population, STEMI, and NSTACS) and comparing the intermediate risk to the low risk group for the total sample and for STEMI. However, there were no significant differences in the mortality rate between the intermediate and low-risk categories for NSTACS (Figure 2).

Figure 2. Mortality at 6 months for the 3 risk categories in the total population, for STEMI and NSTACS. *Shows P-values from the comparison between the 3 categories in each group. The comparison of the intermediate and low risk categories was .009 in the sample total, .02 in the STEMI group, and .6 in the NSTACS group.
Calibration and Discrimination
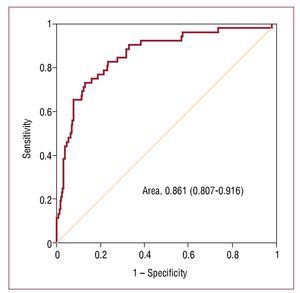
Model calibration was excellent for the population as a whole, for STEMI and for NSTACS (Table 4). The specific analysis for groups that did and did not undergo percutaneous coronary revascularisation during the hospital stay did not affect the model's predictive ability or calibration (Table 4). The mortality predicted by the model approaches real values for the 3 risk categories; the approximation is much closer for the high-risk categories (Table 5). The validated model shows an adequate capacity for discrimination, with an AUC-ROC of 0.86 (95% CI, 0.897-0.916; P<.001) (Figure 3). The model's capacity for discrimination was also good for both STEMI and NSTACS (Table 4).

Figure 3. ROC curve for the model for the entire study population.

DISCUSSION
Clinical practice guides emphasise the importance of stratifying risk for ACS patients.2,3,12 This fact is particularly important for high-risk patients who benefit more from aggressive treatment, and who, paradoxically enough, seldom receive it.13-16 Application of the GRACE1 score was recently recommended by clinical practice guides.2,3 However, proper use of a certain score requires well-contextualised validations in order for us to be sure that it is not providing faulty probabilities.
The main finding of the present study is the first validation of the GRACE score by a Spanish hospital. The value obtained from the C statistic in the Hosmer-Lemeshow test was >0.1 in all of the analyses we performed. This permits us to state that in our cohort, the model offers a good calibration of the probability of death within 6 months of discharge following an ACS episode. The discriminatory capacity of the model was tested by using the AUCROC, which was >.80 in all of the tests we ran. With these data, it is possible to conclude that the GRACE score has been validated, and that it is a useful, reliable clinical tool. The resulting predictions of the probability of death within 6 months of discharge are valid and conform to the real risk presented by patients in our series, for the total population, the STEMI group, and the NSTACS group. Although we observed that the model is better adjusted to the risk of death of patients in high risk categories when we grouped the population into risk groups, the tendency toward over- or underestimating risk in other categories was very slight (<0.7%) (Table 5).

In our study, total mortality by 6 months (4.4%) is consistent with that observed in the GRACE register (4.8%).1 The mortality observed for patients who presented STEMI (3.7%) and NSTACS (4.8%; P=.04) was also similar to that found in the GRACE register (4.8% in both groups).17 Observing increased mortality where the GRACE score increased was consistent for the total population, and the STEMI and NSTACS groups. That is, when the calculated scores were grouped into low, intermediate and high risk categories, the 3 categories were associated with significant differences in mortality for each of the 3 study groups. These findings are consistent with those from other studies in which mortality was seen to increase as the GRACE score increased.18-21 Although comparing mortality among the 3 risk categories turned up significant differences in the total sample, the STEMI group and the NSTACS group (Figure 2), when we compare mortality between the intermediate and low-risk categories for NSTACS, we find no significant differences. In an analysis of results from a substudy in the MASCARA register,22 no differences were found between the intermediate and low risk categories for NSTACS. Therefore, both were grouped in a single category and subsequently compared with the high-risk category. This also supports our study, in which there were no significant differences in mortality at 6 months between the low and intermediate-risk categories in the NSTACS group (1.08% and 1.55%, respectively; P=.6).
The median GRACE score for the total sample and for the NSTACS group was similar to that calculated by González-Ferreira et al22 and Elbarouni et al.23 In our study, however, the median score for the STEMI group was lower than that found by Elbarouni et al.23 This may be partially due to our study's different distribution among some of the prognostic variables that constitute the model. The model's capacity for discrimination and calibration were both excellent in our series, and they agree with another study carried out in a neighbouring country.21 Furthermore, our series offers a more "contemporary" evaluation of the GRACE model for predicting mortality within a 6-month follow-up period. Another peculiarity of our work is that the validation study was carried out in a cohort independent from the GRACE register. This means that it is an external validation study in the true sense of the term, unlike the one carried out by Elbarouni et al23 in which part of the cohort used in the validation study had also contributed to developing the GRACE score.
The high proportion of percutaneous coronary revascularisation found in our cohort (71.5%) most likely reflects how aggressive treatment of ACS has become widespread in recent years. In addition, our study was carried out in a centre with an interventional cardiologist in residence, unlike the multi-centre GRACE study, in which there was no uniform availability of such a resource.4 Given the notable difference in the percentage of percutaneous revascularisations in the GRACE study, we performed a specific analysis of the groups who did and did not undergo percutaneous coronary revascularisation while hospitalised. The results of the preliminary analysis did not change the model's predictive capacity or calibration (Table 4).
Other GRACE score validations have been carried out in Portugal,21 Canada,18-20,23,24 and most recently in the UK.25 In Portugal, Araújo Gonçalves et al21 did a single-centre study of 460 AMI patients recruited between 1999 and 2001 to validate the GRACE score for predicting risk of death or AMI within follow-up periods of 30 days and 1 year. Validation indices found in this study were adequate (Hosmer-Lemeshow P value >.1 and AUC-ROC at 0.67 and 0.72 for estimating risk of death or AMI within follow-up periods of 30 days and 1 year respectively). In the UK, Gale et al25 observed in their multi-centre study that the GRACE score offers an excellent capacity for discrimination (AUC-ROC, 0.80) for predicting mortality 6 months after discharge. Calibration for this GRACE score modality was not tested in this study. Lastly, the validity of the GRACE score was evaluated in 5 multi-centre studies in Canada.18-20,23,24 Two of these studies assessed the validity of the GRACE score for predicting mortality at 6 months. The model showed excellent discrimination in both tests (AUC-ROC, 0.80). However, while calibration was good in one of these studies (Hosmer-Lemeshow, P>.3),19 it was not optimal in the other study18 which observed the model's tendency toward slightly overestimating the risk of death of NSTEMI patients (Hosmer-Lemeshow, P=.06).
Limitations
The GRACE score allows us to estimate both mortality and the combined events of death or reinfarction during the hospital stay and at 6 months after discharge.26 One of our study's limitations is that it does not validate the GRACE prognostic score across all of its modalities. Another limitation of our study is that it was carried out in a single centre. For this reason, our results should only be applied with caution to other centres with different population and medical service profiles. One limitation of any risk score is that while it may discriminate well between different risk groups, it does not necessarily predict individual risk correctly.
CONCLUSIONS
In our population, the GRACE score for predicting mortality at 6 months from discharge was properly validated, and may be used for estimating risk of death at 6 months for ACS patients. In our population, it makes sense to include the GRACE risk score on ACS care reports. More studies, preferably multi-centre ones, will be necessary to confirm our findings and validate all of the GRACE score modalities.
ABBREVIATIONS
ACS: acute coronary syndrome
AUC: area under the curve
GRACE: Global Registry of Acute Coronary Events
NSTEMI: non-ST-elevation myocardial infarction
ROC: receiver operating characteristic
STEMI: ST-elevation myocardial infarction
SEE ARTICLE ON PAGES 629-32
Correspondence: Dr. E. Abu-Assi.
Hospital Clínico Universitario. Servicio de Cardiología.
Avda. Choupana, s/n. 15706 Santiago de Compostela. A Coruña. España.
E-mail: eabuassi@yahoo.es
Received September 29, 2009.
Accepted for publication December 23, 2009.