Recent guidelines on arterial hypertension regard increased carotid intima–media thickness (IMT) as a marker of end-organ damage. However, these guidelines do not specify whether the maximum or mean IMT should be used as an indicator. The aim of this study was to compare these two measures and their relationship to atherosclerotic burden. The study involved 215 consecutive hypertensive patients who were divided into three groups according to their IMT: maximum IMT >0.9mm (with mean IMT<0.9mm); mean IMT >0.9mm (i.e. mean and maximum IMT >0.9mm); and normal IMT. Patients with a pathologically raised IMT (whether maximum or mean value) were more likely to be dyslipidemic, were older, had a longer history of hypertension, and had a poorer glomerular filtration rate and ankle–brachial index. Patients with a mean IMT >0.9mm were more likely to have carotid plaque, carotid stenosis and a low ankle–brachial index than those with a maximum IMT >0.9mm. The mean IMT provided a better indication of atherosclerotic burden in patients with hypertension.
Keywords
The changes in the arterial wall that atherosclerosis produces progress slowly over a long subclinical period, and are characterized by endothelial damage and diffuse thickening of the arterial intima. These initial phases of the disease can be diagnosed by ultrasound measurement of the arterial intima-media thickness (IMT), especially that of the carotid artery. In comparison with other traditional risk factors, the carotid IMT is the risk factor most commonly associated with cardiovascular disease,1, 2 and predicts the occurrence of stroke and acute myocardial infarction.3, 4 Thus, it is not surprising that its determination in individual cardiovascular risk stratification and end-organ damage appears in recent hypertension (HT) guidelines; a thickness of more than 0.9mm is considered to indicate the presence of disease.5 At the present time, software for automated border detection is available that makes it possible to obtain the mean and maximum carotid IMT values rapidly and reproducibly, although there is debate as to which of these two measurements should be employed in the risk assessment of the hypertensive patient. The purpose of this report is to determine which of these values, the mean or the maximum carotid IMT, is associated with a greater atherosclerotic burden and, thus, a higher cardiovascular risk in a population of hypertensive patients.
MethodsWe analyzed 215 consecutive hypertensive patients referred from 2008 to 2009 to an arterial HT unit pertaining to a cardiology department. The medical history was recorded and a physical examination and laboratory tests were carried out in all the patients. In addition, the major cardiovascular risk factors and personal history were included in the evaluation. For the detection of end-organ damage, we determined the 24-h microalbuminuria and the ankle-brachial index (ABI) and performed an echocardiogram for the calculation of left ventricular mass and a carotid ultrasound in B mode for the determination of the IMT. The measurement was carried out in the posterior wall of both common carotid arteries, at a distance of 1cm from the carotid bifurcation,6 by means of a 7-mHz vascular probe (Vivid 7®, General Electric). Using a software package for automated border detection loaded on the system (EchoPAC®, General Electric), the maximum and mean carotid IMT values were obtained (Figure 1). Likewise, the entire carotid system was analyzed in search of atherosclerotic plaques.

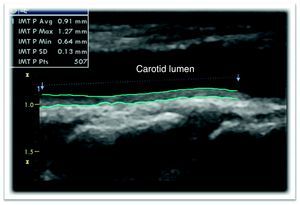
Figure 1. Carotid ultrasound showing a pathological increase in the mean (0.91 mm) and the maximum (1.27 mm) carotid intima-media thickness by means of automated border detection. IMT, intima-media thickness.
In agreement with the recommendations, end-organ damage was considered to be present when the IMT values were >0.9mm and/or plaques were observed.5 The patients were ultimately classified into three groups according to their carotid IMT: maximum IMT >0.9mm (with mean IMT<0.9mm); mean IMT >0.9mm (with maximum IMT >0.9mm); and a third group with normal IMT (both values<0.9mm).
Statistical AnalysisThe quantitative variables are expressed as measures of central tendency and of dispersion and the categorical variables as relative frequencies. The normal distribution of the continuous variables was examined using the Kolmogorov-Smirnov test. To compare them, Student's t test was employed when normality was confirmed or the Mann-Whitney test when they did not follow a normal distribution. The analysis of the categorical variables was performed using the χ2 test. If the expected frequency was lower than 5, Fisher's exact test was utilized.
A binary logistic regression model was used to determine the relationship between an IMT indicative of disease and the different risk factors, including the variables that were found to be statistically significant in the bivariate analysis or the clinical impact of which had been verified in previous studies (sex and smoking). Carotid stenosis >50% was not included, given that its prevalence was low in our study. The SPSS 15.0 statistical software package was utilized. A P<.05 was considered to indicate statistical significance.
ResultsA total of 215 patients with a mean age of 56±13 years were included. Table 1 shows the main characteristics of the population studied.
Table 1. Baseline Characteristics of the Population Analyzed.
| Total population (n=215) | Pathological carotid IMT (n=149) | Normal carotid IMT (n=66) | P | |
| Age, mean (SD), years | 56 (13) | 60.93 (11.3) | 47.7 (12.5) | <.001 |
| Men, n (%) | 153 (71.2) | 112 (75.2) | 41 (62.1) | .072 |
| Diabetes mellitus, n (%) | 47 (21.9) | 34 (22.8) | 13 (19.7) | .721 |
| Active smoking, n (%) | 61 (28.4) | 46 (30.9) | 15 (22.7) | .1 |
| Dyslipidemia, n (%) | 90 (41.9) | 72 (48.3) | 18 (27.3) | .004 |
| Ischemic heart disease, n (%) | 12 (5.6) | 11 (7.4) | 1 (1.5) | .11 |
| CVA, n (%) | 14 (6.5) | 13 (8.7) | 1 (1.5) | .069 |
| Weight, mean (SD), kg | 85.29 (16.98) | 85.24 (16.9) | 85.41 (17.29) | .924 |
| Height, mean (SD), cm | 1.66 (0.09) | 1.66 (0.09) | 1.67 (0.093) | .379 |
| Abdominal circumference, mean (SD), cm | 103.27 (13.91) | 104.6 (13.61) | 100.17 (14.22) | .34 |
| SAP, mean (SD), mmHg | 156.37 (23.88) | 157.94 (24.5) | 152.82 (21.82) | .24 |
| DAP, mean (SD), mmHg | 89.66 (14.67) | 89.25 (14.79) | 90.59 (14.49) | .59 |
| Glucose, mg/dL a | 105 [23] | 107 [33.5] | 105 [26.25] | .811 |
| Creatinine, mean (SD), mg/dL | 0.97 (29.24) | 1.01 (0.31) | 0.87 (0.211) | .01 |
| HDL-C, mean (SD), mg/dL | 48.6 (12.88) | 47.19 (12.65) | 51.77 (12.91) | .016 |
| GFR, mean (SD), mL/min | 84.65 (22.52) | 80.3 (20.88) | 94.5 (20.07) | <.001 |
| 24-h Malb, mg a | 10.25 [22.55] | 15.05 [53.23] | 9.9 [28.1] | .057 |
| LVM/BSA a | 96.87 [37.21] | 107.62 [34.67] | 88.61 [33.84] | <.001 |
| History of HT, y a | 5.47 [73.75] | 8 [14.98] | 2.92 [9.47] | <.001 |
| Carotid plaque, n (%) | 95 (45.5) | 86 (58.1) | 9 (14.8) | <.001 |
| Carotid stenosis >50%, n (%) | 10 (5) | 10 (7.1) | 0 | .036 |
| ABI, mean (SD) | 1.07 (0.17) | 1.05 (0.18) | 1.11 (0.15) | .031 |
ABI, ankle-arm index; CVA, cerebrovascular accident; DAP, diastolic arterial pressure; GFR, glomerular filtration rate; HDL-C, high-density lipoprotein cholesterol; HT, hypertension; IMT, intima-media thickness; LVM/BSA, left ventricular mass indexed by body surface area; Malb, microalbuminuria; NS, not significant; SAP, systolic arterial pressure; SD, standard deviation.
a In these variables, which did not show a normal distribution, the Mann-Whitney test was used and the results are expressed as the median [interquartile range].
Once the carotid IMT had been determined, the patients were divided into three groups characterized as follows: 82 patients (38.1%) had a maximum IMT >0.9mm, 67 patients (31.1%) had a mean IMT >0.9mm and only 66 patients (30.7%) had a normal IMT.
In the study to compare these three populations, it was observed that the patients with an IMT indicative of disease (whether the maximum or the mean) were significantly older and had a higher prevalence of dyslipidemia and previous cerebrovascular accident, a longer history of HT and a lower renal filtration rate than the patients with a normal carotid IMT (Table 1). Likewise, the presence of carotid plaques and stenoses was also more marked and the ABI was worse in the groups with abnormal IMT.
In the multivariate analysis, the main factors associated with a carotid IMT indicative of disease were age (odds ratio [OR]=1.12; 95% confidence interval [CI], 1.07-1.18; P<.001), active smoking (OR=5; 95% CI, 1.72-14.5; P<.001), male sex (OR=3.89; 95% CI, 1.51-10.02; P=.005) and the time elapsed since the onset of HT (OR=3.07; 95% CI, 1.59-5.93; P<.001).
When we analyzed the patients with a carotid IMT indicative of disease, we observed a higher prevalence of carotid plaques, carotid stenosis >50% and a lower ABI in the group with a mean IMT >0.9mm, as compared to the group with a maximum IMT >0.9mm (Table 2).
Table 2. Comparative Analysis of the Patients With a Pathological Carotid Intima-Media Thickness.
| Maximum carotid IMT (n=82) | Mean carotid IMT (n=67) | P | |
| Age, mean (SD) years | 59.8 (11.38) | 62.31 (11.13) | .179 |
| Men, n (%) | 60 (73.2) | 52 (77.6) | .57 |
| Diabetes mellitus, n (%) | 19 (23.2) | 15 (22.4) | .9 |
| Active smoking, n (%) | 25 (30.5) | 21 (31.3) | .94 |
| Dyslipidemia, n (%) | 47 (57.3) | 25 (37.3) | .015 |
| Ischemic heart disease, n (%) | 5 (6.1) | 6 (9) | .54 |
| CVA, n (%) | 6 (7.3) | 7 (10.4) | .567 |
| Weight, mean (SD), kg | 87.28 (1.69) | 82.73 (15.65) | .105 |
| Height, mean (SD), cm | 1.66 (0.1) | 1.66 (0.09) | .84 |
| Abdominal circumference, mean (SD), cm | 105.98 (14.62) | 102.93 (12.17) | .179 |
| SAP, mean (SD), mmHg | 158.2 (25.6) | 157.63 (24.9) | .94 |
| DAP, mean (SD), mmHg | 90.73 (14.31) | 87.43 (15.26) | .141 |
| Glucose, mg/dL a | 109 [32.5] | 106 [36] | .299 |
| Creatinine, mean (SD), mg/dL | 0.98 (0.25) | 1.04 (0.37) | .272 |
| HDL-C, mean (SD), mg/dL | 47.4 (13.12) | 46.94 (12.15) | .82 |
| GFR, mean (SD), mL/min | 80.79 (21.19) | 79.52 (20.64) | .675 |
| 24-h Malb, mg a | 14.95 [58.45] | 15.5 [50.97] | .25 |
| LVM/BSA a | 103.17 [35.06] | 110.27 [36.44] | .14 |
| History of HT, years a | 8.55 [16.33] | 7.3 [13.48] | .41 |
| Carotid plaque, n (%) | 39 (48.1) | 47 (70.1) | .007 |
| Carotid stenosis >50%, n (%) | 2 (2.6) | 8 (12.5) | .023 |
| ABI, mean (SD) | 1.08 (0.18) | 1.01 (0.16) | .01 |
ABI, ankle-arm index; CVA, cerebrovascular accident; DAP, diastolic arterial pressure; GFR, glomerular filtration rate; HDL-C, high-density lipoprotein cholesterol; HT, hypertension; IMT, intima-media thickness; LVM/BSA, left ventricular mass indexed by body surface area; Malb, microalbuminuria; SAP, systolic arterial pressure; SD, standard deviation.
a In these variables, which did not show a normal distribution, the Mann-Whitney test was used and the results are expressed as the median [interquartile range].
Our study demonstrated for the first time an interesting and largely unclarified finding in the HT guidelines, namely the closer approximation to the atherosclerotic burden of the hypertensive patient by determining the mean carotid IMT rather than the maximum value, translated into a lower ABI and a higher prevalence of carotid plaques and stenoses, although the incidence of the latter was low in our study.
A number of reports have shown that the increase in the carotid IMT and plaques in that zone, regardless of whether or not they are stenotic, are associated with an increase in the relative risk of having a cardiovascular event -- the higher the value, the greater the increase in risk.3 Thus, the current European guidelines for HT consider a carotid IMT value >0.9mm to be a marker of end-organ damage and, therefore, an identifier of a high-risk patient.5 However, this dichotomous and simplistic difference presents two great limitations. On the one hand, emerging clinical evidence indicates that, below certain values, the carotid IMT does not reflect atherosclerotic disease as such, although it would reflect the vascular changes produced by aging and the adaptive response of the vessel to the increase in the hemodynamic load provoked by HT.7 Pathological studies have shown that intimal hyperplasia associated with age and fibromuscular hyperplasia secondary to HT can increase the carotid IMT in the absence of atherosclerotic plaques. In fact, the close relationship between carotid IMT and age has been completely established, with the thickness ranging between 0.7mm and 1.5mm, and increasing by 0.01mm to 0.02mm for each year of life. Thus, we must be aware of the significant effect of age in overall cardiovascular risk models. Said effect is so intense that it is improbable that young adults (especially women) reach a high degree of risk, despite there being more than one risk factor and a clear increase in the relative risk (underestimation), while, in the elderly, aging itself could cause the increase in the carotid IMT and this index would be overestimated.
Another important question about which there is no consensus concerns which measure of the carotid IMT, the maximum or mean value, to utilize in the prognostic evaluation of the hypertensive patient. A number of authors report that the maximum value would be that which would best correlate with future cardiovascular events, although they do not specify the reason for choosing this value over the mean value.8 In contrast, other authors establish the mean carotid IMT as the most accurate value and that least susceptible to error, since the maximum value could reflect more advanced stages of focal thickening toward plaque formation.6 There is no definitive response to this question and there is a need for a standardized protocol that clarifies this controversy. In this respect, our study demonstrates that the use of the mean carotid IMT (regardless of the presence or absence of plaques) is more closely associated with the atherosclerotic burden of the hypertensive patient than the maximum carotid IMT.
Conflicts of interestNone declared.
Received 9 April 2010
Accepted 19 June 2010
Corresponding author: Servicio de Cardiología, Hospital Universitario de San Juan, Ctra. Valencia-Alicante s/n, 03550 Sant Joan d’Alacant, Alicante, Spain. pedromorillas@teleline.es